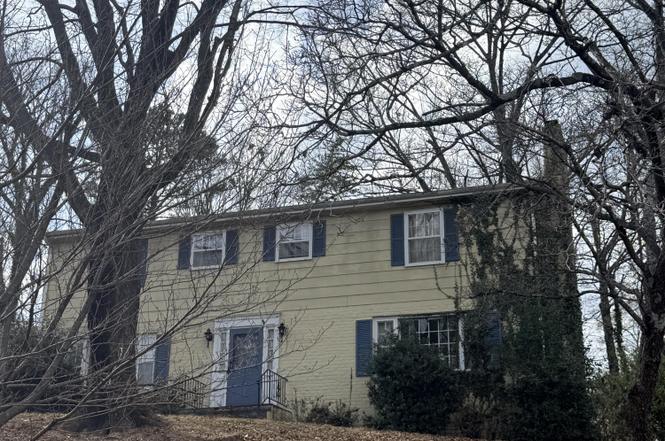
3943 Park Ln SW · Roanoke, VA
Flood risk 1/10 · Minimal
- FEMA flood zone
- X (unshaded)
- Chance of flooding over 30 yrs
- 0.0%
- Est. flood insurance / yr
- $473 – $860
Fire risk 3/10 · Minor
- Est. fire insurance / yr
- $666 – $1,236
Heat risk 5/10 · Moderate
- Hot days now (above 100°F)
- 7 days/yr
- Hot days in 30 yrs
- 19 days/yr
Wind risk 2/10 · Minimal
- Chance of severe wind over 30 yrs
- 1.0%
Air-quality risk 2/10 · Minimal
- Unhealthy air days now
- 0 days/yr
- Unhealthy air days in 30 yrs
- 1 days/yr
Risk factors via First Street. Map © Google.
Why this score? — see what drove the B grade
The composite is a weighted blend of 9 inputs, each scored 0–100. Each bar is that input's sub-score; the figure is the points it added to the 100-point composite (weight × sub-score).
- Cash flow +30.0/30.0
- 1% rule +10.0/10.0
- DSCR +10.0/10.0
- ARV discount +7.5/15.0
- Rent growth +4.1/5.0
- Schools +4.1/10.0
- Livability +3.7/5.0
- Condition / age +2.5/5.0
- Appreciation +0.0/10.0
$135,000
🖨 Deal sheet 📄 Offer letter ✓ Due diligence
Listing remarks
This majestic home is located in highly sought after Jefferson Park in Southwest Roanoke City. Just minutes to everywhere. Add your own flair as you remodel and update this home, bringing it back to its glory.
Key facts
- 0.44 acre lot
- Garage
- Built 1970
Neighborhood map
What this means for you Summary
Snapshot
- This is a 4-bed/3.0-bath single-family listed at $135k.
Deal economics
- At list price, monthly cash flow is $1k ($13k/yr) — positive.
- The deal already cash-flows at list — no discount required.
- Meets the 1% rule at list price ($3k rent vs $135k).
- Cap rate 15.7% vs local median 4.2% in Roanoke — top-decile yield for the area; either an underpriced asset or a hidden risk that comps aren't pricing in. Stress-test before assuming the spread holds.
Location & tenants
- Location reads 73/100 on livability (#163 in VA) — a middle-class / working-renter tenant base. Strengths: cost of living A+, health & safety A+, housing A; Watch: amenities C-, employment D, crime F.
- Roanoke City Public School District (urban): math 40% / reading 58% proficiency, ranked #102 of 131 in VA (top 78%) — families likely to look elsewhere, expect single-tenant / working-renter base with shorter leases; 67% free/reduced lunch — lower-income household profile, screen leases tightly.
- Zoned schools: Fishburn Park Elementary (math 47% / reading 67%, grade C+, #597 of 1,108 statewide, top 57%, 292 students, 104% FRL); James Madison Middle (math 41% / reading 68%, grade B-, #194 of 342 statewide, top 60%, 580 students, 96% FRL); Patrick Henry High (math 57% / reading 77%, grade B, #185 of 319 statewide, top 61%, 2,005 students, 95% FRL) — zoned schools average 98% FRL vs 67% district-wide (32 pts higher); higher-poverty schools than district average — tighter screening recommended.
- Market conditions: Rents rising fast (+6.4%/yr); 120 active listings in the ZIP; 9 comparable units currently listed for rent nearby; rentals at typical pace (median 21d on market — plan ~3-4 weeks tenant-placement turnaround); 44% of comp listings sitting > 30 days — soft ceiling on asking rent; 113 units permitted in Roanoke city in 2024 (0 in 5+ unit buildings).
- At $2,779/mo this rent would consume 48% of the median local household income ($70k/yr) (locally 525% of renters already pay >50% of income on rent) — very limited rent-growth headroom before tenants either downsize or default.
Forward outlook
- Local home prices are declining (-3.0%/yr); year-one equity from $933 of loan paydown is wiped out by about $4k of value loss. Plan a longer hold.
- Roanoke County population projected at +11% by 2050 — modest demand growth; plan on rents tracking national, not racing it.
- At projected returns (-3.0% appreciation + 6.4% rent growth), your $38k cash investment doubles in ~4 years — after that, you're playing with house money.
Negotiation context
- Only 0 days on market — expect competitive offers; lowballing is unlikely to land.
- Current owner paid $43k; list at $135k implies a 214% gain — meaningful room to come down on a strong offer.
Risks & watch-outs
- Watch-outs: property tax is 3.3% of price.
- Climate carrying-cost: extreme-heat days projected 7→19/yr by 2055 (HVAC capex compounding) — expect insurance premiums to compound above CPI over the hold.
Questions for the listing agent
- Built in 1970 — when were the roof, HVAC, electrical panel, plumbing, and water heater last replaced?
- Property tax is high relative to price — has the assessment been appealed recently, and will the sale trigger a re-assessment?
- Is there a deadline driving the sale (1031 exchange, divorce, estate, relocation)? That informs how much negotiation room exists.
- Schools are A-rated — typically a magnet for longer-tenancy family renters. What's the average tenant stay here, and is there a school-zone premium baked into asking?
- Crime grade is F in this area — have there been break-ins, vandalism, or insurance claims at this property in the last 3 years? What carrier currently insures it and at what premium?
- What's the average days-on-market for RENTAL listings here right now (not sales)? A rising rental-DOM trend means longer vacancies and softer asking-rent achievability than the comps imply.
- What's the recent tenant-quality profile in this submarket — average credit score on applications, eviction rate, late-payment / NSF rate, and stable-employment percentage? A property-management company in the area should have these aggregated.
- How much new for-sale + rental construction is in the pipeline within 1–3 miles? Heavy new supply typically softens prices + rents 12–24 months out; constrained supply supports both.
Investment metrics
- 1% rule
- 2.06% ✓
- Cap rate
- 15.73%
- Cash-on-cash
- 33.69%
- DSCR
- 2.50
- GRM
- 4.0
CMA / ARV
- ARV (on-the-fly)
- $364,095
- Comps found
- 12
Show comp detail 12 sales within ~0.75 mi
| Address | Dist | Beds/Ba | Sqft | Sold | Price | $/sf | Match |
|---|---|---|---|---|---|---|---|
| 3857 Park Ln SW | 0.11mi | 3/3.0 (-1) | 2,788 (+11%) | 8mo | $403,000 | $145 | 65 |
| 3558 Hartland Rd SW | 0.55mi | 3/2.5 (-1) | 2,626 (+5%) | 2mo | $350,000 | $133 | 58 |
| 3430 Ashmeade Dr | 0.72mi | 3/3.0 (-1) | 2,533 (+1%) | 6mo | $300,000 | $118 | 55 |
| 3352 Colonial Ave | 0.52mi | 4/2.0 | 2,610 (+4%) | 19mo | $274,500 | $105 | 50 |
| 3717 Dogwood Ln SW | 0.37mi | 3/2.0 (-1) | 2,249 (-10%) | 13mo | $450,000 | $200 | 45 |
| 3319 Pasley Ave SW | 0.61mi | 4/2.0 | 2,645 (+5%) | 18mo | $402,500 | $152 | 44 |
| 2581 Inglewood Rd SW | 0.60mi | 3/2.5 (-1) | 2,791 (+11%) | 7mo | $441,000 | $158 | 40 |
| 3723 Crescent Ridge Dr SW | 0.71mi | 4/2.5 | 2,192 (-13%) | 5mo | $423,500 | $193 | 40 |
| 2521 Inglewood Rd SW | 0.59mi | 3/2.0 (-1) | 2,665 (+6%) | 18mo | $340,000 | $128 | 38 |
| 3520 Robyn Rd SW | 0.60mi | 3/2.0 (-1) | 2,748 (+9%) | 14mo | $330,000 | $120 | 36 |
| 3334 Belshire Ct SW | 0.74mi | 3/2.5 (-1) | 2,733 (+9%) | 15mo | $600,000 | $220 | 31 |
| 3582 Berryhill Dr | 0.71mi | 4/1.5 | 2,135 (-15%) | 10mo | $301,000 | $141 | 27 |
Match score weights: distance 35% · size 25% · config 20% · recency 20%. Top-matched comps best support the ARV.
Projected returns pro-forma
-3.0% appreciation · 6.39% rent growth · sell at horizon
- IRR
- 33.2%
- Equity multiple
- 2.47×
- Total profit
- $55,680
- Equity at exit
- $20,129
- IRR
- 42.2%
- Equity multiple
- 5.74×
- Total profit
- $179,308
- Equity at exit
- $11,672
Cash invested: $37,800 (down + closing). Projections, not guarantees.
Landlord ↔ Tenant lean methodology
- Overall (STATE)
- 55 Moderately Landlord-Leaning
- State Virginia
- 55 Moderately Landlord-Leaning · D+2
- County
- — inherits STATE
- City
- — inherits STATE
ZIP-level market 24015
- Rents YoY
- 6.4%
- Active inventory
- 120
- Price-to-rent
- 4.0×
Monthly cashflow live
- Estimated rent
- $2,779 high interval (Pro) →
- Mortgage (P&I)
- −$708
- Tax from tax record
- −$370 /mo · $4,436/yr
- Insurance
- −$56
- HOA
- −$0
- Vacancy / Maint / Mgmt
- −$584
- Net cashflow
- $1,061
Break-even live
UW: 25.0% down · 7.5% · 30yr · 1.5% tax · 5.0% vac · 8.0% maint · 8.0% mgmt
Financing live
Cash to close
- Down payment
- $33,750
- Closing costs
- $4,050
- Reserves months
- —
- Total cash needed
- —
Loan-product check · same deal, 3 products live
Conventional
25% down · 7.5% · 30yr
- Down + closing
- —
- Monthly P&I
- —
- Monthly cashflow
- —
- DSCR
- —
- Eligible?
- —
Personal DTI + credit; lowest rate.
DSCR
20% down · 8.5% · 30yr
- Down + closing
- —
- Monthly P&I
- —
- Monthly cashflow
- —
- DSCR
- —
- Eligible?
- —
No personal income docs; deal must DSCR.
Hard money
10% down · 12.0% · 12mo
- Down + closing
- —
- Monthly P&I
- —
- Monthly cashflow
- —
- DSCR
- —
- Eligible?
- —
Short-term bridge; refi at stabilization.
Rent comps 9 comps
| Address | Beds | Baths | Sqft | Rent | $/sqft | DOM | Units | Dist |
|---|---|---|---|---|---|---|---|---|
| 3711 Crescent Ridge Dr SW Roanoke, VA | 4.0 | 2.5 | 2232 | $2,899 | $1.30 | 21d | 1 | 0.71mi |
| 2923 Evergreen Ln SW Roanoke, VA | 4.0 | 3.5 | 2240 | $3,195 | $1.43 | 21d | 1 | 1.21mi |
| 2917 Evergreen Ln SW Roanoke, VA | 4.0 | 3.5 | 2240 | $3,195 | $1.43 | 21d | 1 | 1.21mi |
| 2911 Evergreen Ln SW Roanoke, VA | 4.0 | 3.5 | 2240 | $3,195 | $1.43 | 21d | 1 | 1.21mi |
| 3427 Evergreen Ln SW Roanoke, VA | 4.0 | 3.5 | 2240 | $3,195 | $1.43 | 44d | 1 | 1.26mi |
| 3423 Evergreen Ln SW Roanoke, VA | 4.0 | 3.5 | 2240 | $3,195 | $1.43 | 44d | 1 | 1.27mi |
| 3419 Evergreen Ln SW Roanoke, VA | 4.0 | 3.5 | 2240 | $3,195 | $1.43 | 44d | 1 | 1.29mi |
| 3113 Clearview Dr Roanoke, VA | 4.0 | 2.0 | 2883 | $2,890 | $1.00 | 44d | 1 | 1.44mi |
| 3394 Kelly Lane Ext Roanoke, VA | 3.0 | 2.5 | 2736 | $2,595 | $0.95 | 21d | 1 | 1.49mi |
Listing history 3 events
-
2026-03-06historical
-
2026-03-05$135,000
-
1969-11-25soldstatus $43,000
ⓘ Source: listings_history table (triggers on properties + properties_extension) + one-shot
backfill from property_details.listing_events for pre-trigger history.
Tax reassessment forecast VA · Resets to sale price
- Current annual tax
- $4,436 · $370/mo
- Projected year-2 tax
- $4,436 · $370/mo
- Expected delta
- $0/yr ($0/mo · 0.0%)
ⓘ Screening estimate from a state-policy table — verify with the county assessor before closing.
Climate risk First Street
- Flood 1/10 Low FEMA zone X (unshaded) · 0% chance over 30 yrs
- Wildfire 3/10 Moderate
- Heat 5/10 Major 7 d/yr ≥100°F today · 19 d/yr by 30 yrs out
- Wind 2/10 Low 100% chance of damaging wind over 30 yrs
- Air quality 2/10 Low 0 unhealthy d/yr today · 1 by 30 yrs out
Nearby sold comps map
Loading sold comps map…
Walkable amenities ~0.75 mi
Loading nearby amenities…
Taxation est. · year 1
- Rental income
- $33,343
- − Mortgage interest
- −$7,562
- − Property taxes
- −$4,436
- − Insurance
- −$675
- − Repairs & maintenance
- −$2,667
- − Management
- −$2,667
- − Depreciation
- −$3,927
- Taxable income
- $11,408
- Est. tax owed @ 24.0%
- −$2,738
- After-tax cash flow
- $9,997/yr
For passive investors: Depreciation is non-cash, so a rental often shows a tax loss while cash-flowing — sheltering income. Rental losses are passive: they offset passive income freely, and up to $25,000/yr can offset ordinary (W-2) income if you actively participate and your MAGI is under $100k (phasing out to $0 by $150k); unused losses carry forward. On sale, claimed depreciation is recaptured at up to 25%, and gains may owe capital-gains tax (a 1031 exchange can defer both). Figures are a year-1 estimate at your 24.0% rate — not tax advice; consult a CPA.
Schools (NCES district)
- District
- Roanoke City Public School District
- NCES district ID
- 5103300
- Math proficiency
- 40% ▼ -38.00%
- Reading proficiency
- 58% ▼ -12.00%
- Median HH income
- $38,592
- Composite
- 40.8/100
- National rank
- #3639
- State rank
- #102 of 131 in VA
Livability — Roanoke
- Score
- 73/100
- State rank
- #163
- US rank
- #5055
Category grades
Schools grade is shown separately in the Schools card above.
Census & demographics
- Census place
- Roanoke, VA
- County
- Roanoke City · 101,625 people
- City population
- 168,930
- Metro
- Roanoke, VA
- Population (ZIP)
- 15,865
- Household income
- $69,831
- Rent vs Own
- Severe rent burden
- 525.0
Population outlook (Roanoke County) Hauer SSP2
- Today (2025)
- 106,094 people
- By 2030
- 108,927 · +2.7%
- By 2040
- 114,104 · +7.5%
- By 2050
- 118,032 · +11.3%
- By 2075
- 123,363 · +16.3%
- By 2100
- 116,827 · +10.1%
Race, ethnicity, and origin ACS 2023
- Neighborhood character
- Predominantly White (83%)
- Race & ethnicity
- White 83% Two or more races 7% Black 5% Hispanic / Latino 5% Asian 2%
- Common ancestry
- Italian 5% Slovak 3% Serbian 2%
- Foreign-born
- 4% · Canada, Jamaica
- Languages at home
- 95% English-only · Spanish 2% Tagalog/Filipino 1% Other Indo-European 1%
Political lean MEDSL · Roanoke
- 2024 margin
- Strong D (+23.6) · D 61.1% · R 37.5% · Other 1.4%
- 2008→2024 swing
- +0.2pp no change · 2008: 23.4pp · 2024: 23.6pp
- All cycles
- 2024: D+23.6 2020: D+25.8 2016: D+17.6 2012: D+21.5 2008: D+23.4
Not yet ingested
- Civics
- —
Market trends
- HPI YoY
- ▼ -333.83%
- Current HPI
- 192.3108
- Rent YoY
- ▲ 6.39%
- Metro
- Roanoke, VA
- State GDP YoY
- ▲ 2.40%
- F500 in state
- 50
Industry mix (Fortune 500 HQ in VA)
| Industry | F500 HQs | Revenue |
|---|---|---|
| Aerospace / Defense | 4 | $236B |
|
||
| Technology / Defense | 3 | $32B |
|
||
| Financial Services | 2 | $176B |
|
||
| Utilities | 2 | $27B |
|
||
| Insurance | 2 | $25B |
|
||
| Technology | 2 | $15B |
|
||
Price history
+214.0% since first listed3 events — show timeline
- 2026-03-06 Listing Removed — MLSRV
- 2026-03-05 Listed $135,000 MLSRV
- 1969-11-25 Sold (Public Records) $43,000 Public Records
Property tax history
+4.0%/yrLatest (2025): $4,436 · +2.3% YoY. Source: county tax records.
Cash-flow waterfall
monthlySold comps — $/sqft
last 12 mo · ≤1 miLoading sold comps…