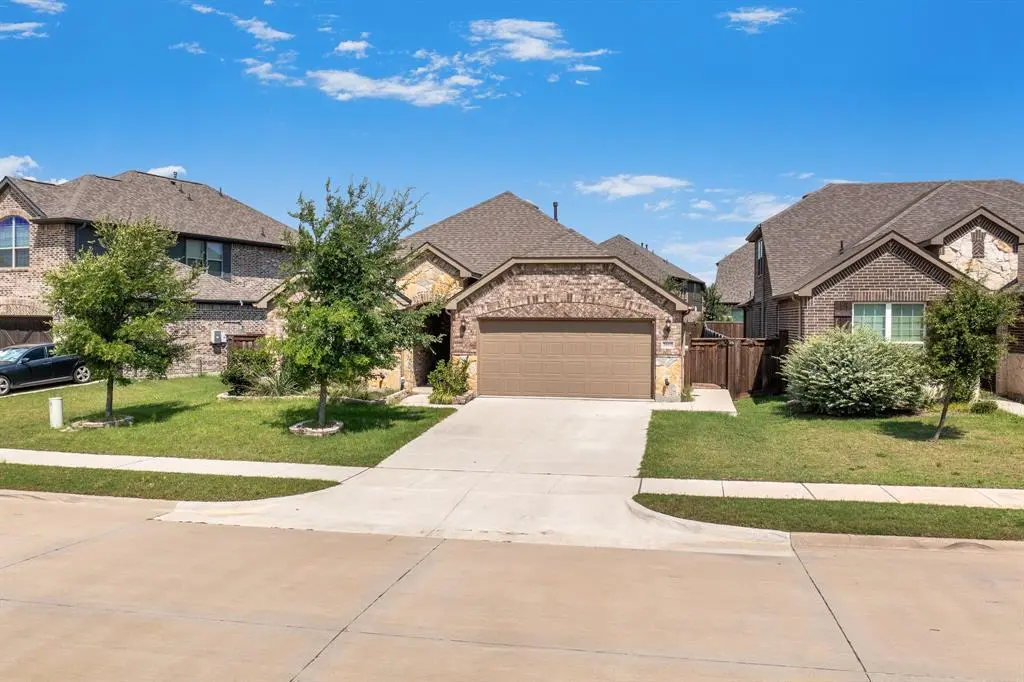
2602 Melrose Dr · Mansfield, TX
Flood risk 1/10 · Minimal
- FEMA flood zone
- X (unshaded)
- Chance of flooding over 30 yrs
- 0.0%
- Est. flood insurance / yr
- $507 – $1,088
Fire risk 2/10 · Minimal
- Est. fire insurance / yr
- $1,222 – $2,270
Heat risk 7/10 · Major
- Hot days now (above 110°F)
- 7 days/yr
- Hot days in 30 yrs
- 23 days/yr
Wind risk 6/10 · Moderate
- Chance of severe wind over 30 yrs
- 27.0%
Air-quality risk 2/10 · Minimal
- Unhealthy air days now
- 2 days/yr
- Unhealthy air days in 30 yrs
- 2 days/yr
Risk factors via First Street. Map © Google.
Why this score? — see what drove the D grade
The composite is a weighted blend of 9 inputs, each scored 0–100. Each bar is that input's sub-score; the figure is the points it added to the 100-point composite (weight × sub-score).
- ARV discount +12.3/15.0
- Appreciation +8.7/10.0
- Cash flow +5.9/30.0
- Schools +4.6/10.0
- Livability +3.6/5.0
- Rent growth +3.1/5.0
- Condition / age +2.5/5.0
- 1% rule +2.2/10.0
- DSCR +0.3/10.0
$425,000
🖨 Deal sheet (PDF) 📄 Offer letter ✓ Due diligence
Listing remarks
Welcome to 2602 Melrose Drive, a beautifully maintained one-owner Pulte home located in the highly sought-after Somerset community in Mansfield. Offering 3 bedrooms, 2 baths, and thoughtfully selected custom finishes throughout, this home blends style, comfort, and functionality. The open-concept floorplan is designed for modern living, featuring a spacious living area that flows seamlessly into the kitchen and dining spaces—perfect for entertaining or everyday life. Large eating space in kitchen, with breakfast bar and a seperate formal dining room. A versatile flex space provides the ideal setting for a home office, study nook, or hobby area, adapting to your lifestyle needs. Qualit
Key facts
- Versatile flex space
- Move in ready home
- Large eating space
Tags
Property features AI
Finance
- Other: Property type: Single Family Residence; Subdivision: Somerset Add Ph II; County: Johnson
- Financial info: Financing options: Cash, Conventional, FHA, VA, Texas Vet
- HOA & community: Mandatory homeowners association; HOA fees paid annually; includes full use of facilities, grounds maintenance, and management; HOA management: First Service; Community amenities include clubhouse, community pool, park, playground, jogging/bike path, sidewalks
Exterior
- Parking: Attached 2-car garage with garage door opener and garage facing front; 2 covered parking spaces and driveway; Garage dimensions approximately 22' wide by 19' deep
- Security: Security system
- Utilities: City water; City sewer; Not in a municipal utility district
- Home design: Single-family residence; One-story; Residential property
- Construction: Built in 2021; Brick and siding exterior; Slab foundation
- Exterior features: Covered patio; Patio; Landscaped, interior lot
Interior
- Kitchen: Granite countertops; Kitchen island; Breakfast bar and eat-in area; Pantry; Electric oven; Gas range; Microwave; Refrigerator
- Bedrooms: 3 bedrooms (all on the main level); Primary bedroom on main level with ensuite bath, jetted tub, dual sinks, and walk-in closet
- Flooring: Carpet; Ceramic tile
- Bathrooms: 2 full bathrooms
- Heating & cooling: Central heating (electric); Central air conditioning (electric); Ceiling fans
- Interior features: Open floorplan with decorative lighting and built-in features; Flat screen wiring and cable TV available; Granite counters and kitchen island; Pantry; Double vanity in bath; Walk-in closets; Eat-in kitchen; High speed internet available
- Laundry & utility: Laundry room on main level with full-size washer/dryer area and washer hookup; Utility room
Neighborhood map
What this means for you Summary
Snapshot
- This is a 3-bed/2.0-bath single-family listed at $425k.
Deal economics
- At list price, monthly cash flow is $-834 ($-10k/yr) — negative.
- To cash-flow at today's rent, offer at most $278k (34.7% below list).
- To meet the 1% rule (rent ≥ 1% of price), the offer needs to be $307k (27.7% below list).
- Recommended offer: $278k (34.7% below list) — sets the bar for cash-flow.
- Cap rate 3.9% vs local median 2.8% in Mansfield — top-decile yield for the area; either an underpriced asset or a hidden risk that comps aren't pricing in. Stress-test before assuming the spread holds.
Location & tenants
- Location reads 72/100 on livability (#243 in TX) — a middle-class / working-renter tenant base. Strengths: employment A+, housing A+, crime A; Watch: amenities F, commute F, health & safety D-.
- Mansfield ISD (suburban): math 47% / reading 53% proficiency, ranked #125 of 826 in TX (top 15%) — acceptable for families but not a draw, mixed tenant base, ~2y average lease.
- Zoned schools: Brenda Norwood El (647 students, 36% FRL); Rogene Worley Middle (math 46% / reading 51%, grade C-, #392 of 1,662 statewide, top 24%, 686 students, 48% FRL); Mansfield Lake Ridge H S (math 62% / reading 72%, grade B, #163 of 1,632 statewide, top 11%, 2,653 students, 28% FRL) — zoned schools at 37% FRL track the district average.
- Market conditions: Rents rising (+2.4%/yr); 427 active listings in the ZIP; 9 comparable units currently listed for rent nearby; rentals leasing fast (median 0d on market — plan ~1-2 weeks tenant-placement turnaround); solid renter incomes; 2,152 units permitted in Johnson County in 2024 (76 in 5+ unit buildings).
- This rent runs 36% of the median local income ($102k/yr) — at the standard rent-burdened threshold; future hikes will face affordability resistance.
Forward outlook
- In year one you build about $34k of equity ($3k loan paydown + $31k appreciation (7.3% local appreciation)).
- Johnson County population projected at +24% by 2050 — long-run rental-demand tailwind backs the buy-and-hold thesis.
- By year 2, paydown + projected appreciation supports a ~$54k cash-out refi (75% LTV) — recoverable capital for the next deal without selling this one.
Negotiation context
- Only 3 days on market — expect competitive offers; lowballing is unlikely to land.
Risks & watch-outs
- Climate carrying-cost: major wind risk, 27% chance of damaging wind over 30y; extreme-heat days projected 7→23/yr by 2055 (HVAC capex compounding) — expect insurance premiums to compound above CPI over the hold.
Questions for the listing agent
- What do current leases actually rent for vs. the listed asking? Can we see a recent rent roll and the last 12 months of T-12 income?
- What does the HOA fee cover, when was the last increase, and are there any pending special assessments or reserve-fund shortfalls?
- Is there a deadline driving the sale (1031 exchange, divorce, estate, relocation)? That informs how much negotiation room exists.
- Schools are A-rated — typically a magnet for longer-tenancy family renters. What's the average tenant stay here, and is there a school-zone premium baked into asking?
- The area grade is low — what's the realistic commute time and amenity access for the typical tenant pool here? Any planned neighborhood developments (good or bad) we should know about?
- What's the average days-on-market for RENTAL listings here right now (not sales)? A rising rental-DOM trend means longer vacancies and softer asking-rent achievability than the comps imply.
- What's the recent tenant-quality profile in this submarket — average credit score on applications, eviction rate, late-payment / NSF rate, and stable-employment percentage? A property-management company in the area should have these aggregated.
- How much new for-sale + rental construction is in the pipeline within 1–3 miles? Heavy new supply typically softens prices + rents 12–24 months out; constrained supply supports both.
Investment metrics
- 1% rule
- 0.72% ✗
- Cap rate
- 3.94%
- Cash-on-cash
- -8.41%
- DSCR
- 0.63
- GRM
- 11.5
CMA / ARV
- ARV (on-the-fly)
- $475,203
- Comps found
- 12
Show comp detail 12 sales within ~0.75 mi
| Address | Dist | Beds/Ba | Sqft | Sold | Price | $/sf | Match |
|---|---|---|---|---|---|---|---|
| 1913 Windsor | 0.29mi | 3/2.5 | 2,350 (+5%) | 2mo | $499,900 | $213 | 74 |
| 2114 Redding Dr | 0.33mi | 4/3.0 (+1) | 2,253 (+1%) | 1mo | $493,990 | $219 | 73 |
| 2608 Acton Dr | 0.38mi | 4/3.0 (+1) | 2,253 (+1%) | 1mo | $522,990 | $232 | 71 |
| 2418 Melrose Dr | 0.12mi | 4/3.0 (+1) | 2,098 (-6%) | 7mo | $445,000 | $212 | 69 |
| 2215 Birch St | 0.44mi | 4/2.5 (+1) | 2,230 (-0%) | 6mo | $524,990 | $235 | 68 |
| 2208 Birch St | 0.43mi | 4/2.5 (+1) | 2,367 (+6%) | 2mo | $599,990 | $253 | 61 |
| 2807 Durham Dr | 0.30mi | 4/3.0 (+1) | 2,090 (-6%) | 7mo | $420,000 | $201 | 61 |
| 2408 Hagen Dr | 0.21mi | 3/3.0 | 2,519 (+13%) | 7mo | $518,990 | $206 | 59 |
| 2504 Veranda Way | 0.26mi | 4/3.0 (+1) | 2,524 (+13%) | 1mo | $459,900 | $182 | 56 |
| 2508 Lakeway Ln | 0.45mi | 3/3.0 | 2,527 (+13%) | 2mo | $554,990 | $220 | 51 |
| 2515 Wallingford Dr | 0.49mi | 4/2.5 (+1) | 2,557 (+15%) | 1mo | $475,000 | $186 | 45 |
| 2611 Alden Ln | 0.51mi | 4/3.0 (+1) | 2,554 (+14%) | 4mo | $490,000 | $192 | 39 |
Match score weights: distance 35% · size 25% · config 20% · recency 20%. Top-matched comps best support the ARV.
Projected returns pro-forma
7.32% appreciation · 2.39% rent growth · sell at horizon
- IRR
- 11.8%
- Equity multiple
- 1.86×
- Total profit
- $102,086
- Equity at exit
- $303,458
- IRR
- 12.3%
- Equity multiple
- 3.79×
- Total profit
- $332,494
- Equity at exit
- $584,723
Cash invested: $119,000 (down + closing). Projections, not guarantees.
Landlord ↔ Tenant lean methodology
- Overall (STATE)
- 87 Strongly Landlord-Friendly
- State Texas
- 87 Strongly Landlord-Friendly · R+5
- County
- — inherits STATE
- City
- — inherits STATE
ZIP-level market 76084
- Home prices YoY
- 2.1%
- Rents YoY
- 2.4%
- Active inventory
- 427
- Price-to-rent
- 11.5×
Monthly cashflow live
- Estimated rent
- $3,073 high interval (Pro) →
- Mortgage (P&I)
- −$2,229
- Tax from tax record
- −$780 /mo · $9,359/yr
- Insurance
- −$177
- HOA
- −$76
- Vacancy / Maint / Mgmt
- −$645
- Net cashflow
- $-834
Break-even live
Sensitivity live
| Price | -10% $-593 | -5% $-713 | +0% $-834 | +5% $-954 | +10% $-1,074 |
|---|---|---|---|---|---|
| Rent | -10% $-1,077 | -5% $-955 | +0% $-834 | +5% $-712 | +10% $-591 |
| Rate | -1.0pp $-620 | -0.5pp $-726 | base $-834 | +0.5pp $-944 | +1.0pp $-1,056 |
UW: 25.0% down · 7.5% · 30yr · 1.5% tax · 5.0% vac · 8.0% maint · 8.0% mgmt
Financing live
Cash to close
- Down payment
- $106,250
- Closing costs
- $12,750
- Reserves months
- —
- Total cash needed
- —
Loan-product check · same deal, 3 products live
Conventional
25% down · 7.5% · 30yr
- Down + closing
- —
- Monthly P&I
- —
- Monthly cashflow
- —
- DSCR
- —
- Eligible?
- —
Personal DTI + credit; lowest rate.
DSCR
20% down · 8.5% · 30yr
- Down + closing
- —
- Monthly P&I
- —
- Monthly cashflow
- —
- DSCR
- —
- Eligible?
- —
No personal income docs; deal must DSCR.
Hard money
10% down · 12.0% · 12mo
- Down + closing
- —
- Monthly P&I
- —
- Monthly cashflow
- —
- DSCR
- —
- Eligible?
- —
Short-term bridge; refi at stabilization.
Rent comps 9 comps
| Address | Beds | Baths | Sqft | Rent | $/sqft | DOM | Units | Dist |
|---|---|---|---|---|---|---|---|---|
| 1612 Birch St Mansfield, TX | 4.0 | 3.0 | 2593 | $3,399 | $1.31 | 26d | 1 | 0.69mi |
| 2614 High Bluff Dr Mansfield, TX | 4.0 | 3.0 | 2852 | $3,600 | $1.26 | 13d | 1 | 1.00mi |
| 2309 Lannister St Mansfield, TX | 4.0 | 2.0 | 2174 | $3,300 | $1.52 | 45d | 1 | 1.21mi |
| 3361 Harmon Rd Mansfield, TX | 1.0–2.0 | 1.0–2.0 | 1056 | $2,392 | $2.27 | 0d | 19 | 1.22mi |
| 3815 Southgate Bend Blvd Midlothian, TX | 1.0–2.0 | 1.0–2.0 | 1086 | $2,545 | $2.34 | 0d | 20 | 1.35mi |
| 1824 Buckeye Ln Mansfield, TX | 4.0 | 2.5 | 2230 | $3,500 | $1.57 | 0d | 1 | 1.39mi |
| 1702 Swayback Ln Mansfield, TX | 4.0 | 3.5 | 2694 | $3,900 | $1.45 | 0d | 1 | 1.40mi |
| 1814 Buckeye Ln Mansfield, TX | 4.0 | 2.5 | 2187 | $3,500 | $1.60 | 0d | 1 | 1.41mi |
| 925 Remington Ranch Rd Mansfield, TX | 3.0 | 2.0 | 1524 | $2,350 | $1.54 | 13d | 1 | 1.47mi |
HOA detail
- Monthly dues
- $76 · $912/yr
Listing history 3 events
-
2026-06-21days on market $425,000 Active 3 DOM
-
2026-06-18remarks 693-char remark
-
2026-06-18$425,000 Active 1 DOM
ⓘ Source: listings_history table (triggers on properties + properties_extension) + one-shot
backfill from property_details.listing_events for pre-trigger history.
Tax reassessment forecast TX · Resets to sale price
- Current annual tax
- $9,359 · $780/mo
- Projected year-2 tax
- $9,359 · $780/mo
- Expected delta
- $0/yr ($0/mo · 0.0%)
ⓘ Screening estimate from a state-policy table — verify with the county assessor before closing.
Climate risk First Street
- Flood 1/10 Low FEMA zone X (unshaded) · 0% chance over 30 yrs
- Wildfire 2/10 Low
- Heat 7/10 Severe 7 d/yr ≥110°F today · 23 d/yr by 30 yrs out
- Wind 6/10 Major 27% chance of damaging wind over 30 yrs
- Air quality 2/10 Low 2 unhealthy d/yr today · 2 by 30 yrs out
Nearby sold comps map
Loading sold comps map…
Walkable amenities ~0.75 mi
Loading nearby amenities…
Taxation est. · year 1
- Rental income
- $36,881
- − Mortgage interest
- −$23,807
- − Property taxes
- −$9,359
- − Insurance
- −$2,125
- − Repairs & maintenance
- −$2,951
- − Management
- −$2,951
- − HOA
- −$912
- − Depreciation
- −$12,364
- Taxable loss
- −$17,586
- Est. tax savings @ 24.0%
- +$4,221
- After-tax cash flow
- $-5,784/yr
For passive investors: Depreciation is non-cash, so a rental often shows a tax loss while cash-flowing — sheltering income. Rental losses are passive: they offset passive income freely, and up to $25,000/yr can offset ordinary (W-2) income if you actively participate and your MAGI is under $100k (phasing out to $0 by $150k); unused losses carry forward. On sale, claimed depreciation is recaptured at up to 25%, and gains may owe capital-gains tax (a 1031 exchange can defer both). Figures are a year-1 estimate at your 24.0% rate — not tax advice; consult a CPA.
Schools (NCES district)
- District
- Mansfield ISD
- NCES district ID
- 4828920
- Math proficiency
- 47% ▼ -17.00%
- Reading proficiency
- 53% ▼ -6.00%
- Median HH income
- $81,934
- Composite
- 45.82/100
- National rank
- #2558
- State rank
- #125 of 826 in TX
Livability — Mansfield
- Score
- 72/100
- State rank
- #243
- US rank
- #5833
Category grades
Schools grade is shown separately in the Schools card above.
Census & demographics
- Census place
- Mansfield, TX
- County
- Johnson County · 147,987 people
- City population
- 82,625
- Metro
- Dallas-Fort Worth-Arlington, TX
- Population (ZIP)
- 14,097
- Household income
- $102,115
- Rent vs Own
- Severe rent burden
- 70.0
Population outlook (Johnson County) Hauer SSP2
- Today (2025)
- 179,678 people
- By 2030
- 189,208 · +5.3%
- By 2040
- 207,261 · +15.4%
- By 2050
- 223,064 · +24.1%
- By 2075
- 259,979 · +44.7%
- By 2100
- 275,395 · +53.3%
Race, ethnicity, and origin ACS 2023
- Neighborhood character
- Diverse neighborhood (Simpson 0.63)
- Race & ethnicity
- White 52% Hispanic / Latino 30% Two or more races 24% Black 11% Asian 1%
- Hispanic origin (detail)
- Mexican 25% Puerto Rican 1%
- Common ancestry
- Romanian 2% Lithuanian 1% Slovak 1%
- Foreign-born
- 8% · Canada
- Languages at home
- 78% English-only · Spanish 18% Arabic 1% French/Haitian/Cajun 1%
Political lean MEDSL · Johnson
- 2024 margin
- Solid R (+51.4) · D 23.9% · R 75.3%
- 2008→2024 swing
- -3.9pp toward R · 2008: -47.5pp · 2024: -51.4pp
- All cycles
- 2024: R+51.4 2020: R+53.0 2016: R+58.3 2012: R+55.6 2008: R+47.5
Not yet ingested
- Civics
- —
Market trends
- HPI YoY
- ▲ 7.32%
- Current HPI
- 355.74
- Rent YoY
- ▲ 2.39%
- Metro
- Dallas-Fort Worth-Arlington, TX
- State GDP YoY
- ▲ 3.95%
- F500 in state
- 110
Industry mix (Fortune 500 HQ in TX)
| Industry | F500 HQs | Revenue |
|---|---|---|
| Energy | 16 | $1,198B |
|
||
| Technology | 5 | $198B |
|
||
| Engineering / Construction | 4 | $72B |
|
||
| Energy Services | 3 | $60B |
|
||
| Utilities | 3 | $41B |
|
||
| Healthcare | 2 | $330B |
|
||
Price history
1 event — show timeline
- 2026-06-18 Listed $425,000 NTREIS
Property tax history
+47.0%/yrLatest (2025): $9,359 · -2.2% YoY. Source: county tax records.
Cash-flow waterfall
monthlySold comps — $/sqft
last 12 mo · ≤1 miLoading sold comps…