 Duplex
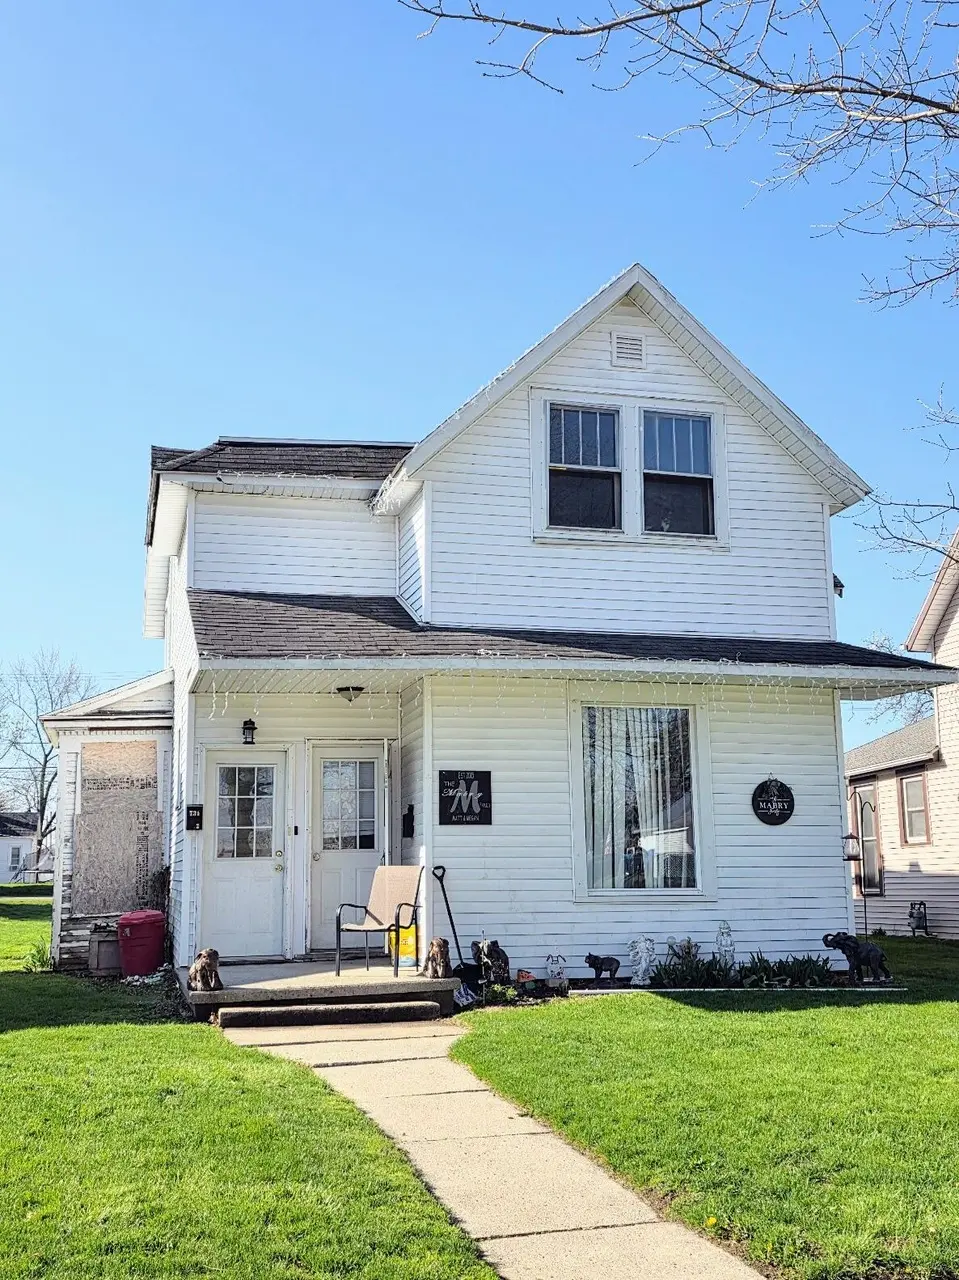
731 Columbia St · St. Marys, OH
Flood risk 1/10 · Minimal
- FEMA flood zone
- X
- Chance of flooding over 30 yrs
- 0.0%
- Est. flood insurance / yr
- $473 – $860
Fire risk 1/10 · Minimal
- Est. fire insurance / yr
- $713 – $1,323
Heat risk 3/10 · Minor
- Hot days now (above 100°F)
- 7 days/yr
- Hot days in 30 yrs
- 18 days/yr
Wind risk 2/10 · Minimal
- Chance of severe wind over 30 yrs
- —
Air-quality risk 2/10 · Minimal
- Unhealthy air days now
- 1 days/yr
- Unhealthy air days in 30 yrs
- 2 days/yr
Risk factors via First Street. Map © Google.
Why this score? — see what drove the B grade
The composite is a weighted blend of 9 inputs, each scored 0–100. Each bar is that input's sub-score; the figure is the points it added to the 100-point composite (weight × sub-score).
- Cash flow +30.0/30.0
- 1% rule +10.0/10.0
- DSCR +10.0/10.0
- ARV discount +7.5/15.0
- Schools +5.5/10.0
- Rent growth +2.5/5.0
- Livability +2.5/5.0
- Condition / age +2.5/5.0
- Appreciation +0.0/10.0
$60,000
🖨 Deal sheet 📄 Offer letter ✓ Due diligence
Multi-family units
County records classify this as Multi-Family (2-4 Unit). Listing-text estimate: 2 units. confirmed
Listing remarks
Investment Opportunity - Duplex with Long-Term Tenants Great opportunity to add to your investment portfolio! This duplex features a 2-bedroom lower unit and a 1-bedroom upper unit, both currently occupied by long-term tenants * * , offering immediate rental income potential. The property could benefit from some updates and TLC, making it an excellent value-add opportunity for investors looking to increase equity and maximize returns. With rental history and a functional layout, this property is ideal for those seeking steady income with upside potential. Whether you're expanding your portfolio or purchasing your first investment property, this duplex offers potential and dependable occ
Key facts
- Duplex
- 7,840 sq ft lot
- Garage
Tags
Property features AI
Finance
- Financial info: Two-unit property
Exterior
- Parking: Has garage
- Utilities: Public sewer; Natural gas connected; Supplied water
- Home design: Duplex (multi-family); Built in 1900; Located in the Armstrongs East Add subdivision
- Construction: Asbestos and other construction materials noted
- Exterior features: Residential lot; Lot dimensions approximately 48 x 168; Lot area about 0.18 acres; Supplied water; Public sewer; Natural gas connected
Interior
- Flooring: Carpet; Laminate
- Bathrooms: 2 full bathrooms
- Heating & cooling: Forced air heating (natural gas); Window cooling units
- Interior features: Carpet and laminate flooring; Partial crawl space basement
Neighborhood map
What this means for you Summary
Snapshot
- This is a 2 × 3-bed/2.0-bath units multifamily listed at $60k.
Deal economics
- At list price, monthly cash flow is $927 ($11k/yr) — positive. Per door: $464/mo.
- The deal already cash-flows at list — no discount required.
- Meets the 1% rule at list price ($2k rent vs $60k).
- Recommended offer: $58k (3.0% below list) — sets the bar for market timing.
- Cap rate 24.8% vs local median 3.0% in St. Marys — top-decile yield for the area; either an underpriced asset or a hidden risk that comps aren't pricing in. Stress-test before assuming the spread holds.
Location & tenants
- Location reads: area grade B — affects rentability + tenant quality, not the cash-flow math above.
- St Marys City (town): math 64% / reading 65% proficiency, ranked #221 of 656 in OH (top 34%) — acceptable for families but not a draw, mixed tenant base, ~2y average lease.
- Market conditions: 67 active listings in the ZIP; solid renter incomes; 121 units permitted in Auglaize County in 2024 (0 in 5+ unit buildings).
Forward outlook
- Local home prices are declining (-3.0%/yr); year-one equity from $415 of loan paydown is wiped out by about $2k of value loss. Plan a longer hold.
- Auglaize County population projected at -12% by 2050 — secular population decline; favor cash flow + early exit over multi-decade hold.
- At projected returns (-3.0% appreciation + 3.0% rent growth), your $17k cash investment doubles in ~2 years — after that, you're playing with house money.
Negotiation context
- It's been on market 39 days — a 3% lower offer ($58k) is reasonable based on typical stale-listing flexibility.
- 3 sale attempts since 20y ago; this cycle's ask has dropped $40k (40%) from the opening price — seller is motivated, your offer sets the floor, not the list.
Risks & watch-outs
- Watch-outs: built in 1900 — expect roof / HVAC / electrical / plumbing capex.
Questions for the listing agent
- It's been on market 39 days. Have you received any prior offers? Is the seller open to a 3% concession, seller financing, or rate buy-down credit?
- Can we see the unit-by-unit rent roll, current vacancy, and any below-market leases? What's the average tenancy length?
- What capital expenditures (roof, boiler, parking lot, exteriors) have been made in the last 5 years, and what's planned in the next 2?
- Built in 1900 — when were the roof, HVAC, electrical panel, plumbing, and water heater last replaced?
- Is there a deadline driving the sale (1031 exchange, divorce, estate, relocation)? That informs how much negotiation room exists.
- What's the average days-on-market for RENTAL listings here right now (not sales)? A rising rental-DOM trend means longer vacancies and softer asking-rent achievability than the comps imply.
- What's the recent tenant-quality profile in this submarket — average credit score on applications, eviction rate, late-payment / NSF rate, and stable-employment percentage? A property-management company in the area should have these aggregated.
- How much new apartment / multifamily construction is in the pipeline within 1–3 miles? Heavy new supply (>2% of stock underway) typically softens rents 12–24 months out; light construction supports rent growth.
Investment metrics
- 1% rule
- 2.88% ✓
- Cap rate
- 24.84%
- Cash-on-cash
- 66.24%
- DSCR
- 3.95
- GRM
- 2.9
CMA / ARV
- ARV (on-the-fly)
- $237,832
- Comps found
- 2
Show comp detail 2 sales within ~0.75 mi
| Address | Dist | Beds/Ba | Sqft | Sold | Price | $/sf | Match |
|---|---|---|---|---|---|---|---|
| 205 207 N Pine St | 0.21mi | 4/2.5 (+1) | 1,904 (-1%) | 16mo | $190,000 | $100 | 68 |
| 321-323 N Front St | 0.62mi | 4/2.0 (+1) | 1,736 (-10%) | 12mo | $215,000 | $124 | 40 |
Match score weights: distance 35% · size 25% · config 20% · recency 20%. Top-matched comps best support the ARV.
Projected returns pro-forma
-3.0% appreciation · 3.0% rent growth · sell at horizon
- IRR
- 65.5%
- Equity multiple
- 3.94×
- Total profit
- $49,379
- Equity at exit
- $8,946
- IRR
- 69.8%
- Equity multiple
- 8.10×
- Total profit
- $119,215
- Equity at exit
- $5,188
Cash invested: $16,800 (down + closing). Projections, not guarantees.
Landlord ↔ Tenant lean methodology
- Overall (STATE)
- 73 Landlord-Friendly
- State Ohio
- 73 Landlord-Friendly · R+6
- County
- — inherits STATE
- City
- — inherits STATE
ZIP-level market 45885
- Active inventory
- 67
- Price-to-rent
- 5.8×
Monthly cashflow live
- Estimated rent
- $1,730 medium interval (Pro) →
- Mortgage (P&I)
- −$315
- Tax from tax record
- −$100 /mo · $1,197/yr
- Insurance
- −$25
- HOA
- −$0
- Vacancy / Maint / Mgmt
- −$363
- Net cashflow
- $927
Break-even live
2-unit breakdown (identical units grouped — click to expand)
| Units | Beds | Baths | Est. rent |
|---|---|---|---|
| 2× units | 3 | 2 | $1,730 |
| #1 | 3 | 2 | $865 |
| #2 | 3 | 2 | $865 |
| Total (2 units) | $1,730 | ||
UW: 25.0% down · 7.5% · 30yr · 1.5% tax · 5.0% vac · 8.0% maint · 8.0% mgmt
Financing live
Cash to close
- Down payment
- $15,000
- Closing costs
- $1,800
- Reserves months
- —
- Total cash needed
- —
Loan-product check · same deal, 3 products live
Conventional
25% down · 7.5% · 30yr
- Down + closing
- —
- Monthly P&I
- —
- Monthly cashflow
- —
- DSCR
- —
- Eligible?
- —
Personal DTI + credit; lowest rate.
DSCR
20% down · 8.5% · 30yr
- Down + closing
- —
- Monthly P&I
- —
- Monthly cashflow
- —
- DSCR
- —
- Eligible?
- —
No personal income docs; deal must DSCR.
Hard money
10% down · 12.0% · 12mo
- Down + closing
- —
- Monthly P&I
- —
- Monthly cashflow
- —
- DSCR
- —
- Eligible?
- —
Short-term bridge; refi at stabilization.
Listing history 9 events
-
2026-05-15status Pending
-
2026-05-08price $60,000
-
2026-04-28price $70,000
-
2026-04-22price $80,000
-
2026-04-13status Active
-
2026-04-11historical Contingency - Finance and Inspections
-
2026-04-06$99,900 Active
-
2007-03-30historical
-
2006-08-07$54,900
ⓘ Source: listings_history table (triggers on properties + properties_extension) + one-shot
backfill from property_details.listing_events for pre-trigger history.
Tax reassessment forecast OH · Partial reset (capped growth)
- Current annual tax
- $1,197 · $100/mo
- Projected year-2 tax
- $1,197 · $100/mo
- Expected delta
- $0/yr ($0/mo · 0.0%)
ⓘ Screening estimate from a state-policy table — verify with the county assessor before closing.
Climate risk First Street
- Flood 1/10 Low FEMA zone X · 0% chance over 30 yrs
- Wildfire 1/10 Low
- Heat 3/10 Moderate 7 d/yr ≥100°F today · 18 d/yr by 30 yrs out
- Wind 2/10 Low
- Air quality 2/10 Low 1 unhealthy d/yr today · 2 by 30 yrs out
Nearby sold comps map
Loading sold comps map…
Walkable amenities ~0.75 mi
Loading nearby amenities…
Taxation est. · year 1
- Rental income
- $20,760
- − Mortgage interest
- −$3,361
- − Property taxes
- −$1,197
- − Insurance
- −$300
- − Repairs & maintenance
- −$1,661
- − Management
- −$1,661
- − Depreciation
- −$1,745
- Taxable income
- $10,835
- Est. tax owed @ 24.0%
- −$2,600
- After-tax cash flow
- $8,527/yr
For passive investors: Depreciation is non-cash, so a rental often shows a tax loss while cash-flowing — sheltering income. Rental losses are passive: they offset passive income freely, and up to $25,000/yr can offset ordinary (W-2) income if you actively participate and your MAGI is under $100k (phasing out to $0 by $150k); unused losses carry forward. On sale, claimed depreciation is recaptured at up to 25%, and gains may owe capital-gains tax (a 1031 exchange can defer both). Figures are a year-1 estimate at your 24.0% rate — not tax advice; consult a CPA.
Schools (NCES district)
- District
- St Marys City
- NCES district ID
- 3904472
- Math proficiency
- 64% ▼ -10.00%
- Reading proficiency
- 65% ▼ -4.00%
- Median HH income
- $49,672
- Composite
- 54.78/100
- National rank
- #1317
- State rank
- #221 of 656 in OH
Livability — St. Marys
No livability data for this city. (Only ~50 U.S. cities are tracked.)
Census & demographics
- Census place
- St. Marys, OH
- County
- Auglaize · 44,666 people
- Population (ZIP)
- 12,744
- Household income
- $75,054
- Rent vs Own
- Severe rent burden
- 3.6
Population outlook (Auglaize County) Hauer SSP2
- Today (2025)
- 45,247 people
- By 2030
- 44,448 · -1.8%
- By 2040
- 42,355 · -6.4%
- By 2050
- 39,722 · -12.2%
- By 2075
- 33,967 · -24.9%
- By 2100
- 26,839 · -40.7%
Race, ethnicity, and origin ACS 2023
- Neighborhood character
- Predominantly White (94%)
- Race & ethnicity
- White 94% Two or more races 4%
- Common ancestry
- Lithuanian 3% Iranian 2% Slovak 1%
- Foreign-born
- 1%
- Languages at home
- 98% English-only · German/W. Germanic 1% Other Asian/Pacific 1%
Political lean MEDSL · Auglaize
- 2024 margin
- Solid R (+64.6) · D 17.3% · R 81.9%
- 2008→2024 swing
- -23.4pp toward R · 2008: -41.2pp · 2024: -64.6pp
- All cycles
- 2024: R+64.6 2020: R+62.6 2016: R+62.6 2012: R+48.9 2008: R+41.2
Not yet ingested
- Civics
- —
Market trends
- HPI YoY
- ▼ -207.83%
- Current HPI
- 197.352
- Rent YoY
- —
- Metro
- —
- State GDP YoY
- ▲ 1.98%
- F500 in state
- 48
Industry mix (Fortune 500 HQ in OH)
| Industry | F500 HQs | Revenue |
|---|---|---|
| Insurance | 3 | $145B |
|
||
| Industrial Machinery | 3 | $49B |
|
||
| Financial Services | 3 | $24B |
|
||
| Consumer Goods | 2 | $93B |
|
||
| Aerospace / Defense | 2 | $47B |
|
||
| Utilities | 2 | $33B |
|
||
Price history
+9.3% since first listed9 events — show timeline
- 2026-05-15 Pending — WRIST
- 2026-05-08 Price Changed $60,000 WRIST
- 2026-04-28 Price Changed $70,000 WRIST
- 2026-04-22 Price Changed $80,000 WRIST
- 2026-04-13 Relisted — WRIST
- 2026-04-11 Contingent — WRIST
- 2026-04-06 Listed $99,900 WRIST
- 2007-03-30 Listing Removed — WRIST
- 2006-08-07 Listed $54,900 WRIST
Property tax history
+3.0%/yrLatest (2025): $1,197 · -1.4% YoY. Source: county tax records.
Cash-flow waterfall
monthlySold comps — $/sqft
last 12 mo · ≤1 miLoading sold comps…