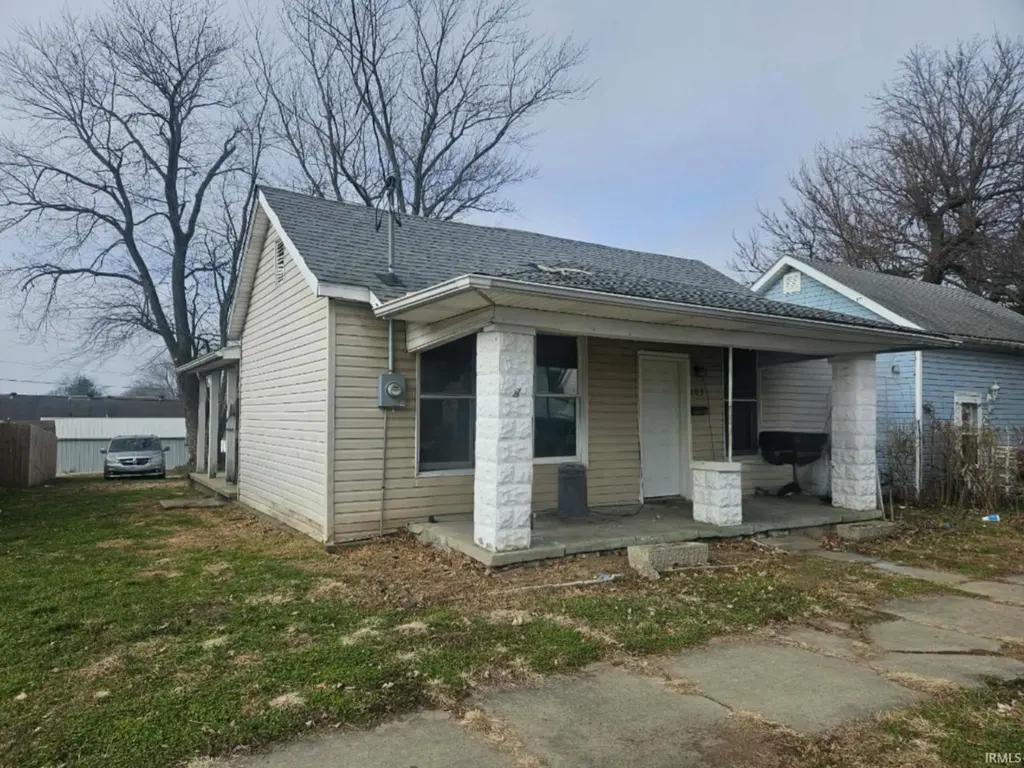
103 NE 15th St · Washington, IN
Flood risk 1/10 · Minimal
- FEMA flood zone
- —
- Chance of flooding over 30 yrs
- 0.0%
- Est. flood insurance / yr
- —
Fire risk 3/10 · Minor
- Est. fire insurance / yr
- $717 – $1,331
Heat risk 5/10 · Moderate
- Hot days now (above 106°F)
- 7 days/yr
- Hot days in 30 yrs
- 19 days/yr
Wind risk 2/10 · Minimal
- Chance of severe wind over 30 yrs
- 2.0%
Air-quality risk 4/10 · Minor
- Unhealthy air days now
- 3 days/yr
- Unhealthy air days in 30 yrs
- 5 days/yr
Risk factors via First Street. Map © Google.
Why this score? — see what drove the B- grade
The composite is a weighted blend of 9 inputs, each scored 0–100. Each bar is that input's sub-score; the figure is the points it added to the 100-point composite (weight × sub-score).
- Cash flow +30.0/30.0
- DSCR +10.0/10.0
- 1% rule +8.9/10.0
- ARV discount +7.8/15.0
- Livability +3.6/5.0
- Schools +3.2/10.0
- Rent growth +2.5/5.0
- Condition / age +2.5/5.0
- Appreciation +0.0/10.0
$89,900
🖨 Deal sheet (PDF) 📄 Offer letter ✓ Due diligence
Listing remarks MLS
Cozy 1 bedroom bungalow with front & side porches, eat in kitchen, newer furnace & central air, off street parking and close to the hospital!
Key facts
- Newer furnace
- Off street parking
- Eat in kitchen
Tags
Neighborhood map
What this means for you Summary
Snapshot
- This is a 2-bed/1.0-bath single-family listed at $90k.
Deal economics
- At list price, monthly cash flow is $384 ($5k/yr) — positive.
- The deal already cash-flows at list — no discount required.
- Meets the 1% rule at list price ($1k rent vs $90k).
- Recommended offer: $79k (12.0% below list) — sets the bar for market timing.
- Cap rate 11.4% vs local median 4.9% in Washington — top-decile yield for the area; either an underpriced asset or a hidden risk that comps aren't pricing in. Stress-test before assuming the spread holds.
Location & tenants
- Location reads 72/100 on livability (#110 in IN) — a middle-class / working-renter tenant base. Strengths: cost of living A+, housing A+, health & safety A+; Watch: amenities F, commute F, employment F.
- Washington Community Schools (town): math 36% / reading 38% proficiency, ranked #174 of 301 in IN (top 58%) — families likely to look elsewhere, expect single-tenant / working-renter base with shorter leases.
- Market conditions: 115 active listings in the ZIP; 1 comparable units currently listed for rent nearby; 71 units permitted in Daviess County in 2024 (0 in 5+ unit buildings).
Forward outlook
- Local home prices are declining (-3.0%/yr); year-one equity from $622 of loan paydown is wiped out by about $3k of value loss. Plan a longer hold.
- Daviess County population projected at +6% by 2050 — modest demand growth; plan on rents tracking national, not racing it.
- At projected returns (-3.0% appreciation + 3.0% rent growth), your $25k cash investment doubles in ~7 years — after that, you're playing with house money.
Negotiation context
- It's been on market 182 days — a 12% lower offer ($79k) is reasonable based on typical stale-listing flexibility.
Risks & watch-outs
- Watch-outs: built in 1900 — expect roof / HVAC / electrical / plumbing capex.
- Climate carrying-cost: extreme-heat days projected 7→19/yr by 2055 (HVAC capex compounding) — expect insurance premiums to compound above CPI over the hold.
Questions for the listing agent
- It's been on market 182 days. Have you received any prior offers? Is the seller open to a 12% concession, seller financing, or rate buy-down credit?
- Built in 1900 — when were the roof, HVAC, electrical panel, plumbing, and water heater last replaced?
- Why hasn't it sold? Are there any deal-killer items the seller is aware of (foundation, flood, title, zoning, code violations)?
- Is there a deadline driving the sale (1031 exchange, divorce, estate, relocation)? That informs how much negotiation room exists.
- What's the average days-on-market for RENTAL listings here right now (not sales)? A rising rental-DOM trend means longer vacancies and softer asking-rent achievability than the comps imply.
- What's the recent tenant-quality profile in this submarket — average credit score on applications, eviction rate, late-payment / NSF rate, and stable-employment percentage? A property-management company in the area should have these aggregated.
- How much new for-sale + rental construction is in the pipeline within 1–3 miles? Heavy new supply typically softens prices + rents 12–24 months out; constrained supply supports both.
Investment metrics
- 1% rule
- 1.39% ✓
- Cap rate
- 11.42%
- Cash-on-cash
- 18.30%
- DSCR
- 1.81
- GRM
- 6.0
CMA / ARV
- ARV (median comp)
- $90,570
- List price
- $89,900
- Delta
- -0.74%
- Verdict
- FAIR
- Comps
- 20 within 1.0 mi
Show comp detail 8 sales within ~0.75 mi
| Address | Dist | Beds/Ba | Sqft | Sold | Price | $/sf | Match |
|---|---|---|---|---|---|---|---|
| 1329 E Van Trees St | 0.08mi | 2/1.0 | 792 (+5%) | 9mo | $129,000 | $163 | 80 |
| 12 NE 10th St | 0.36mi | 2/1.0 | 754 (+0%) | 13mo | $45,000 | $60 | 72 |
| 1212 E Vantrees St | 0.21mi | 2/1.0 | 816 (+8%) | 15mo | $95,000 | $116 | 64 |
| 1005 E National Hwy | 0.54mi | 2/1.0 | 728 (-3%) | 8mo | $57,500 | $79 | 62 |
| 804 Axtell Ave | 0.44mi | 2/1.0 | 729 (-3%) | 16mo | $84,000 | $115 | 61 |
| 1000 Axtell Ave | 0.39mi | 2/1.0 | 816 (+8%) | 14mo | $145,900 | $179 | 56 |
| 1003 E National Hwy | 0.55mi | 3/2.0 (+1) | 685 (-9%) | 1mo | $144,000 | $210 | 50 |
| 601 N State Road 57 | 0.72mi | 2/1.0 | 864 (+15%) | 2mo | $70,000 | $81 | 40 |
Match score weights: distance 35% · size 25% · config 20% · recency 20%. Top-matched comps best support the ARV.
Projected returns pro-forma
-3.0% appreciation · 3.0% rent growth · sell at horizon
- IRR
- 10.0%
- Equity multiple
- 1.39×
- Total profit
- $9,893
- Equity at exit
- $13,404
- IRR
- 19.1%
- Equity multiple
- 2.59×
- Total profit
- $40,134
- Equity at exit
- $7,773
Cash invested: $25,172 (down + closing). Projections, not guarantees.
Landlord ↔ Tenant lean methodology
- Overall (STATE)
- 90 Strongly Landlord-Friendly
- State Indiana
- 90 Strongly Landlord-Friendly · R+11
- County
- — inherits STATE
- City
- — inherits STATE
ZIP-level market 47501
- Home prices YoY
- -23.2%
- Active inventory
- 115
- Price-to-rent
- 6.0×
Monthly cashflow live
- Estimated rent
- $1,250 medium interval (Pro) →
- Mortgage (P&I)
- −$471
- Tax from tax record
- −$95 /mo · $1,136/yr
- Insurance
- −$37
- HOA
- −$0
- Vacancy / Maint / Mgmt
- −$262
- Net cashflow
- $384
Break-even live
Sensitivity live
| Price | -10% $435 | -5% $409 | +0% $384 | +5% $358 | +10% $333 |
|---|---|---|---|---|---|
| Rent | -10% $285 | -5% $335 | +0% $384 | +5% $433 | +10% $483 |
| Rate | -1.0pp $429 | -0.5pp $407 | base $384 | +0.5pp $361 | +1.0pp $337 |
UW: 25.0% down · 7.5% · 30yr · 1.5% tax · 5.0% vac · 8.0% maint · 8.0% mgmt
Financing live
Cash to close
- Down payment
- $22,475
- Closing costs
- $2,697
- Reserves months
- —
- Total cash needed
- —
Loan-product check · same deal, 3 products live
Conventional
25% down · 7.5% · 30yr
- Down + closing
- —
- Monthly P&I
- —
- Monthly cashflow
- —
- DSCR
- —
- Eligible?
- —
Personal DTI + credit; lowest rate.
DSCR
20% down · 8.5% · 30yr
- Down + closing
- —
- Monthly P&I
- —
- Monthly cashflow
- —
- DSCR
- —
- Eligible?
- —
No personal income docs; deal must DSCR.
Hard money
10% down · 12.0% · 12mo
- Down + closing
- —
- Monthly P&I
- —
- Monthly cashflow
- —
- DSCR
- —
- Eligible?
- —
Short-term bridge; refi at stabilization.
Rent comps 1 comps
| Address | Beds | Baths | Sqft | Rent | $/sqft | DOM | Units | Dist |
|---|---|---|---|---|---|---|---|---|
| 2005 E National Hwy Washington, IN | 1.0–2.0 | 1.0–1.5 | 960 | $1,250 | $1.30 | 44d | 1 | 0.50mi |
Listing history 6 events
-
2026-06-04days on market $89,900 Active 182 DOM
-
2026-06-02days on market $89,900 Active 181 DOM
-
2026-06-01days on market $89,900 Active 180 DOM
-
2026-05-31days on market $89,900 Active 179 DOM
-
2026-05-31days on market $89,900 Active 178 DOM
-
2025-12-03$89,900 Active 153-char remark
Show marketing remark (153 chars)
Cozy 1 bedroom bungalow with front & side porches, eat in kitchen, newer furnace & central air, off street parking and close to the hospital!
ⓘ Source: listings_history table (triggers on properties + properties_extension) + one-shot
backfill from property_details.listing_events for pre-trigger history.
Tax reassessment forecast IN · Partial reset (capped growth)
- Current annual tax
- $1,136 · $95/mo
- Projected year-2 tax
- $1,136 · $95/mo
- Expected delta
- $0/yr ($0/mo · 0.0%)
ⓘ Screening estimate from a state-policy table — verify with the county assessor before closing.
Climate risk First Street
- Flood 1/10 Low 0% chance over 30 yrs
- Wildfire 3/10 Moderate
- Heat 5/10 Major 7 d/yr ≥106°F today · 19 d/yr by 30 yrs out
- Wind 2/10 Low 2% chance of damaging wind over 30 yrs
- Air quality 4/10 Moderate 3 unhealthy d/yr today · 5 by 30 yrs out
Nearby sold comps map
Loading sold comps map…
Walkable amenities ~0.75 mi
Loading nearby amenities…
Taxation est. · year 1
- Rental income
- $15,000
- − Mortgage interest
- −$5,036
- − Property taxes
- −$1,136
- − Insurance
- −$450
- − Repairs & maintenance
- −$1,200
- − Management
- −$1,200
- − Depreciation
- −$2,615
- Taxable income
- $3,363
- Est. tax owed @ 24.0%
- −$807
- After-tax cash flow
- $3,800/yr
For passive investors: Depreciation is non-cash, so a rental often shows a tax loss while cash-flowing — sheltering income. Rental losses are passive: they offset passive income freely, and up to $25,000/yr can offset ordinary (W-2) income if you actively participate and your MAGI is under $100k (phasing out to $0 by $150k); unused losses carry forward. On sale, claimed depreciation is recaptured at up to 25%, and gains may owe capital-gains tax (a 1031 exchange can defer both). Figures are a year-1 estimate at your 24.0% rate — not tax advice; consult a CPA.
Schools (NCES district)
- District
- Washington Community Schools
- NCES district ID
- 1812450
- Math proficiency
- 36% ▼ -1.00%
- Reading proficiency
- 38% ▼ -3.00%
- Median HH income
- $45,422
- Composite
- 31.57/100
- National rank
- #5952
- State rank
- #174 of 301 in IN
Livability — Washington
- Score
- 72/100
- State rank
- #110
- US rank
- #5706
Category grades
Schools grade is shown separately in the Schools card above.
Census & demographics
- Census place
- Washington, IN
- City population
- 18,335
- Population (ZIP)
- 18,335
Population outlook (Daviess County) Hauer SSP2
- Today (2025)
- 33,940 people
- By 2030
- 34,457 · +1.5%
- By 2040
- 35,412 · +4.3%
- By 2050
- 35,803 · +5.5%
- By 2075
- 35,173 · +3.6%
- By 2100
- 29,799 · -12.2%
Race, ethnicity, and origin ACS 2023
- Neighborhood character
- Predominantly White (81%)
- Race & ethnicity
- White 81% Hispanic / Latino 11% Two or more races 8% Black 3%
- Hispanic origin (detail)
- Mexican 9%
- Common ancestry
- Hispanic 4% Lithuanian 2% Slovak 1%
- Foreign-born
- 7% · Canada
- Languages at home
- 89% English-only · Spanish 5% French/Haitian/Cajun 3% German/W. Germanic 1%
Political lean MEDSL · Daviess
- 2024 margin
- Solid R (+64.3) · D 17.1% · R 81.5% · Other 1.4%
- 2008→2024 swing
- -29.1pp toward R · 2008: -35.2pp · 2024: -64.3pp
- All cycles
- 2024: R+64.3 2020: R+62.0 2016: R+62.8 2012: R+50.8 2008: R+35.2
Not yet ingested
- Civics
- —
Market trends
- HPI YoY
- ▼ -64.30%
- Current HPI
- 213.3049
- Rent YoY
- —
- Metro
- —
- State GDP YoY
- ▲ 2.90%
- F500 in state
- 18
Industry mix (Fortune 500 HQ in IN)
| Industry | F500 HQs | Revenue |
|---|---|---|
| Industrial Machinery | 2 | $37B |
|
||
| Healthcare | 1 | $177B |
|
||
| Pharmaceuticals | 1 | $45B |
|
||
| Metals / Steel | 1 | $18B |
|
||
| Agriculture | 1 | $17B |
|
||
| Packaging | 1 | $12B |
|
||
Price history
1 event — show timeline
- 2025-12-03 Listed $89,900 IRMLS
Property tax history
+21.7%/yrLatest (2024): $1,136 · +44.9% YoY. Source: county tax records.
Cash-flow waterfall
monthlySold comps — $/sqft
last 12 mo · ≤1 miLoading sold comps…