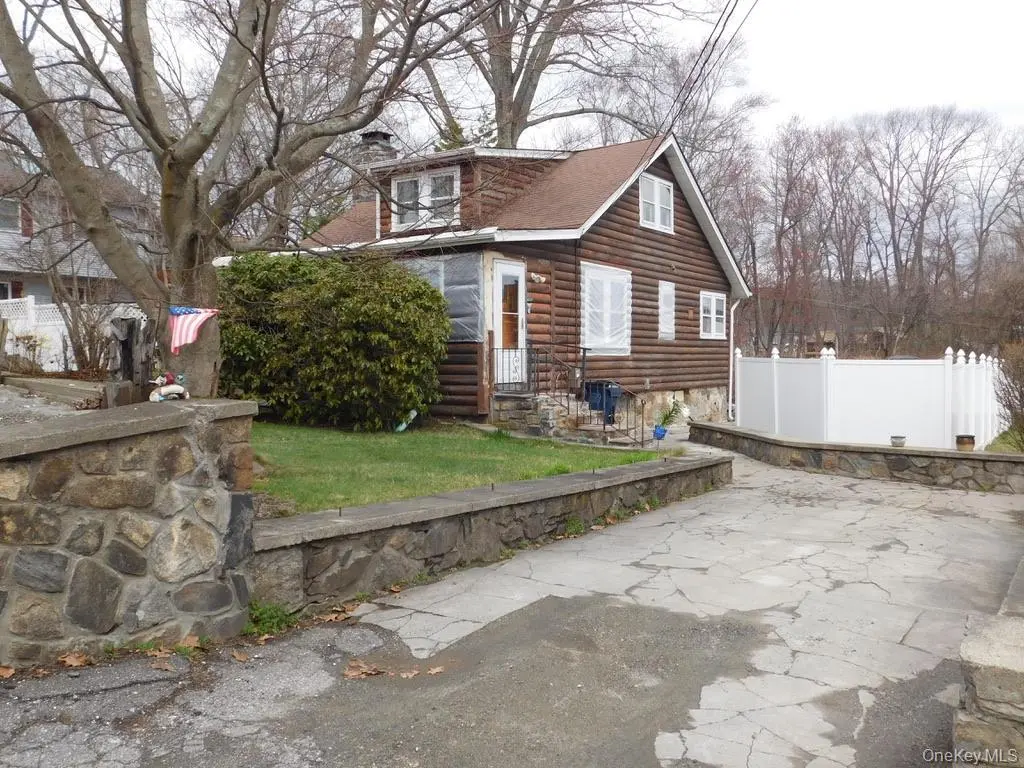
219 Willow Dr · Mahopac, NY
Flood risk 1/10 · Minimal
- FEMA flood zone
- X (unshaded)
- Chance of flooding over 30 yrs
- 0.0%
- Est. flood insurance / yr
- $473 – $860
Fire risk 3/10 · Minor
- Est. fire insurance / yr
- $691 – $1,283
Heat risk 4/10 · Minor
- Hot days now (above 97°F)
- 7 days/yr
- Hot days in 30 yrs
- 16 days/yr
Wind risk 4/10 · Minor
- Chance of severe wind over 30 yrs
- 17.0%
Air-quality risk 3/10 · Minor
- Unhealthy air days now
- 2 days/yr
- Unhealthy air days in 30 yrs
- 4 days/yr
Risk factors via First Street. Map © Google.
Why this score? — see what drove the C+ grade
The composite is a weighted blend of 9 inputs, each scored 0–100. Each bar is that input's sub-score; the figure is the points it added to the 100-point composite (weight × sub-score).
- Cash flow +19.9/30.0
- ARV discount +15.0/15.0
- 1% rule +6.8/10.0
- DSCR +6.3/10.0
- Schools +5.9/10.0
- Livability +3.4/5.0
- Rent growth +2.5/5.0
- Condition / age +2.5/5.0
- Appreciation +0.0/10.0
$299,000
🖨 Deal sheet 📄 Offer letter ✓ Due diligence
Listing remarks
Opportunity awaits! Solid home with great bones ready for your vision and updates. Features include a beautiful fireplace and hardwood floors with great potential to shine again, along with a clean, dry basement. Interior requires renovation throughout, offering the perfect chance to customize to your taste. Enjoy Lake Secor lake rights, with access to beach, fishing, picnicking, canoeing, and row boating—adding great recreational value to the property. Property is being sold as-is. Ideal for investors, contractors, or buyers looking to build equity. Taxes do not reflect STAR exemption of $882.00
Key facts
- 6,000 sq ft lot
- Built 1932
- Listed 21 days
Property features AI
Exterior
- Parking: Driveway
- Utilities: Electric service (NYSEG); Public sewer; Public water connected; Electricity connected; Trash collection (public); Cable available
- Home design: Single-family residence; Fixer condition
- Construction: Log siding construction
- Exterior features: Log siding; Partial fencing; Not waterfront
Interior
- Kitchen: Oven; Range; Refrigerator
- Bedrooms: One bedroom on the first floor
- Bathrooms: One full bathroom
- Heating & cooling: Oil-fired baseboard heating; No central cooling
- Interior features: First-floor bedroom; First-floor full bathroom; Entrance foyer; Washer/dryer hookup; Unfinished walk-out basement; Dormer attic
- Laundry & utility: Washer/Dryer hookup
Neighborhood map
What this means for you Summary
Snapshot
- This is a 3-bed/1.0-bath single-family listed at $299k.
Deal economics
- At list price, monthly cash flow is $359 ($4k/yr) — positive.
- The deal already cash-flows at list — no discount required.
- Meets the 1% rule at list price ($4k rent vs $299k).
- Recommended offer: $295k (1.5% below list) — sets the bar for market timing.
- Cap rate 7.7% vs local median 2.3% in Mahopac — top-decile yield for the area; either an underpriced asset or a hidden risk that comps aren't pricing in. Stress-test before assuming the spread holds.
Location & tenants
- Location reads 67/100 on livability (#572 in NY) — a middle-class / working-renter tenant base. Strengths: employment A+, housing A+, health & safety A; Watch: amenities F, commute F, cost of living F.
- Mahopac Central School District (suburban): math 61% / reading 65% proficiency, ranked #156 of 590 in NY (top 26%) — acceptable for families but not a draw, mixed tenant base, ~2y average lease; only 8% free/reduced lunch — higher-income household profile.
- Zoned schools: Austin Road Elementary School (math 42% / reading 67%, grade C, #908 of 2,108 statewide, top 46%, 585 students, 22% FRL); Mahopac Middle School (math 56% / reading 70%, grade B+, #129 of 729 statewide, top 18%, 926 students, 24% FRL); Mahopac High School (math 97% / reading 72%, grade A, #379 of 1,100 statewide, top 36%, 1,254 students, 24% FRL) — zoned schools average 23% FRL vs 8% district-wide (16 pts higher); higher-poverty schools than district average — tighter screening recommended.
- Market conditions: 160 active listings in the ZIP; 2 comparable units currently listed for rent nearby; 142 units permitted in Putnam County in 2024 (75 in 5+ unit buildings).
Forward outlook
- Local home prices are declining (-3.0%/yr); year-one equity from $2k of loan paydown is wiped out by about $9k of value loss. Plan a longer hold.
- Putnam County population projected to shrink 3% by 2050 — rents likely to lag national; underwrite the cash flow, not the appreciation.
Negotiation context
- It's been on market 21 days — a 2% lower offer ($295k) is reasonable based on typical stale-listing flexibility.
Risks & watch-outs
- Watch-outs: property tax is 2.9% of price; built in 1932 — expect roof / HVAC / electrical / plumbing capex.
Questions for the listing agent
- Built in 1932 — when were the roof, HVAC, electrical panel, plumbing, and water heater last replaced?
- Property tax is high relative to price — has the assessment been appealed recently, and will the sale trigger a re-assessment?
- Is there a deadline driving the sale (1031 exchange, divorce, estate, relocation)? That informs how much negotiation room exists.
- Schools are B-rated — typically a magnet for longer-tenancy family renters. What's the average tenant stay here, and is there a school-zone premium baked into asking?
- What's the average days-on-market for RENTAL listings here right now (not sales)? A rising rental-DOM trend means longer vacancies and softer asking-rent achievability than the comps imply.
- What's the recent tenant-quality profile in this submarket — average credit score on applications, eviction rate, late-payment / NSF rate, and stable-employment percentage? A property-management company in the area should have these aggregated.
- How much new for-sale + rental construction is in the pipeline within 1–3 miles? Heavy new supply typically softens prices + rents 12–24 months out; constrained supply supports both.
Investment metrics
- 1% rule
- 1.18% ✓
- Cap rate
- 7.73%
- Cash-on-cash
- 5.15%
- DSCR
- 1.23
- GRM
- 7.1
CMA / ARV
- ARV (on-the-fly)
- $448,592
- Comps found
- 8
Show comp detail 8 sales within ~0.75 mi
| Address | Dist | Beds/Ba | Sqft | Sold | Price | $/sf | Match |
|---|---|---|---|---|---|---|---|
| 214 North Rd | 0.19mi | 3/2.0 | 1,197 (-2%) | 3mo | $465,000 | $388 | 82 |
| 312 Brook Rd | 0.10mi | 3/1.0 | 1,115 (-8%) | 6mo | $410,000 | $368 | 76 |
| 126 Topland Rd | 0.18mi | 3/1.0 | 1,292 (+6%) | 13mo | $383,000 | $296 | 71 |
| 84 Entrance Way | 0.32mi | 3/2.0 | 1,144 (-6%) | 6mo | $535,000 | $468 | 66 |
| 210 North Rd | 0.19mi | 3/1.0 | 1,260 (+3%) | 24mo | $345,000 | $274 | 66 |
| 323 Birch Rd | 0.10mi | 3/2.0 | 1,400 (+15%) | 10mo | $470,000 | $336 | 58 |
| 337 Rockledge Rd | 0.26mi | 2/2.0 (-1) | 1,170 (-4%) | 18mo | $387,000 | $331 | 57 |
| 317 Center Dr | 0.20mi | 3/2.0 | 1,340 (+10%) | 23mo | $525,000 | $392 | 51 |
Match score weights: distance 35% · size 25% · config 20% · recency 20%. Top-matched comps best support the ARV.
Projected returns pro-forma
-3.0% appreciation · 3.0% rent growth · sell at horizon
- IRR
- -8.2%
- Equity multiple
- 0.70×
- Total profit
- $-25,298
- Equity at exit
- $44,582
- IRR
- 1.4%
- Equity multiple
- 1.10×
- Total profit
- $8,540
- Equity at exit
- $25,852
Cash invested: $83,720 (down + closing). Projections, not guarantees.
Landlord ↔ Tenant lean methodology
- Overall (STATE)
- 15 Strongly Tenant-Friendly
- State New York
- 15 Strongly Tenant-Friendly · D+10
- County
- — inherits STATE
- City
- — inherits STATE
ZIP-level market 10541
- Home prices YoY
- -25.8%
- Active inventory
- 160
- Price-to-rent
- 7.1×
Monthly cashflow live
- Estimated rent
- $3,522 medium interval (Pro) →
- Mortgage (P&I)
- −$1,568
- Tax from tax record
- −$731 /mo · $8,769/yr
- Insurance
- −$125
- HOA
- −$0
- Vacancy / Maint / Mgmt
- −$740
- Net cashflow
- $359
Break-even live
UW: 25.0% down · 7.5% · 30yr · 1.5% tax · 5.0% vac · 8.0% maint · 8.0% mgmt
Financing live
Cash to close
- Down payment
- $74,750
- Closing costs
- $8,970
- Reserves months
- —
- Total cash needed
- —
Loan-product check · same deal, 3 products live
Conventional
25% down · 7.5% · 30yr
- Down + closing
- —
- Monthly P&I
- —
- Monthly cashflow
- —
- DSCR
- —
- Eligible?
- —
Personal DTI + credit; lowest rate.
DSCR
20% down · 8.5% · 30yr
- Down + closing
- —
- Monthly P&I
- —
- Monthly cashflow
- —
- DSCR
- —
- Eligible?
- —
No personal income docs; deal must DSCR.
Hard money
10% down · 12.0% · 12mo
- Down + closing
- —
- Monthly P&I
- —
- Monthly cashflow
- —
- DSCR
- —
- Eligible?
- —
Short-term bridge; refi at stabilization.
Rent comps 2 comps
| Address | Beds | Baths | Sqft | Rent | $/sqft | DOM | Units | Dist |
|---|---|---|---|---|---|---|---|---|
| 66 Secor Rd Mahopac, NY | 2.0 | 2.0 | 1100 | $3,700 | $3.36 | 44d | 1 | 0.48mi |
| 22 Lauro Ridge Ct Mahopac, NY | 2.0 | 1.0 | 1000 | $3,100 | $3.10 | 44d | 1 | 1.04mi |
Listing history 3 events
-
2026-04-27status Pending
-
2026-04-07$299,000 Active
-
2026-04-06historical $299,000
ⓘ Source: listings_history table (triggers on properties + properties_extension) + one-shot
backfill from property_details.listing_events for pre-trigger history.
Tax reassessment forecast NY · Partial reset (capped growth)
- Current annual tax
- $8,769 · $731/mo
- Projected year-2 tax
- $8,769 · $731/mo
- Expected delta
- $0/yr ($0/mo · 0.0%)
ⓘ Screening estimate from a state-policy table — verify with the county assessor before closing.
Climate risk First Street
- Flood 1/10 Low FEMA zone X (unshaded) · 0% chance over 30 yrs
- Wildfire 3/10 Moderate
- Heat 4/10 Moderate 7 d/yr ≥97°F today · 16 d/yr by 30 yrs out
- Wind 4/10 Moderate 17% chance of damaging wind over 30 yrs
- Air quality 3/10 Moderate 2 unhealthy d/yr today · 4 by 30 yrs out
Nearby sold comps map
Loading sold comps map…
Walkable amenities ~0.75 mi
Loading nearby amenities…
Taxation est. · year 1
- Rental income
- $42,267
- − Mortgage interest
- −$16,749
- − Property taxes
- −$8,769
- − Insurance
- −$1,495
- − Repairs & maintenance
- −$3,381
- − Management
- −$3,381
- − Depreciation
- −$8,698
- Taxable loss
- −$207
- Est. tax savings @ 24.0%
- +$50
- After-tax cash flow
- $4,360/yr
For passive investors: Depreciation is non-cash, so a rental often shows a tax loss while cash-flowing — sheltering income. Rental losses are passive: they offset passive income freely, and up to $25,000/yr can offset ordinary (W-2) income if you actively participate and your MAGI is under $100k (phasing out to $0 by $150k); unused losses carry forward. On sale, claimed depreciation is recaptured at up to 25%, and gains may owe capital-gains tax (a 1031 exchange can defer both). Figures are a year-1 estimate at your 24.0% rate — not tax advice; consult a CPA.
Schools (NCES district)
- District
- Mahopac Central School District
- NCES district ID
- 3618120
- Math proficiency
- 61% ▼ -8.00%
- Reading proficiency
- 65% ▲ 3.00%
- Median HH income
- $103,440
- Composite
- 58.66/100
- National rank
- #983
- State rank
- #156 of 590 in NY
Livability — Mahopac
- Score
- 67/100
- State rank
- #572
- US rank
- #10297
Category grades
Schools grade is shown separately in the Schools card above.
Census & demographics
- City population
- 26,137
- Population (ZIP)
- 26,137
Population outlook (Putnam County) Hauer SSP2
- Today (2025)
- 99,705 people
- By 2030
- 99,650 · -0.1%
- By 2040
- 98,641 · -1.1%
- By 2050
- 96,348 · -3.4%
- By 2075
- 94,412 · -5.3%
- By 2100
- 88,728 · -11.0%
Race, ethnicity, and origin ACS 2023
- Neighborhood character
- Predominantly White (74%)
- Race & ethnicity
- White 74% Hispanic / Latino 19% Two or more races 8% Asian 3% Black 2%
- Hispanic origin (detail)
- Mexican 3% Puerto Rican 6% Dominican 2%
- Common ancestry
- Romanian 4% Lithuanian 1% Scotch-Irish 1%
- Foreign-born
- 13% · Canada, Jamaica
- Languages at home
- 79% English-only · Spanish 12% Other Indo-European 5% Other Asian/Pacific 1%
Political lean MEDSL · Putnam
- 2024 margin
- R (+13.7) · D 43.2% · R 56.8%
- 2008→2024 swing
- -6.2pp toward R · 2008: -7.5pp · 2024: -13.7pp
- All cycles
- 2024: R+13.7 2020: R+7.9 2016: R+17.8 2012: R+11.2 2008: R+7.5
Not yet ingested
- Civics
- —
Market trends
- HPI YoY
- ▼ -87.95%
- Current HPI
- 253.3461
- Rent YoY
- —
- Metro
- —
- State GDP YoY
- ▲ 2.60%
- F500 in state
- 92
Industry mix (Fortune 500 HQ in NY)
| Industry | F500 HQs | Revenue |
|---|---|---|
| Financial Services | 10 | $950B |
|
||
| Consumer Goods | 9 | $162B |
|
||
| Insurance | 4 | $225B |
|
||
| Telecommunications | 2 | $144B |
|
||
| Pharmaceuticals | 2 | $112B |
|
||
| Media / Entertainment | 2 | $69B |
|
||
Price history
+0.0% since first listed3 events — show timeline
- 2026-04-27 Pending — OneKey® MLS as Distributed by MLS Grid
- 2026-04-07 Listed $299,000 OneKey® MLS as Distributed by MLS Grid
- 2026-04-06 Coming Soon $299,000 OneKey® MLS as Distributed by MLS Grid
Property tax history
+11.4%/yrLatest (2025): $8,769 · +0.1% YoY. Source: county tax records.
Cash-flow waterfall
monthlySold comps — $/sqft
last 12 mo · ≤1 miLoading sold comps…