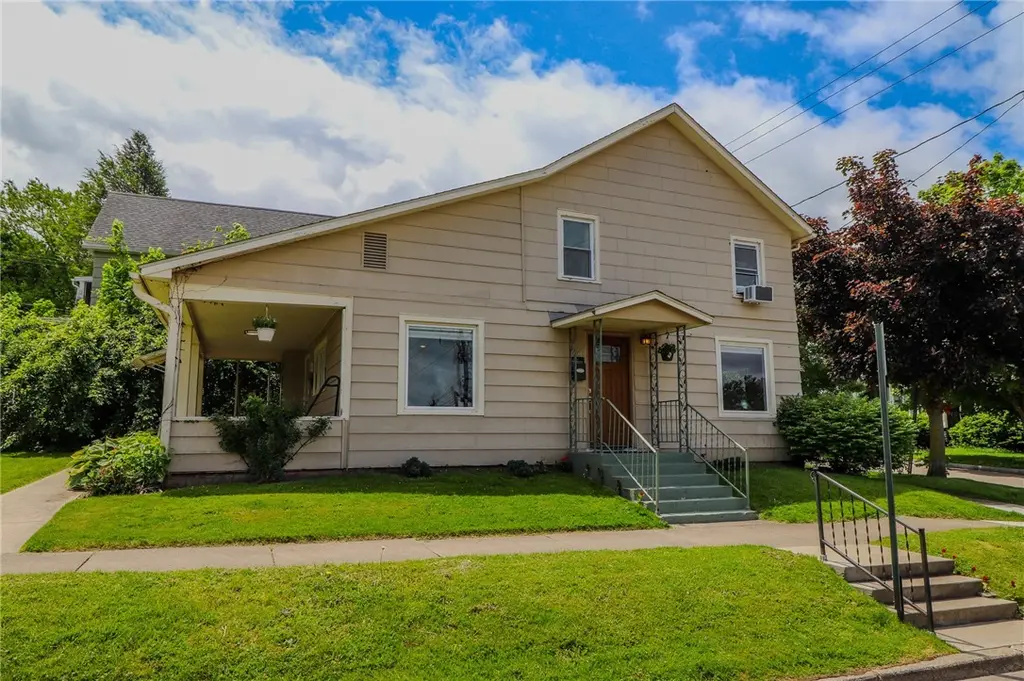
44 W 3rd St · Corning, NY
Flood risk 1/10 · Minimal
- FEMA flood zone
- X
- Chance of flooding over 30 yrs
- 0.0%
- Est. flood insurance / yr
- $473 – $860
Fire risk 2/10 · Minimal
- Est. fire insurance / yr
- $691 – $1,283
Heat risk 3/10 · Minor
- Hot days now (above 94°F)
- 7 days/yr
- Hot days in 30 yrs
- 16 days/yr
Wind risk 1/10 · Minimal
- Chance of severe wind over 30 yrs
- 0.0%
Air-quality risk 1/10 · Minimal
- Unhealthy air days now
- 0 days/yr
- Unhealthy air days in 30 yrs
- 0 days/yr
Risk factors via First Street. Map © Google.
Why this score? — see what drove the D+ grade
The composite is a weighted blend of 9 inputs, each scored 0–100. Each bar is that input's sub-score; the figure is the points it added to the 100-point composite (weight × sub-score).
- Cash flow +20.1/30.0
- DSCR +6.4/10.0
- 1% rule +5.6/10.0
- Livability +4.4/5.0
- Schools +4.2/10.0
- Rent growth +2.5/5.0
- Condition / age +2.5/5.0
- ARV discount +1.8/15.0
- Appreciation +0.0/10.0
$165,000
🖨 Deal sheet 📄 Offer letter ✓ Due diligence
Listing remarks MLS
Full sized open porch, washer & dryer hookups off kitchen, full bath down, newer kitchen cabinets & countertops, range & dishwasher, laminate flooring, living room, dining room, up is newer full bath, now 2 bdrm but could be 3 bdrm. Some new windows, small lot. The dehumidifier belongs to Bank it will not be sold with the house.
Key facts
- Move-in ready
- Fully renovated
- Lovely covered patio
Tags
Property features AI
Exterior
- Parking: No garage; No driveway
- Utilities: Electricity connected (circuit breakers); Public water connected; Sewer connected; Cable available; High-speed internet available; Gas water heater
- Home design: 2 stories; Existing property
- Construction: Composite siding with frame construction; Asphalt architectural shingle roof; Stone foundation; Full basement with dirt floor and sump pump
- Exterior features: Patio; Rectangular residential lot; City street frontage; Lot dimensions approximately 63 x 41
Interior
- Kitchen: Granite counters; Electric oven; Electric range; Microwave; Dishwasher; Refrigerator
- Bedrooms: Total rooms: 7; Includes living areas and laundry (see room list)
- Flooring: Carpet; Laminate; Vinyl; Varies
- Bathrooms: 2 full bathrooms; 1 bathroom on the main level
- Heating & cooling: Gas forced-air heating
- Interior features: Thermal windows; Separate/formal dining room; Eat-in kitchen; Separate/formal living room; Granite counters
- Laundry & utility: Washer; Dryer; Main-level laundry
Neighborhood map
What this means for you Summary
Snapshot
- This is a 2-bed/2.0-bath single-family listed at $165k.
Deal economics
- At list price, monthly cash flow is $204 ($2k/yr) — positive.
- The deal already cash-flows at list — no discount required.
- Meets the 1% rule at list price ($2k rent vs $165k).
Location & tenants
- Location reads 87/100 on livability (#14 in NY, #334 nationally) — a professional / high-income tenant draw. Strengths: amenities A+, housing A+, health & safety A+; Watch: employment D.
- Corning City School District (town): math 44% / reading 53% proficiency, ranked #406 of 590 in NY (top 69%) — families likely to look elsewhere, expect single-tenant / working-renter base with shorter leases.
- Market conditions: 106 active listings in the ZIP; 8 comparable units currently listed for rent nearby; rentals lingering (median 44d on market — plan ~5-8 weeks vacancy on turnover, expect pricing pressure); 100% of comp listings sitting > 30 days — soft ceiling on asking rent; 196 units permitted in Steuben County in 2024 (0 in 5+ unit buildings).
Forward outlook
- Local home prices are declining (-3.0%/yr); year-one equity from $1k of loan paydown is wiped out by about $5k of value loss. Plan a longer hold.
- Steuben County population projected at -20% by 2050 — secular population decline; favor cash flow + early exit over multi-decade hold.
Negotiation context
- Only 6 days on market — expect competitive offers; lowballing is unlikely to land.
- 5 sale attempts since 18y ago with the ask held roughly flat each time — persistent listings suggest the price (not the market) is what's stuck; bring a comps-based counter.
- Current owner paid $102k; list at $165k implies a 61% gain — meaningful room to come down on a strong offer.
Risks & watch-outs
- Watch-outs: built in 1900 — expect roof / HVAC / electrical / plumbing capex.
Questions for the listing agent
- Built in 1900 — when were the roof, HVAC, electrical panel, plumbing, and water heater last replaced?
- Is there a deadline driving the sale (1031 exchange, divorce, estate, relocation)? That informs how much negotiation room exists.
- Schools are A-rated — typically a magnet for longer-tenancy family renters. What's the average tenant stay here, and is there a school-zone premium baked into asking?
- The area grade is low — what's the realistic commute time and amenity access for the typical tenant pool here? Any planned neighborhood developments (good or bad) we should know about?
- What's the average days-on-market for RENTAL listings here right now (not sales)? A rising rental-DOM trend means longer vacancies and softer asking-rent achievability than the comps imply.
- What's the recent tenant-quality profile in this submarket — average credit score on applications, eviction rate, late-payment / NSF rate, and stable-employment percentage? A property-management company in the area should have these aggregated.
- How much new for-sale + rental construction is in the pipeline within 1–3 miles? Heavy new supply typically softens prices + rents 12–24 months out; constrained supply supports both.
Investment metrics
- 1% rule
- 1.06% ✓
- Cap rate
- 7.78%
- Cash-on-cash
- 5.31%
- DSCR
- 1.24
- GRM
- 7.9
CMA / ARV
- ARV (on-the-fly)
- $146,510
- Comps found
- 12
Show comp detail 12 sales within ~0.75 mi
| Address | Dist | Beds/Ba | Sqft | Sold | Price | $/sf | Match |
|---|---|---|---|---|---|---|---|
| 128 W Fourth St | 0.19mi | 2/2.0 | 1,218 (-4%) | 2mo | $165,000 | $135 | 82 |
| 201 W 1st St | 0.39mi | 2/1.5 | 1,323 (+4%) | 1mo | $145,500 | $110 | 72 |
| 139 W 4th St | 0.21mi | 2/1.0 | 1,140 (-10%) | 1mo | $110,000 | $96 | 68 |
| 75 W First St | 0.19mi | 3/1.5 (+1) | 1,296 (+2%) | 17mo | $145,000 | $112 | 67 |
| 156 Watauga Ave | 0.49mi | 3/1.0 (+1) | 1,268 (-0%) | 1mo | $181,000 | $143 | 67 |
| 131 W Fifth St | 0.22mi | 3/1.5 (+1) | 1,398 (+10%) | 12mo | $175,000 | $125 | 56 |
| 247 Wall St | 0.32mi | 3/1.5 (+1) | 1,228 (-4%) | 19mo | $240,000 | $195 | 56 |
| 317 W 1st St | 0.61mi | 2/1.0 | 1,199 (-6%) | 2mo | $95,000 | $79 | 56 |
| 125 W Sixth St | 0.27mi | 3/2.0 (+1) | 1,133 (-11%) | 12mo | $165,340 | $146 | 53 |
| 273 Sunset Dr | 0.56mi | 2/1.0 | 1,182 (-7%) | 13mo | $75,000 | $63 | 47 |
| 290 Sunset Dr | 0.58mi | 3/1.0 (+1) | 1,204 (-6%) | 14mo | $138,900 | $115 | 44 |
| 273 E Third St | 0.69mi | 3/1.5 (+1) | 1,452 (+14%) | 12mo | $150,000 | $103 | 27 |
Match score weights: distance 35% · size 25% · config 20% · recency 20%. Top-matched comps best support the ARV.
Projected returns pro-forma
-3.0% appreciation · 3.0% rent growth · sell at horizon
- IRR
- -8.0%
- Equity multiple
- 0.70×
- Total profit
- $-13,664
- Equity at exit
- $24,602
- IRR
- 1.5%
- Equity multiple
- 1.11×
- Total profit
- $5,074
- Equity at exit
- $14,266
Cash invested: $46,200 (down + closing). Projections, not guarantees.
Landlord ↔ Tenant lean methodology
- Overall (STATE)
- 15 Strongly Tenant-Friendly
- State New York
- 15 Strongly Tenant-Friendly · D+10
- County
- — inherits STATE
- City
- — inherits STATE
ZIP-level market 14830
- Active inventory
- 106
- Price-to-rent
- 7.9×
Monthly cashflow live
- Estimated rent
- $1,751 high interval (Pro) →
- Mortgage (P&I)
- −$865
- Tax from tax record
- −$245 /mo · $2,936/yr
- Insurance
- −$69
- HOA
- −$0
- Vacancy / Maint / Mgmt
- −$368
- Net cashflow
- $204
Break-even live
UW: 25.0% down · 7.5% · 30yr · 1.5% tax · 5.0% vac · 8.0% maint · 8.0% mgmt
Financing live
Cash to close
- Down payment
- $41,250
- Closing costs
- $4,950
- Reserves months
- —
- Total cash needed
- —
Loan-product check · same deal, 3 products live
Conventional
25% down · 7.5% · 30yr
- Down + closing
- —
- Monthly P&I
- —
- Monthly cashflow
- —
- DSCR
- —
- Eligible?
- —
Personal DTI + credit; lowest rate.
DSCR
20% down · 8.5% · 30yr
- Down + closing
- —
- Monthly P&I
- —
- Monthly cashflow
- —
- DSCR
- —
- Eligible?
- —
No personal income docs; deal must DSCR.
Hard money
10% down · 12.0% · 12mo
- Down + closing
- —
- Monthly P&I
- —
- Monthly cashflow
- —
- DSCR
- —
- Eligible?
- —
Short-term bridge; refi at stabilization.
Rent comps 8 comps
| Address | Beds | Baths | Sqft | Rent | $/sqft | DOM | Units | Dist |
|---|---|---|---|---|---|---|---|---|
| 125 W Market St Corning, NY | 1.0 | 1.0 | 1026 | $1,600 | $1.56 | 43d | 1 | 0.32mi |
| 90 E Market St Unit 2 Corning, NY | 2.0 | 1.0 | 1044 | $2,200 | $2.11 | 43d | 1 | 0.40mi |
| 171 E 1st St Corning, NY | 3.0 | 2.5 | 1569 | $3,352 | $2.14 | 43d | 1 | 0.53mi |
| 265 Denison Pkwy E Corning, NY | 1.0–2.0 | 1.0 | 910 | $1,495 | $1.64 | 43d | 1 | 0.77mi |
| 137 Field St Corning, NY | 2.0–3.0 | 1.0 | 1125 | $1,295 | $1.15 | 43d | 3 | 0.83mi |
| 311 Denison Pkwy E Unit 201 Corning, NY | 1.0 | 1.0 | 920 | $1,350 | $1.47 | 43d | 1 | 0.83mi |
| 209 Oneida Pl Corning, NY | 3.0 | 1.5 | 1200 | $2,000 | $1.67 | 43d | 1 | 1.18mi |
| 247 Princeton Ave Corning, NY | 3.0 | 1.0 | 1504 | $1,500 | $1.00 | 43d | 1 | 1.32mi |
Listing history 17 events
-
2026-06-05statusdays on market $165,000 Pending 6 DOM
-
2026-06-03days on market $165,000 Active 5 DOM
-
2026-06-02days on market $165,000 Active 4 DOM
-
2026-06-01days on market $165,000 Active 3 DOM
-
2026-05-31days on market $165,000 Active 2 DOM
-
2026-05-29$165,000 Active
-
2021-12-22soldstatus $102,500
-
2016-05-25soldstatus $50,000 348-char remark
Show marketing remark (348 chars)
Full sized open porch, washer & dryer hookups off kitchen, full bath down, newer kitchen cabinets & countertops, range & dishwasher, laminate flooring, living room, dining room, up is newer full bath, now 2 bdrm but could be 3 bdrm. Some new windows, small lot. The dehumidifier belongs to Bank it will not be sold with the house.
-
2015-09-16$63,750 348-char remark
Show marketing remark (348 chars)
Full sized open porch, washer & dryer hookups off kitchen, full bath down, newer kitchen cabinets & countertops, range & dishwasher, laminate flooring, living room, dining room, up is newer full bath, now 2 bdrm but could be 3 bdrm. Some new windows, small lot. The dehumidifier belongs to Bank it will not be sold with the house.
-
2009-09-15soldstatus $82,000
-
2009-09-10soldstatus $84,000 118-char remark
Show marketing remark (118 chars)
Move right in! Completely renovated home. New kitchen, new appliances, new bathrooms, new carpeting, and so much more.
-
2009-05-07$82,000 118-char remark
Show marketing remark (118 chars)
Move right in! Completely renovated home. New kitchen, new appliances, new bathrooms, new carpeting, and so much more.
-
2008-10-24historical
-
2008-07-24$82,000
-
2008-04-18soldstatus $40,000
-
2008-03-28soldstatus $40,000
-
2008-01-13$45,000
ⓘ Source: listings_history table (triggers on properties + properties_extension) + one-shot
backfill from property_details.listing_events for pre-trigger history.
Tax reassessment forecast NY · Partial reset (capped growth)
- Current annual tax
- $2,936 · $245/mo
- Projected year-2 tax
- $2,936 · $245/mo
- Expected delta
- $0/yr ($0/mo · 0.0%)
ⓘ Screening estimate from a state-policy table — verify with the county assessor before closing.
Climate risk First Street
- Flood 1/10 Low FEMA zone X · 0% chance over 30 yrs
- Wildfire 2/10 Low
- Heat 3/10 Moderate 7 d/yr ≥94°F today · 16 d/yr by 30 yrs out
- Wind 1/10 Low 0% chance of damaging wind over 30 yrs
- Air quality 1/10 Low 0 unhealthy d/yr today · 0 by 30 yrs out
Nearby sold comps map
Loading sold comps map…
Walkable amenities ~0.75 mi
Loading nearby amenities…
Taxation est. · year 1
- Rental income
- $21,010
- − Mortgage interest
- −$9,243
- − Property taxes
- −$2,936
- − Insurance
- −$825
- − Repairs & maintenance
- −$1,681
- − Management
- −$1,681
- − Depreciation
- −$4,800
- Taxable loss
- −$155
- Est. tax savings @ 24.0%
- +$37
- After-tax cash flow
- $2,491/yr
For passive investors: Depreciation is non-cash, so a rental often shows a tax loss while cash-flowing — sheltering income. Rental losses are passive: they offset passive income freely, and up to $25,000/yr can offset ordinary (W-2) income if you actively participate and your MAGI is under $100k (phasing out to $0 by $150k); unused losses carry forward. On sale, claimed depreciation is recaptured at up to 25%, and gains may owe capital-gains tax (a 1031 exchange can defer both). Figures are a year-1 estimate at your 24.0% rate — not tax advice; consult a CPA.
Schools (NCES district)
- District
- Corning City School District
- NCES district ID
- 3608400
- Math proficiency
- 44% ▼ -12.00%
- Reading proficiency
- 53% ▲ 4.00%
- Median HH income
- $53,042
- Composite
- 41.8/100
- National rank
- #3392
- State rank
- #406 of 590 in NY
Livability — Corning
- Score
- 87/100
- State rank
- #14
- US rank
- #334
Category grades
Schools grade is shown separately in the Schools card above.
Census & demographics
- Census place
- Corning, NY
- County
- Steuben County · 41,193 people
- City population
- 19,015
- Metro
- Corning, NY
- Population (ZIP)
- 19,015
- Household income
- $73,263
- Rent vs Own
- Severe rent burden
- 565.0
Population outlook (Steuben County) Hauer SSP2
- Today (2025)
- 93,062 people
- By 2030
- 89,793 · -3.5%
- By 2040
- 82,353 · -11.5%
- By 2050
- 74,286 · -20.2%
- By 2075
- 55,589 · -40.3%
- By 2100
- 37,587 · -59.6%
Race, ethnicity, and origin ACS 2023
- Neighborhood character
- Predominantly White (91%)
- Race & ethnicity
- White 91% Two or more races 3% Black 3% Hispanic / Latino 3% Asian 2%
- Common ancestry
- Romanian 4% Slovak 3% Lithuanian 2%
- Foreign-born
- 5% · Canada, China
- Languages at home
- 95% English-only · Russian/Polish/Slavic 1% Spanish 1% Other Asian/Pacific 1%
Political lean MEDSL · Steuben
- 2024 margin
- Solid R (+31.8) · D 34.1% · R 65.9%
- 2008→2024 swing
- -15.0pp toward R · 2008: -16.8pp · 2024: -31.8pp
- All cycles
- 2024: R+31.8 2020: R+29.6 2016: R+36.2 2012: R+16.4 2008: R+16.8
Not yet ingested
- Civics
- —
Market trends
- HPI YoY
- ▼ -94.59%
- Current HPI
- 173.9857
- Rent YoY
- —
- Metro
- Corning, NY
- State GDP YoY
- ▲ 2.60%
- F500 in state
- 92
Industry mix (Fortune 500 HQ in NY)
| Industry | F500 HQs | Revenue |
|---|---|---|
| Financial Services | 10 | $950B |
|
||
| Consumer Goods | 9 | $162B |
|
||
| Insurance | 4 | $225B |
|
||
| Telecommunications | 2 | $144B |
|
||
| Pharmaceuticals | 2 | $112B |
|
||
| Media / Entertainment | 2 | $69B |
|
||
Price history
+266.7% since first listed12 events — show timeline
- 2026-05-29 Listed $165,000 UNYREIS
- 2021-12-22 Sold (Public Records) $102,500 Public Records
- 2016-05-25 Sold (MLS) $50,000 UNYREIS
- 2015-09-16 Listed $63,750 UNYREIS
- 2009-09-15 Sold (Public Records) $82,000 Public Records
- 2009-09-10 Sold (MLS) $84,000 UNYREIS
- 2009-05-07 Listed $82,000 UNYREIS
- 2008-10-24 Listing Removed — UNYREIS
- 2008-07-24 Listed $82,000 UNYREIS
- 2008-04-18 Sold (Public Records) $40,000 Public Records
- 2008-03-28 Sold (MLS) $40,000 UNYREIS
- 2008-01-13 Listed $45,000 UNYREIS
Property tax history
+2.8%/yrLatest (2025): $2,936 · -1.9% YoY. Source: county tax records.
Cash-flow waterfall
monthlySold comps — $/sqft
last 12 mo · ≤1 miLoading sold comps…