6108 Abrams Rd #128 · Dallas, TX
Flood risk 1/10 · Minimal
- FEMA flood zone
- X (unshaded)
- Chance of flooding over 30 yrs
- 0.0%
- Est. flood insurance / yr
- $507 – $1,088
Fire risk 2/10 · Minimal
- Est. fire insurance / yr
- $1,222 – $2,270
Heat risk 7/10 · Major
- Hot days now (above 109°F)
- 7 days/yr
- Hot days in 30 yrs
- 23 days/yr
Wind risk 6/10 · Moderate
- Chance of severe wind over 30 yrs
- 27.0%
Air-quality risk 3/10 · Minor
- Unhealthy air days now
- 3 days/yr
- Unhealthy air days in 30 yrs
- 3 days/yr
Risk factors via First Street. Map © Google.
Why this score? — see what drove the B grade
The composite is a weighted blend of 9 inputs, each scored 0–100. Each bar is that input's sub-score; the figure is the points it added to the 100-point composite (weight × sub-score).
- Cash flow +24.9/30.0
- ARV discount +15.0/15.0
- 1% rule +10.0/10.0
- DSCR +8.1/10.0
- Livability +4.0/5.0
- Rent growth +3.0/5.0
- Schools +2.8/10.0
- Condition / age +2.5/5.0
- Appreciation +0.0/10.0
$68,300
🖨 Deal sheet 📄 Offer letter ✓ Due diligence
Listing remarks MLS
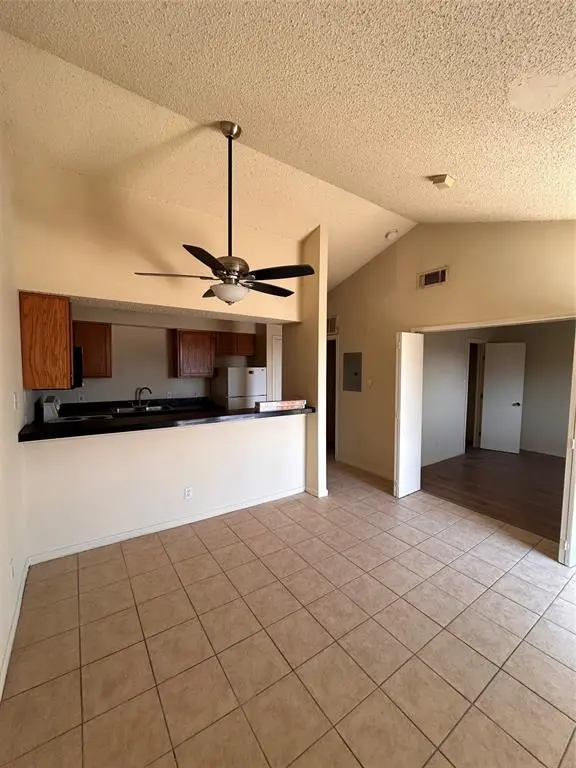
Investor Portfolio Opportunity – 10+ Units Available Value-Add Potential Bulk Pricing Available Motivated seller offering a prime opportunity for investors to acquire multiple units in a high-demand Dallas location. Individual and bulk purchase options available. This second-floor 1-bedroom, 1-bath condo offers a functional and comfortable layout, featuring: Open kitchen with breakfast bar Refrigerator, washer, and dryer included Electric range and built-in microwave Brick fireplace Private patio with exterior storage Spacious bedroom with walk-in closet Community amenities include a pool and centralized mailboxes, adding convenience for residents and tenants. Located with easy access to Loop 12 and US-75, and just minutes from shopping, dining, and everyday essentials, this property is well-positioned for both rental demand and long-term value. Investment Highlights: Strong rental potential in a growing area Low-maintenance property ideal for buy-and-hold investors Opportunity to scale with multiple units Appealing layout for tenants and end-users Whether you're expanding your portfolio or purchasing your first investment, this is a strategic opportunity with upside potential. Schedule your tour today.
Key facts
- Brick fireplace
- Walk-in closet
- Private patio
Tags
Neighborhood map
What this means for you Summary
Snapshot
- This is a 1-bed/1.0-bath condo listed at $68k.
Deal economics
- At list price, monthly cash flow is $146 ($2k/yr) — positive.
- The deal already cash-flows at list — no discount required.
- Meets the 1% rule at list price ($1k rent vs $68k).
- Recommended offer: $60k (12.0% below list) — sets the bar for market timing.
- Cap rate 8.9% vs local median 2.3% in Dallas — top-decile yield for the area; either an underpriced asset or a hidden risk that comps aren't pricing in. Stress-test before assuming the spread holds.
Location & tenants
- Location reads 81/100 on livability (#24 in TX, #1,380 nationally) — a professional / high-income tenant draw. Strengths: amenities A+, commute A+, housing A+; Watch: schools C-, crime F.
- Dallas ISD (urban): math 31% / reading 36% proficiency, ranked #559 of 826 in TX (top 68%) — families likely to look elsewhere, expect single-tenant / working-renter base with shorter leases; 83% free/reduced lunch — lower-income household profile, screen leases tightly.
- Market conditions: Rents rising (+2.0%/yr); 213 active listings in the ZIP; 40 comparable units currently listed for rent nearby; rentals leasing fast (median 13d on market — plan ~1-2 weeks tenant-placement turnaround); 12,577 units permitted in Dallas County in 2024 (6,829 in 5+ unit buildings).
Forward outlook
- Local home prices are declining (-3.0%/yr); year-one equity from $472 of loan paydown is wiped out by about $2k of value loss. Plan a longer hold.
- Dallas County population projected at +35% by 2050 — long-run rental-demand tailwind backs the buy-and-hold thesis.
Negotiation context
- It's been on market 135 days — a 12% lower offer ($60k) is reasonable based on typical stale-listing flexibility.
Risks & watch-outs
- Watch-outs: property tax is 2.8% of price; HOA is 20% of rent.
- Climate carrying-cost: major wind risk, 27% chance of damaging wind over 30y; extreme-heat days projected 7→23/yr by 2055 (HVAC capex compounding) — expect insurance premiums to compound above CPI over the hold.
Questions for the listing agent
- It's been on market 135 days. Have you received any prior offers? Is the seller open to a 12% concession, seller financing, or rate buy-down credit?
- Property tax is high relative to price — has the assessment been appealed recently, and will the sale trigger a re-assessment?
- What does the HOA fee cover, when was the last increase, and are there any pending special assessments or reserve-fund shortfalls?
- Any open or pending special assessments — roof, HVAC, plumbing, elevator, façade? What's the per-unit balance and payoff schedule, and is the seller paying it off at close or rolling it to the buyer?
- Why hasn't it sold? Are there any deal-killer items the seller is aware of (foundation, flood, title, zoning, code violations)?
- Is there a deadline driving the sale (1031 exchange, divorce, estate, relocation)? That informs how much negotiation room exists.
- Crime grade is F in this area — have there been break-ins, vandalism, or insurance claims at this property in the last 3 years? What carrier currently insures it and at what premium?
- What's the average days-on-market for RENTAL listings here right now (not sales)? A rising rental-DOM trend means longer vacancies and softer asking-rent achievability than the comps imply.
- What's the recent tenant-quality profile in this submarket — average credit score on applications, eviction rate, late-payment / NSF rate, and stable-employment percentage? A property-management company in the area should have these aggregated.
- How much new apartment / multifamily construction is in the pipeline within 1–3 miles? Heavy new supply (>2% of stock underway) typically softens rents 12–24 months out; light construction supports rent growth.
Investment metrics
- 1% rule
- 1.73% ✓
- Cap rate
- 8.86%
- Cash-on-cash
- 9.18%
- DSCR
- 1.41
- GRM
- 4.8
CMA / ARV
- ARV (median comp)
- $101,651
- List price
- $68,300
- Delta
- -27.00%
- Verdict
- UNDERPRICED
- Comps
- 20 within 1.0 mi
Projected returns pro-forma
-3.0% appreciation · 1.96% rent growth · sell at horizon
- IRR
- -3.9%
- Equity multiple
- 0.86×
- Total profit
- $-2,760
- Equity at exit
- $10,184
- IRR
- 4.2%
- Equity multiple
- 1.29×
- Total profit
- $5,544
- Equity at exit
- $5,905
Cash invested: $19,124 (down + closing). Projections, not guarantees.
Landlord ↔ Tenant lean methodology
- Overall (STATE)
- 87 Strongly Landlord-Friendly
- State Texas
- 87 Strongly Landlord-Friendly · R+5
- County
- — inherits STATE
- City
- — inherits STATE
ZIP-level market 75231
- Rents YoY
- 2.0%
- Active inventory
- 213
- Price-to-rent
- 4.8×
Monthly cashflow live
- Estimated rent
- $1,179 high interval (Pro) →
- Mortgage (P&I)
- −$358
- Tax from tax record
- −$158 /mo · $1,897/yr
- Insurance
- −$28
- HOA
- −$240
- Vacancy / Maint / Mgmt
- −$247
- Net cashflow
- $146
Break-even live
UW: 25.0% down · 7.5% · 30yr · 1.5% tax · 5.0% vac · 8.0% maint · 8.0% mgmt
Financing live
Cash to close
- Down payment
- $17,075
- Closing costs
- $2,049
- Reserves months
- —
- Total cash needed
- —
Loan-product check · same deal, 3 products live
Conventional
25% down · 7.5% · 30yr
- Down + closing
- —
- Monthly P&I
- —
- Monthly cashflow
- —
- DSCR
- —
- Eligible?
- —
Personal DTI + credit; lowest rate.
DSCR
20% down · 8.5% · 30yr
- Down + closing
- —
- Monthly P&I
- —
- Monthly cashflow
- —
- DSCR
- —
- Eligible?
- —
No personal income docs; deal must DSCR.
Hard money
10% down · 12.0% · 12mo
- Down + closing
- —
- Monthly P&I
- —
- Monthly cashflow
- —
- DSCR
- —
- Eligible?
- —
Short-term bridge; refi at stabilization.
Rent comps 40 comps
| Address | Beds | Baths | Sqft | Rent | $/sqft | DOM | Units | Dist |
|---|---|---|---|---|---|---|---|---|
| 6108 Abrams Rd Dallas, TX | 1.0–2.0 | 1.0–2.0 | 675 | $795 | $1.18 | 20d | 7 | 0.06mi |
| 6108 Abrams Rd Dallas, TX | 1.0–2.0 | 1.0–2.0 | 664 | $895 | $1.35 | 2d | 5 | 0.06mi |
| 6003 Abrams Rd Dallas, TX | 2.0 | 1.0–2.0 | 675 | $1,315 | $1.95 | 1d | 32 | 0.09mi |
| 6603 E Lovers Ln Dallas, TX | 2.0 | 1.0 | 620 | $1,017 | $1.64 | 1d | 5 | 0.31mi |
| 8910 Southwestern Blvd Dallas, TX | 1.0–3.0 | 1.0–2.0 | 974 | $1,472 | $1.51 | 1d | 30 | 0.51mi |
| 6466 Ridgecrest Rd Dallas, TX | 1.0 | 1.0 | 535 | $899 | $1.68 | 2d | 8 | 0.53mi |
| 6211 E Northwest Hwy Unit G417 Dallas, TX | 1.0 | 1.0 | 397 | $2,000 | $5.04 | 18d | 1 | 0.54mi |
| 6211 E Northwest Hwy Unit G224 Dallas, TX | 1.0 | 1.0 | 721 | $1,950 | $2.70 | 24d | 1 | 0.54mi |
| 6211 Northwest Hwy Unit G124 Dallas, TX | — | 1.0 | 390 | $1,400 | $3.59 | 43d | 1 | 0.54mi |
| 8616 Southwestern Blvd Dallas, TX | 1.0 | 1.0 | 733 | $1,950 | $2.66 | 18d | 1 | 0.63mi |
| 8616 Southwestern Blvd Dallas, TX | 1.0 | 1.0 | 733 | $1,950 | $2.66 | 43d | 1 | 0.63mi |
| 8612 Southwestern Blvd Unit 8627 Dallas, TX | 1.0 | 1.0 | 561 | $1,399 | $2.49 | 2d | 1 | 0.63mi |
| 8612 Southwestern Blvd Unit 8633 Dallas, TX | 1.0 | 1.0 | 561 | $1,321 | $2.35 | 13d | 1 | 0.63mi |
| 8780 Park Ln Dallas, TX | 2.0 | 1.0–2.0 | 642 | $1,277 | $1.99 | 3d | 56 | 0.63mi |
| 8705 Southwestern Blvd Unit 8720 Dallas, TX | 1.0 | 1.0 | 722 | $1,788 | $2.48 | 2d | 1 | 0.65mi |
| 8705 Southwestern Blvd Unit 8720 Dallas, TX | 1.0 | 1.0 | 722 | $1,992 | $2.76 | 14d | 1 | 0.65mi |
| 8705 Southwestern Blvd Unit 412 Dallas, TX | 1.0 | 1.0 | 722 | $1,780 | $2.47 | 12d | 1 | 0.65mi |
| 6760 Eastridge Dr Unit 102 Dallas, TX | 1.0 | 1.0 | 725 | $1,350 | $1.86 | 18d | 1 | 0.66mi |
| 6311 Melody Ln Dallas, TX | 1.0 | 1.0 | 653 | $915 | $1.40 | 43d | 1 | 0.70mi |
| 8612 Southwestern Blvd Dallas, TX | 1.0 | 1.0 | 561 | $1,316 | $2.35 | 13d | 1 | 0.70mi |
| 6262 Melody Ln Dallas, TX | 1.0–2.0 | 1.0–2.0 | 750 | $755 | $1.01 | 11d | 4 | 0.73mi |
| 6262 Melody Ln Dallas, TX | 2.0 | 1.0–2.0 | 750 | $1,037 | $1.38 | 2d | 4 | 0.73mi |
| 6262 Melody Ln Dallas, TX | 1.0–2.0 | 1.0–2.0 | 820 | $830 | $1.01 | 24d | 2 | 0.73mi |
| 6262 Melody Ln Dallas, TX | 1.0–2.0 | 1.0–2.0 | 865 | $850 | $0.98 | 11d | 3 | 0.73mi |
| 8611 Southwestern Blvd Unit 8626 Dallas, TX | 1.0 | 1.0 | 636 | $1,595 | $2.51 | 14d | 1 | 0.74mi |
| 8611 Southwestern Blvd Unit 412 Dallas, TX | 1.0 | 1.0 | 561 | $1,425 | $2.54 | 12d | 1 | 0.74mi |
| 8611 Southwestern Blvd Unit 8626 Dallas, TX | 1.0 | 1.0 | 561 | $1,433 | $2.55 | 2d | 1 | 0.74mi |
| 6251 Melody Ln Dallas, TX | 1.0–2.0 | 1.0–2.0 | 819 | $770 | $0.94 | 1d | 41 | 0.76mi |
| 7545 E Northwest Hwy Dallas, TX | 2.0 | 1.0–2.0 | 938 | $1,758 | $1.87 | 1d | 27 | 0.85mi |
| 8601 Park Ln #416 Dallas, TX | 1.0 | 1.0 | 618 | $1,400 | $2.27 | 24d | 1 | 0.86mi |
| 6121 Melody Ln Dallas, TX | 1.0 | 1.0 | 653 | $960 | $1.47 | 24d | 1 | 0.87mi |
| 6050 Ridgecrest Rd Dallas, TX | 2.0 | 1.0–2.0 | 732 | $1,045 | $1.43 | 2d | 14 | 0.89mi |
| 8601 Park Ln Dallas, TX | 1.0 | 1.0 | 618 | $1,350 | $2.18 | 43d | 2 | 0.89mi |
| 6808 Skillman St Dallas, TX | 1.0–3.0 | 1.0–2.0 | 968 | $1,163 | $1.20 | 2d | 21 | 0.91mi |
| 6041 Ridgecrest Rd Dallas, TX | 1.0 | 1.0 | 587 | $1,165 | $1.98 | 17d | 4 | 0.97mi |
| 6050 Melody Ln Dallas, TX | 1.0–2.0 | 1.0–2.0 | 930 | $773 | $0.83 | 1d | 9 | 0.98mi |
| 5605 Village Glen Dr Dallas, TX | 1.0–3.0 | 1.0–2.5 | 813 | $1,217 | $1.50 | 1d | 1 | 1.00mi |
| 6014 Ridgecrest Rd Dallas, TX | 1.0 | 1.0 | 734 | $975 | $1.33 | 43d | 1 | 1.02mi |
| 8510 Park Ln #201 Dallas, TX | 1.0 | 1.0 | 625 | $1,055 | $1.69 | 7d | 1 | 1.02mi |
| 8510 Park Ln #102 Dallas, TX | 1.0 | 1.0 | 700 | $1,195 | $1.71 | 10d | 1 | 1.02mi |
HOA detail condo
- Monthly dues
- $240 · $2,880/yr
- Likely covers
- electricpool
- Assessments
- None detected in remarks — confirm with the listing agent.
Listing history 20 events
-
2026-06-18days on market $68,300 Active 135 DOM
-
2026-06-17price $68,300 Active 134 DOM
-
2026-06-17days on market $74,200 Active 134 DOM
-
2026-06-16days on market $74,200 Active 133 DOM
-
2026-06-15days on market $74,200 Active 132 DOM
-
2026-06-13days on market $74,200 Active 130 DOM
-
2026-06-09days on market $74,200 Active 126 DOM
-
2026-06-08days on market $74,200 Active 125 DOM
-
2026-06-07days on market $74,200 Active 124 DOM
-
2026-06-04days on market $74,200 Active 121 DOM
-
2026-06-03days on market $74,200 Active 120 DOM
-
2026-06-02days on market $74,200 Active 119 DOM
-
2026-06-02days on market $74,200 Active 118 DOM
-
2026-05-31days on market $74,200 Active 117 DOM
-
2026-03-25price $74,200 1257-char remark
Show marketing remark (1257 chars)
Investor Portfolio Opportunity – 10+ Units Available Value-Add Potential Bulk Pricing Available Motivated seller offering a prime opportunity for investors to acquire multiple units in a high-demand Dallas location. Individual and bulk purchase options available. This second-floor 1-bedroom, 1-bath condo offers a functional and comfortable layout, featuring: Open kitchen with breakfast bar Refrigerator, washer, and dryer included Electric range and built-in microwave Brick fireplace Private patio with exterior storage Spacious bedroom with walk-in closet Community amenities include a pool and centralized mailboxes, adding convenience for residents and tenants. Located with easy access to Loop 12 and US-75, and just minutes from shopping, dining, and everyday essentials, this property is well-positioned for both rental demand and long-term value. Investment Highlights: Strong rental potential in a growing area Low-maintenance property ideal for buy-and-hold investors Opportunity to scale with multiple units Appealing layout for tenants and end-users Whether you're expanding your portfolio or purchasing your first investment, this is a strategic opportunity with upside potential. Schedule your tour today.
-
2026-01-25$79,200 Active 1257-char remark
Show marketing remark (1257 chars)
Investor Portfolio Opportunity – 10+ Units Available Value-Add Potential Bulk Pricing Available Motivated seller offering a prime opportunity for investors to acquire multiple units in a high-demand Dallas location. Individual and bulk purchase options available. This second-floor 1-bedroom, 1-bath condo offers a functional and comfortable layout, featuring: Open kitchen with breakfast bar Refrigerator, washer, and dryer included Electric range and built-in microwave Brick fireplace Private patio with exterior storage Spacious bedroom with walk-in closet Community amenities include a pool and centralized mailboxes, adding convenience for residents and tenants. Located with easy access to Loop 12 and US-75, and just minutes from shopping, dining, and everyday essentials, this property is well-positioned for both rental demand and long-term value. Investment Highlights: Strong rental potential in a growing area Low-maintenance property ideal for buy-and-hold investors Opportunity to scale with multiple units Appealing layout for tenants and end-users Whether you're expanding your portfolio or purchasing your first investment, this is a strategic opportunity with upside potential. Schedule your tour today.
-
2016-04-04soldstatus
-
2004-05-10soldstatus
-
1993-12-02soldstatus
-
1992-04-09soldstatus
ⓘ Source: listings_history table (triggers on properties + properties_extension) + one-shot
backfill from property_details.listing_events for pre-trigger history.
Tax reassessment forecast TX · Resets to sale price
- Current annual tax
- $1,897 · $158/mo
- Projected year-2 tax
- $1,897 · $158/mo
- Expected delta
- $0/yr ($0/mo · 0.0%)
ⓘ Screening estimate from a state-policy table — verify with the county assessor before closing.
Climate risk First Street
- Flood 1/10 Low FEMA zone X (unshaded) · 0% chance over 30 yrs
- Wildfire 2/10 Low
- Heat 7/10 Severe 7 d/yr ≥109°F today · 23 d/yr by 30 yrs out
- Wind 6/10 Major 27% chance of damaging wind over 30 yrs
- Air quality 3/10 Moderate 3 unhealthy d/yr today · 3 by 30 yrs out
Nearby sold comps map
Loading sold comps map…
Walkable amenities ~0.75 mi
Loading nearby amenities…
Taxation est. · year 1
- Rental income
- $14,143
- − Mortgage interest
- −$3,826
- − Property taxes
- −$1,897
- − Insurance
- −$342
- − Repairs & maintenance
- −$1,131
- − Management
- −$1,131
- − HOA
- −$2,880
- − Depreciation
- −$1,987
- Taxable income
- $948
- Est. tax owed @ 24.0%
- −$228
- After-tax cash flow
- $1,528/yr
For passive investors: Depreciation is non-cash, so a rental often shows a tax loss while cash-flowing — sheltering income. Rental losses are passive: they offset passive income freely, and up to $25,000/yr can offset ordinary (W-2) income if you actively participate and your MAGI is under $100k (phasing out to $0 by $150k); unused losses carry forward. On sale, claimed depreciation is recaptured at up to 25%, and gains may owe capital-gains tax (a 1031 exchange can defer both). Figures are a year-1 estimate at your 24.0% rate — not tax advice; consult a CPA.
Schools (NCES district)
- District
- Dallas ISD
- NCES district ID
- 4816230
- Math proficiency
- 31% ▼ -16.00%
- Reading proficiency
- 36% ▼ -4.00%
- Median HH income
- $42,881
- Composite
- 28.41/100
- National rank
- #6763
- State rank
- #559 of 826 in TX
Livability — Dallas
- Score
- 81/100
- State rank
- #24
- US rank
- #1380
Category grades
Schools grade is shown separately in the Schools card above.
Census & demographics
- Census place
- Dallas, TX
- County
- Dallas County · 2,612,404 people
- City population
- 1,168,437
- Metro
- Dallas-Fort Worth-Arlington, TX
- Population (ZIP)
- 38,370
- Household income
- $58,540
- Rent vs Own
- Severe rent burden
- 3482.0
Population outlook (Dallas County) Hauer SSP2
- Today (2025)
- 2,979,839 people
- By 2030
- 3,191,823 · +7.1%
- By 2040
- 3,619,611 · +21.5%
- By 2050
- 4,026,915 · +35.1%
- By 2075
- 4,957,073 · +66.4%
- By 2100
- 5,508,725 · +84.9%
Race, ethnicity, and origin ACS 2023
- Neighborhood character
- Highly diverse neighborhood (Simpson 0.74)
- Race & ethnicity
- Hispanic / Latino 33% White 29% Black 24% Two or more races 13% Asian 9%
- Hispanic origin (detail)
- Mexican 26%
- Common ancestry
- Slovak 1% Lithuanian 1% Romanian 1%
- Foreign-born
- 29% · Canada, Philippines, India
- Languages at home
- 57% English-only · Spanish 27% Other Asian/Pacific 4% Other Indo-European 3%
Political lean MEDSL · Dallas
- 2024 margin
- Strong D (+22.2) · D 60.2% · R 38.0% · Other 1.8%
- 2008→2024 swing
- +6.9pp toward D · 2008: 15.3pp · 2024: 22.2pp
- All cycles
- 2024: D+22.2 2020: D+31.6 2016: D+26.2 2012: D+15.4 2008: D+15.3
Not yet ingested
- Civics
- —
Market trends
- HPI YoY
- ▼ -359.41%
- Current HPI
- 249.5841
- Rent YoY
- ▲ 1.96%
- Metro
- Dallas-Fort Worth-Arlington, TX
- State GDP YoY
- ▲ 3.95%
- F500 in state
- 110
Industry mix (Fortune 500 HQ in TX)
| Industry | F500 HQs | Revenue |
|---|---|---|
| Energy | 16 | $1,198B |
|
||
| Technology | 5 | $198B |
|
||
| Engineering / Construction | 4 | $72B |
|
||
| Energy Services | 3 | $60B |
|
||
| Utilities | 3 | $41B |
|
||
| Healthcare | 2 | $330B |
|
||
Price history
-6.3% since first listed6 events — show timeline
- 2026-03-25 Price Changed $74,200 NTREIS
- 2026-01-25 Listed $79,200 NTREIS
- 2016-04-04 Sold (Public Records) — Public Records
- 2004-05-10 Sold (Public Records) — Public Records
- 1993-12-02 Sold (Public Records) — Public Records
- 1992-04-09 Sold (Public Records) — Public Records
Property tax history
+7.6%/yrLatest (2025): $1,897 · -11.9% YoY. Source: county tax records.
Cash-flow waterfall
monthlySold comps — $/sqft
last 12 mo · ≤1 miLoading sold comps…