 Duplex
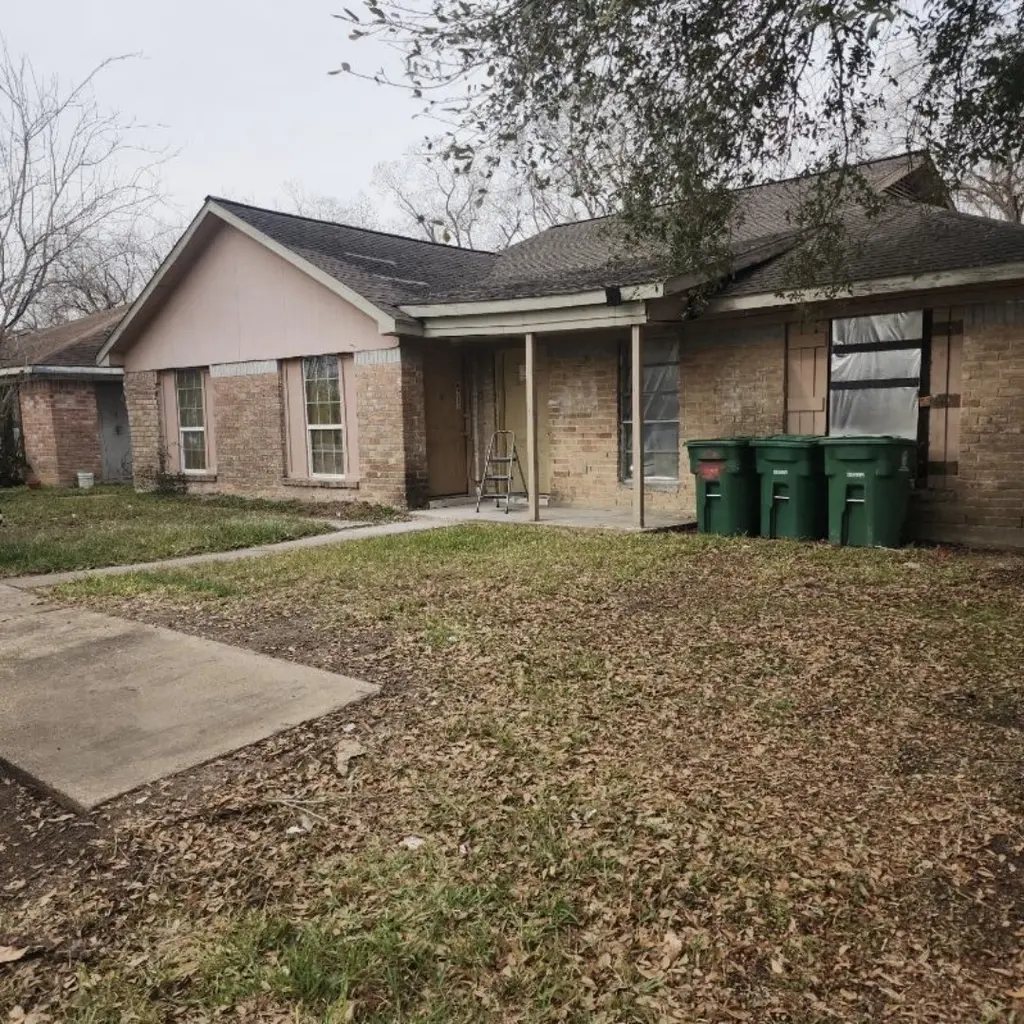
6714 W Fuqua St · Houston, TX
Flood risk 3/10 · Minor
- FEMA flood zone
- X (unshaded)
- Chance of flooding over 30 yrs
- 0.1%
- Est. flood insurance / yr
- $507 – $1,088
Fire risk 3/10 · Minor
- Est. fire insurance / yr
- $1,222 – $2,270
Heat risk 9/10 · Severe
- Hot days now (above 110°F)
- 7 days/yr
- Hot days in 30 yrs
- 23 days/yr
Wind risk 9/10 · Severe
- Chance of severe wind over 30 yrs
- 99.0%
Air-quality risk 3/10 · Minor
- Unhealthy air days now
- 2 days/yr
- Unhealthy air days in 30 yrs
- 3 days/yr
Risk factors via First Street. Map © Google.
Why this score? — see what drove the A- grade
The composite is a weighted blend of 9 inputs, each scored 0–100. Each bar is that input's sub-score; the figure is the points it added to the 100-point composite (weight × sub-score).
- Cash flow +30.0/30.0
- ARV discount +15.0/15.0
- 1% rule +10.0/10.0
- DSCR +10.0/10.0
- Appreciation +4.7/10.0
- Schools +4.5/10.0
- Livability +3.7/5.0
- Rent growth +2.6/5.0
- Condition / age +2.5/5.0
$170,000
🖨 Deal sheet (PDF) 📄 Offer letter ✓ Due diligence
Multi-family units
County records classify this as Multi-Family (2-4 Unit). Listing-text estimate: 2 units. confirmed
Listing remarks MLS
This Duplex has an updated foundation with lifetime warranty on the repairs done, pipes were cleaned and serviced, countertops on the side in one unit, and ac was recently serviced. OCCUPIED WITH TENANTS,. I WILL GET YOU IN TO SEE THE PROPERTY BEFORE OPTION OR EARNEST MONEY IS REQUIRED. The property is occupied & owner can show one side but both side are identical. #6716 PAYS $900 MONTHLY (potential for higher) & LEASE EXPIRES 11/30/2021. PLEASE E-MAIL ME FOR CONTRACT INFORMATION.
Key facts
- 7,375 sq ft lot
- Built 1972
- Listed 38 days
Property features AI
Finance
- HOA & community: Managed by Om Property Management; Association fee $200 annually
Exterior
- Utilities: Electricity available; Water available
- Home design: Residential income property; Built in 1972
- Construction: Composition roof
- Exterior features: Lot approximately 7,375 square feet
Interior
- Kitchen: Dishwasher; Disposal; Microwave
- Bedrooms: Two bedrooms in each of the two units (2 bedrooms per unit)
- Flooring: Tile flooring
- Bathrooms: Two full bathrooms (total)
- Heating & cooling: Central heating (electric); Central air (electric)
- Interior features: Tile counters
Neighborhood map
What this means for you Summary
Snapshot
- This is a 2 × 2-bed/2.0-bath units multifamily listed at $170k.
Deal economics
- At list price, monthly cash flow is $1k ($17k/yr) — positive. Per door: $720/mo.
- The deal already cash-flows at list — no discount required.
- Meets the 1% rule at list price ($3k rent vs $170k).
- Recommended offer: $165k (3.0% below list) — sets the bar for market timing.
- Cap rate 16.5% vs local median 3.1% in Houston — top-decile yield for the area; either an underpriced asset or a hidden risk that comps aren't pricing in. Stress-test before assuming the spread holds.
Location & tenants
- Location reads 74/100 on livability (#184 in TX, #4,771 nationally) — a middle-class / working-renter tenant base. Strengths: amenities A+, cost of living A+, housing A+; Watch: crime F.
- Fort Bend ISD (suburban): math 44% / reading 53% proficiency, ranked #140 of 826 in TX (top 17%) — families likely to look elsewhere, expect single-tenant / working-renter base with shorter leases.
- Zoned schools: Blue Ridge El (math 8% / reading 17%, grade F, #4,180 of 4,322 statewide, top 97%, 263 students, 89% FRL); Christa Mcauliffe Middle (math 9% / reading 20%, grade F, #1,583 of 1,662 statewide, top 96%, 835 students, 94% FRL); Fort Bend Co Alter (26 students, 0% FRL) — zoned schools average 61% FRL vs 35% district-wide (26 pts higher); higher-poverty schools than district average — tighter screening recommended.
- Zoned-school proficiency averages 13% at this address vs 48% district-wide (-35 pts) — the specific schools serving this property underperform the Fort Bend ISD average; the district grade overstates school quality for this exact location.
- Market conditions: Rents flat; 188 active listings in the ZIP; 12,093 units permitted in Fort Bend County in 2024 (815 in 5+ unit buildings).
- At $3,413/mo this rent would consume 55% of the median local household income ($75k/yr) (locally 1121% of renters already pay >50% of income on rent) — very limited rent-growth headroom before tenants either downsize or default.
Forward outlook
- In year one you build about $238 of equity ($1k loan paydown + $-937 appreciation (-0.6% local appreciation)).
- Fort Bend County population projected at +75% by 2050 — long-run rental-demand tailwind backs the buy-and-hold thesis.
- At projected returns (-0.6% appreciation + 0.3% rent growth), your $48k cash investment doubles in ~3 years — after that, you're playing with house money.
Negotiation context
- It's been on market 39 days — a 3% lower offer ($165k) is reasonable based on typical stale-listing flexibility.
- 5 sale attempts since 7y ago with the ask held roughly flat each time — persistent listings suggest the price (not the market) is what's stuck; bring a comps-based counter.
Risks & watch-outs
- Climate carrying-cost: severe wind risk, 99% chance of damaging wind over 30y; extreme-heat days projected 7→23/yr by 2055 (HVAC capex compounding) — expect insurance premiums to compound above CPI over the hold.
Questions for the listing agent
- It's been on market 39 days. Have you received any prior offers? Is the seller open to a 3% concession, seller financing, or rate buy-down credit?
- Can we see the unit-by-unit rent roll, current vacancy, and any below-market leases? What's the average tenancy length?
- What capital expenditures (roof, boiler, parking lot, exteriors) have been made in the last 5 years, and what's planned in the next 2?
- Built in 1972 — when were the roof, HVAC, electrical panel, plumbing, and water heater last replaced?
- What does the HOA fee cover, when was the last increase, and are there any pending special assessments or reserve-fund shortfalls?
- Is there a deadline driving the sale (1031 exchange, divorce, estate, relocation)? That informs how much negotiation room exists.
- Schools are D-rated, which usually means shorter tenancies and higher turnover. Who's the typical renter profile here, and what's been the actual vacancy rate?
- Crime grade is F in this area — have there been break-ins, vandalism, or insurance claims at this property in the last 3 years? What carrier currently insures it and at what premium?
- What's the average days-on-market for RENTAL listings here right now (not sales)? A rising rental-DOM trend means longer vacancies and softer asking-rent achievability than the comps imply.
- What's the recent tenant-quality profile in this submarket — average credit score on applications, eviction rate, late-payment / NSF rate, and stable-employment percentage? A property-management company in the area should have these aggregated.
- How much new apartment / multifamily construction is in the pipeline within 1–3 miles? Heavy new supply (>2% of stock underway) typically softens rents 12–24 months out; light construction supports rent growth.
Investment metrics
- 1% rule
- 2.01% ✓
- Cap rate
- 16.45%
- Cash-on-cash
- 36.29%
- DSCR
- 2.61
- GRM
- 4.2
CMA / ARV
- ARV (median comp)
- $204,216
- List price
- $170,000
- Delta
- -16.75%
- Verdict
- UNDERPRICED
- Comps
- 9 within 1.0 mi
Show comp detail 1 sale within ~0.75 mi
| Address | Dist | Beds/Ba | Sqft | Sold | Price | $/sf | Match |
|---|---|---|---|---|---|---|---|
| 6824 W Fuqua Dr | 0.13mi | 6/4.0 | 2,500 (0%) | 19mo | $210,000 | $84 | 78 |
Match score weights: distance 35% · size 25% · config 20% · recency 20%. Top-matched comps best support the ARV.
Projected returns pro-forma
-0.55% appreciation · 0.34% rent growth · sell at horizon
- IRR
- 33.5%
- Equity multiple
- 2.55×
- Total profit
- $73,561
- Equity at exit
- $44,730
- IRR
- 36.0%
- Equity multiple
- 4.48×
- Total profit
- $165,412
- Equity at exit
- $50,197
Cash invested: $47,600 (down + closing). Projections, not guarantees.
Landlord ↔ Tenant lean methodology
- Overall (STATE)
- 87 Strongly Landlord-Friendly
- State Texas
- 87 Strongly Landlord-Friendly · R+5
- County
- — inherits STATE
- City
- — inherits STATE
ZIP-level market 77489
- Home prices YoY
- -0.2%
- Rents YoY
- 0.3%
- Active inventory
- 188
- Price-to-rent
- 8.3×
Monthly cashflow live
- Estimated rent
- $3,413 high interval (Pro) →
- Mortgage (P&I)
- −$891
- Tax from tax record
- −$277 /mo · $3,329/yr
- Insurance
- −$71
- HOA
- −$17
- Vacancy / Maint / Mgmt
- −$717
- Net cashflow
- $1,440
Break-even live
Sensitivity live
| Price | -10% $1,536 | -5% $1,488 | +0% $1,440 | +5% $1,391 | +10% $1,343 |
|---|---|---|---|---|---|
| Rent | -10% $1,170 | -5% $1,305 | +0% $1,440 | +5% $1,574 | +10% $1,709 |
| Rate | -1.0pp $1,525 | -0.5pp $1,483 | base $1,440 | +0.5pp $1,395 | +1.0pp $1,351 |
2-unit breakdown (identical units grouped — click to expand)
| Units | Beds | Baths | Est. rent |
|---|---|---|---|
| 2× units | 2 | 2 | $3,412 |
| #1 | 2 | 2 | $1,706 |
| #2 | 2 | 2 | $1,706 |
| Total (2 units) | $3,413 | ||
UW: 25.0% down · 7.5% · 30yr · 1.5% tax · 5.0% vac · 8.0% maint · 8.0% mgmt
Financing live
Cash to close
- Down payment
- $42,500
- Closing costs
- $5,100
- Reserves months
- —
- Total cash needed
- —
Loan-product check · same deal, 3 products live
Conventional
25% down · 7.5% · 30yr
- Down + closing
- —
- Monthly P&I
- —
- Monthly cashflow
- —
- DSCR
- —
- Eligible?
- —
Personal DTI + credit; lowest rate.
DSCR
20% down · 8.5% · 30yr
- Down + closing
- —
- Monthly P&I
- —
- Monthly cashflow
- —
- DSCR
- —
- Eligible?
- —
No personal income docs; deal must DSCR.
Hard money
10% down · 12.0% · 12mo
- Down + closing
- —
- Monthly P&I
- —
- Monthly cashflow
- —
- DSCR
- —
- Eligible?
- —
Short-term bridge; refi at stabilization.
HOA detail
- Monthly dues
- $17 · $204/yr
Listing history 32 events
-
2026-06-21days on market $170,000 Active 39 DOM
-
2026-06-18days on market $170,000 Active 36 DOM
-
2026-06-17pricedays on market $170,000 Active 35 DOM
-
2026-06-16days on market $175,000 Active 34 DOM
-
2026-06-15days on market $175,000 Active 33 DOM
-
2026-06-13days on market $175,000 Active 31 DOM
-
2026-06-09days on market $175,000 Active 27 DOM
-
2026-06-08days on market $175,000 Active 26 DOM
-
2026-06-07days on market $175,000 Active 25 DOM
-
2026-06-04days on market $175,000 Active 22 DOM
-
2026-06-03days on market $175,000 Active 21 DOM
-
2026-06-02days on market $175,000 Active 20 DOM
-
2026-06-01days on market $175,000 Active 19 DOM
-
2026-05-31days on market $175,000 Active 18 DOM
-
2026-05-13$175,000 Active 265-char remark
-
2025-08-09historical $1,250
-
2025-06-02$1,250
-
2025-06-01historical $1,200
-
2025-04-15price $1,200
-
2024-11-02$1,250
-
2021-07-30soldstatus
-
2021-07-29soldstatus Sold 495-char remark
Show marketing remark (495 chars)
This Duplex has an updated foundation with lifetime warranty on the repairs done, pipes were cleaned and serviced, countertops on the side in one unit, and ac was recently serviced. OCCUPIED WITH TENANTS,. I WILL GET YOU IN TO SEE THE PROPERTY BEFORE OPTION OR EARNEST MONEY IS REQUIRED. The property is occupied & owner can show one side but both side are identical. #6716 PAYS $900 MONTHLY (potential for higher) & LEASE EXPIRES 11/30/2021. PLEASE E-MAIL ME FOR CONTRACT INFORMATION.
-
2021-06-14status Pending, Continue to Show 495-char remark
Show marketing remark (495 chars)
This Duplex has an updated foundation with lifetime warranty on the repairs done, pipes were cleaned and serviced, countertops on the side in one unit, and ac was recently serviced. OCCUPIED WITH TENANTS,. I WILL GET YOU IN TO SEE THE PROPERTY BEFORE OPTION OR EARNEST MONEY IS REQUIRED. The property is occupied & owner can show one side but both side are identical. #6716 PAYS $900 MONTHLY (potential for higher) & LEASE EXPIRES 11/30/2021. PLEASE E-MAIL ME FOR CONTRACT INFORMATION.
-
2021-06-01price $214,900 495-char remark
Show marketing remark (495 chars)
This Duplex has an updated foundation with lifetime warranty on the repairs done, pipes were cleaned and serviced, countertops on the side in one unit, and ac was recently serviced. OCCUPIED WITH TENANTS,. I WILL GET YOU IN TO SEE THE PROPERTY BEFORE OPTION OR EARNEST MONEY IS REQUIRED. The property is occupied & owner can show one side but both side are identical. #6716 PAYS $900 MONTHLY (potential for higher) & LEASE EXPIRES 11/30/2021. PLEASE E-MAIL ME FOR CONTRACT INFORMATION.
-
2021-04-17price $219,900 495-char remark
Show marketing remark (495 chars)
This Duplex has an updated foundation with lifetime warranty on the repairs done, pipes were cleaned and serviced, countertops on the side in one unit, and ac was recently serviced. OCCUPIED WITH TENANTS,. I WILL GET YOU IN TO SEE THE PROPERTY BEFORE OPTION OR EARNEST MONEY IS REQUIRED. The property is occupied & owner can show one side but both side are identical. #6716 PAYS $900 MONTHLY (potential for higher) & LEASE EXPIRES 11/30/2021. PLEASE E-MAIL ME FOR CONTRACT INFORMATION.
-
2021-04-07$225,000 Active 495-char remark
Show marketing remark (495 chars)
This Duplex has an updated foundation with lifetime warranty on the repairs done, pipes were cleaned and serviced, countertops on the side in one unit, and ac was recently serviced. OCCUPIED WITH TENANTS,. I WILL GET YOU IN TO SEE THE PROPERTY BEFORE OPTION OR EARNEST MONEY IS REQUIRED. The property is occupied & owner can show one side but both side are identical. #6716 PAYS $900 MONTHLY (potential for higher) & LEASE EXPIRES 11/30/2021. PLEASE E-MAIL ME FOR CONTRACT INFORMATION.
-
2019-11-19soldstatus
-
2019-11-15soldstatus Sold
Show marketing remark (337 chars)
BOTH SIDES ARE 2 BEDROOM & 2 FULL BATHS. CANNOT SHOW OCCUPIED PROPERTIES WITHOUT ACCEPTED CONTRACT. PROPERTIES CURRENTLY LEASED. DO NOT WALK PROPERTY OR KNOCK ON DOOR WITHOUT APPOINTMENT. THE TENANT PAYS UNIT#6714 $VACANT MONTHLY & THE TENANT UNIT #6716 PAYS $900 MONTHLY. * * * 9 DUPLEXES TOTAL BY THE SAME OWNER * * *
-
2019-09-22status Pending
Show marketing remark (337 chars)
BOTH SIDES ARE 2 BEDROOM & 2 FULL BATHS. CANNOT SHOW OCCUPIED PROPERTIES WITHOUT ACCEPTED CONTRACT. PROPERTIES CURRENTLY LEASED. DO NOT WALK PROPERTY OR KNOCK ON DOOR WITHOUT APPOINTMENT. THE TENANT PAYS UNIT#6714 $VACANT MONTHLY & THE TENANT UNIT #6716 PAYS $900 MONTHLY. * * * 9 DUPLEXES TOTAL BY THE SAME OWNER * * *
-
2019-09-12status Option Pending
Show marketing remark (337 chars)
BOTH SIDES ARE 2 BEDROOM & 2 FULL BATHS. CANNOT SHOW OCCUPIED PROPERTIES WITHOUT ACCEPTED CONTRACT. PROPERTIES CURRENTLY LEASED. DO NOT WALK PROPERTY OR KNOCK ON DOOR WITHOUT APPOINTMENT. THE TENANT PAYS UNIT#6714 $VACANT MONTHLY & THE TENANT UNIT #6716 PAYS $900 MONTHLY. * * * 9 DUPLEXES TOTAL BY THE SAME OWNER * * *
-
2019-09-04$190,900 Active
Show marketing remark (337 chars)
BOTH SIDES ARE 2 BEDROOM & 2 FULL BATHS. CANNOT SHOW OCCUPIED PROPERTIES WITHOUT ACCEPTED CONTRACT. PROPERTIES CURRENTLY LEASED. DO NOT WALK PROPERTY OR KNOCK ON DOOR WITHOUT APPOINTMENT. THE TENANT PAYS UNIT#6714 $VACANT MONTHLY & THE TENANT UNIT #6716 PAYS $900 MONTHLY. * * * 9 DUPLEXES TOTAL BY THE SAME OWNER * * *
-
2014-03-31soldstatus
ⓘ Source: listings_history table (triggers on properties + properties_extension) + one-shot
backfill from property_details.listing_events for pre-trigger history.
Tax reassessment forecast TX · Resets to sale price
- Current annual tax
- $3,329 · $277/mo
- Projected year-2 tax
- $3,329 · $277/mo
- Expected delta
- $0/yr ($0/mo · 0.0%)
ⓘ Screening estimate from a state-policy table — verify with the county assessor before closing.
Climate risk First Street
- Flood 3/10 Moderate FEMA zone X (unshaded) · 10% chance over 30 yrs
- Wildfire 3/10 Moderate
- Heat 9/10 Extreme 7 d/yr ≥110°F today · 23 d/yr by 30 yrs out
- Wind 9/10 Extreme 99% chance of damaging wind over 30 yrs
- Air quality 3/10 Moderate 2 unhealthy d/yr today · 3 by 30 yrs out
Nearby sold comps map
Loading sold comps map…
Walkable amenities ~0.75 mi
Loading nearby amenities…
Taxation est. · year 1
- Rental income
- $40,956
- − Mortgage interest
- −$9,523
- − Property taxes
- −$3,329
- − Insurance
- −$850
- − Repairs & maintenance
- −$3,276
- − Management
- −$3,276
- − HOA
- −$204
- − Depreciation
- −$4,945
- Taxable income
- $15,552
- Est. tax owed @ 24.0%
- −$3,733
- After-tax cash flow
- $13,542/yr
For passive investors: Depreciation is non-cash, so a rental often shows a tax loss while cash-flowing — sheltering income. Rental losses are passive: they offset passive income freely, and up to $25,000/yr can offset ordinary (W-2) income if you actively participate and your MAGI is under $100k (phasing out to $0 by $150k); unused losses carry forward. On sale, claimed depreciation is recaptured at up to 25%, and gains may owe capital-gains tax (a 1031 exchange can defer both). Figures are a year-1 estimate at your 24.0% rate — not tax advice; consult a CPA.
Schools (NCES district)
- District
- Fort Bend ISD
- NCES district ID
- 4819650
- Math proficiency
- 44% ▼ -15.00%
- Reading proficiency
- 53% ▼ -4.00%
- Median HH income
- $82,360
- Composite
- 44.61/100
- National rank
- #2779
- State rank
- #140 of 826 in TX
Livability — Houston
- Score
- 74/100
- State rank
- #184
- US rank
- #4771
Category grades
Schools grade is shown separately in the Schools card above.
Census & demographics
- Census place
- Houston, TX
- County
- Fort Bend County · 836,777 people
- City population
- 3,226,434
- Metro
- Houston-The Woodlands-Sugar Land, TX
- Population (ZIP)
- 39,292
- Household income
- $74,689
- Rent vs Own
- Severe rent burden
- 1121.0
Population outlook (Fort Bend County) Hauer SSP2
- Today (2025)
- 1,004,526 people
- By 2030
- 1,153,104 · +14.8%
- By 2040
- 1,453,718 · +44.7%
- By 2050
- 1,753,781 · +74.6%
- By 2075
- 2,455,772 · +144.5%
- By 2100
- 2,930,528 · +191.7%
Race, ethnicity, and origin ACS 2023
- Neighborhood character
- Majority Black (60%)
- Race & ethnicity
- Black 60% Hispanic / Latino 29% Two or more races 13% White 4% Asian 3%
- Hispanic origin (detail)
- Mexican 17%
- Foreign-born
- 16% · Canada, Vietnam
- Languages at home
- 73% English-only · Spanish 22% Vietnamese 1% Other Asian/Pacific 1%
Political lean MEDSL · Fort Bend
- 2024 margin
- Toss-up / Even · D 49.5% · R 47.9% · Other 2.6%
- 2008→2024 swing
- +4.0pp toward D · 2008: -2.4pp · 2024: 1.6pp
- All cycles
- 2024: D+1.6 2020: D+10.6 2016: D+6.6 2012: R+6.8 2008: R+2.4
Not yet ingested
- Civics
- —
Market trends
- HPI YoY
- ▼ -0.55%
- Current HPI
- 288.1306
- Rent YoY
- ▲ 0.34%
- Metro
- Houston-The Woodlands-Sugar Land, TX
- State GDP YoY
- ▲ 3.95%
- F500 in state
- 110
Industry mix (Fortune 500 HQ in TX)
| Industry | F500 HQs | Revenue |
|---|---|---|
| Energy | 16 | $1,198B |
|
||
| Technology | 5 | $198B |
|
||
| Engineering / Construction | 4 | $72B |
|
||
| Energy Services | 3 | $60B |
|
||
| Utilities | 3 | $41B |
|
||
| Healthcare | 2 | $330B |
|
||
Price history
-10.9% since first listed19 events — show timeline
- 2026-06-16 Price Changed $170,000 HARMLS
- 2026-05-13 Listed $175,000 HARMLS
- 2025-08-09 Rental Removed $1,250 TENANTTURNER2
- 2025-06-02 Listed for Rent $1,250 TENANTTURNER2
- 2025-06-01 Rental Removed $1,200 HARMLS
- 2025-04-15 Price Changed $1,200 HARMLS
- 2024-11-02 Listed for Rent $1,250 HARMLS
- 2021-07-30 Sold (Public Records) — Public Records
- 2021-07-29 Sold (MLS) — HARMLS
- 2021-06-14 Pending — HARMLS
- 2021-06-01 Price Changed $214,900 HARMLS
- 2021-04-17 Price Changed $219,900 HARMLS
- 2021-04-07 Listed $225,000 HARMLS
- 2019-11-19 Sold (Public Records) — Public Records
- 2019-11-15 Sold (MLS) — HARMLS
- 2019-09-22 Pending — HARMLS
- 2019-09-12 Pending — HARMLS
- 2019-09-04 Listed $190,900 HARMLS
- 2014-03-31 Sold (Public Records) — Public Records
Property tax history
+3.0%/yrLatest (2025): $3,329 · -6.7% YoY. Source: county tax records.
Cash-flow waterfall
monthlySold comps — $/sqft
last 12 mo · ≤1 miLoading sold comps…