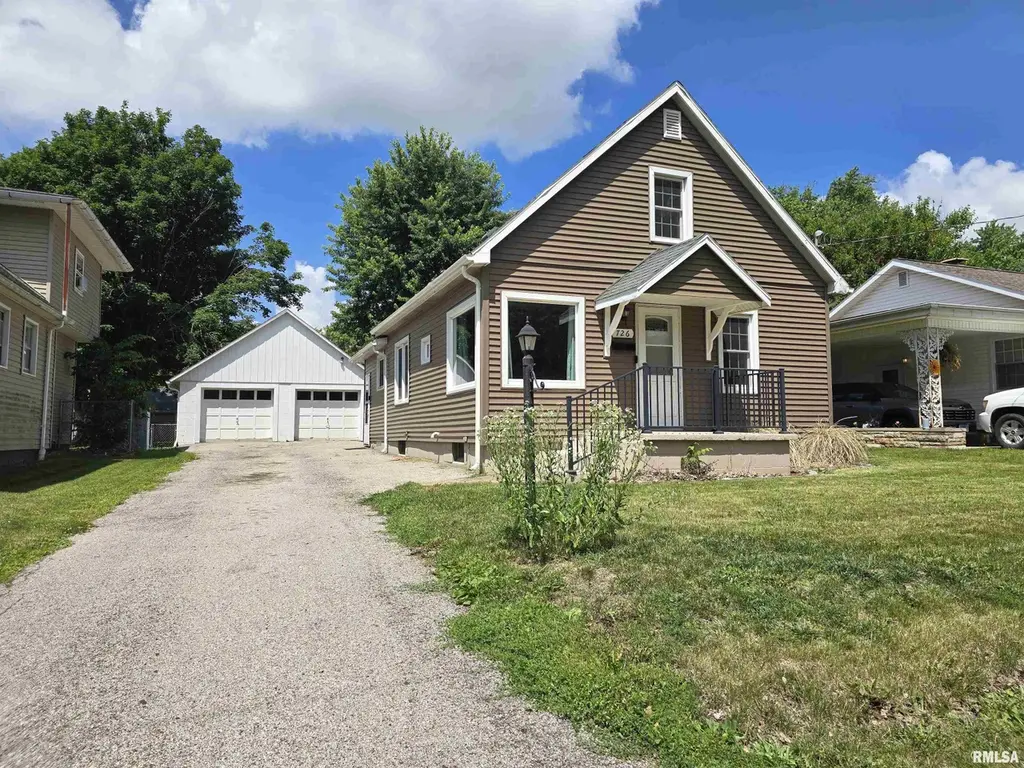
726 N 7th Ave · Canton, IL
Flood risk 1/10 · Minimal
- FEMA flood zone
- X (unshaded)
- Chance of flooding over 30 yrs
- 0.0%
- Est. flood insurance / yr
- $473 – $860
Fire risk 1/10 · Minimal
- Est. fire insurance / yr
- $804 – $1,492
Heat risk 3/10 · Minor
- Hot days now (above 105°F)
- 7 days/yr
- Hot days in 30 yrs
- 18 days/yr
Wind risk 2/10 · Minimal
- Chance of severe wind over 30 yrs
- 1.0%
Air-quality risk 2/10 · Minimal
- Unhealthy air days now
- 1 days/yr
- Unhealthy air days in 30 yrs
- 2 days/yr
Risk factors via First Street. Map © Google.
Why this score? — see what drove the D grade
The composite is a weighted blend of 9 inputs, each scored 0–100. Each bar is that input's sub-score; the figure is the points it added to the 100-point composite (weight × sub-score).
- Cash flow +14.1/30.0
- ARV discount +7.5/15.0
- DSCR +4.3/10.0
- 1% rule +4.1/10.0
- Livability +3.6/5.0
- Rent growth +2.5/5.0
- Condition / age +2.5/5.0
- Schools +1.8/10.0
- Appreciation +0.0/10.0
$115,000
🖨 Deal sheet (PDF) 📄 Offer letter ✓ Due diligence
Listing remarks MLS
This gorgeous home has been totally renovated and is move in ready! Living room and Dining room are open concept, Eat in kitchen has lots of storage and cute built in cabinetry. Primary bedroom is upstairs, and seller runs additional AC window to keep upstairs very cool for preference. There are wonderful windows for lots of natural light, a two car garage with loft above it, fenced big yard and cute patio for entertaining. 2nd bedroom is on main level. Appliances stay but not warranted.
Key facts
- Built in cupboards
- Open concept
- Updated furnace
Tags
Property features AI
Finance
- HOA & community: No association fee
Exterior
- Parking: Detached oversized 2-car garage
- Utilities: Public water; Public sewer
- Home design: Single family residence; Shingle roof
- Construction: Built in 1900; Has a basement (crawl space, full, unfinished)
- Exterior features: Fenced yard; Level lot; Paved road access
Interior
- Kitchen: Refrigerator; Microwave
- Bedrooms: 2 bedrooms (one on the upper level, one on the main level)
- Flooring: Carpet in at least one bedroom; Laminate in living, dining and kitchen areas
- Bathrooms: 1 full bathroom
- Heating & cooling: Central air conditioning; Forced air heating; Window unit(s)
- Interior features: Ceiling fans; Cable available
- Laundry & utility: Washer; Dryer; Gas water heater
Neighborhood map
What this means for you Summary
Snapshot
- This is a 2-bed/1.0-bath single-family listed at $115k.
Deal economics
- At list price, monthly cash flow is $16 ($191/yr) — positive.
- The deal already cash-flows at list — no discount required.
- To meet the 1% rule (rent ≥ 1% of price), the offer needs to be $105k (8.9% below list).
- Recommended offer: $105k (8.9% below list) — sets the bar for 1% rule.
Location & tenants
- Location reads 72/100 on livability (#318 in IL) — a middle-class / working-renter tenant base. Strengths: cost of living A+, housing A+, health & safety A+; Watch: crime C-, amenities F, commute F.
- Canton Union SD 66 (town): math 19% / reading 23% proficiency, ranked #417 of 620 in IL (top 67%) — low school quality limits family demand, transient renter base, plan for 1-2y turnover.
- Zoned schools: Eastview Elementary School (math 22% / reading 22%, grade F, #940 of 2,056 statewide, top 49%, 265 students, 0% FRL); Ingersoll Middle School (math 18% / reading 24%, grade F, #405 of 665 statewide, top 61%, 645 students, 0% FRL); Canton High School (math 22% / reading 27%, grade F, #256 of 693 statewide, top 44%, 641 students, 0% FRL) — zoned schools average 0% FRL vs 46% district-wide (46 pts lower); this property's tenant base skews higher-income than the district average.
- Market conditions: 108 active listings in the ZIP; 2 comparable units currently listed for rent nearby; 14 units permitted in Fulton County in 2024 (0 in 5+ unit buildings).
Forward outlook
- Local home prices are declining (-3.0%/yr); year-one equity from $795 of loan paydown is wiped out by about $3k of value loss. Plan a longer hold.
- Fulton County population projected at -20% by 2050 — secular population decline; favor cash flow + early exit over multi-decade hold.
Negotiation context
- Only 8 days on market — expect competitive offers; lowballing is unlikely to land.
- 4 sale attempts since 24y ago with the ask held roughly flat each time — persistent listings suggest the price (not the market) is what's stuck; bring a comps-based counter.
- Current owner paid $95k; 21% above their basis — modest negotiation headroom, anchor on the comps not their cost.
Risks & watch-outs
- Watch-outs: built in 1900 — expect roof / HVAC / electrical / plumbing capex.
Questions for the listing agent
- Built in 1900 — when were the roof, HVAC, electrical panel, plumbing, and water heater last replaced?
- Is there a deadline driving the sale (1031 exchange, divorce, estate, relocation)? That informs how much negotiation room exists.
- Schools are F-rated, which usually means shorter tenancies and higher turnover. Who's the typical renter profile here, and what's been the actual vacancy rate?
- The area grade is low — what's the realistic commute time and amenity access for the typical tenant pool here? Any planned neighborhood developments (good or bad) we should know about?
- What's the average days-on-market for RENTAL listings here right now (not sales)? A rising rental-DOM trend means longer vacancies and softer asking-rent achievability than the comps imply.
- What's the recent tenant-quality profile in this submarket — average credit score on applications, eviction rate, late-payment / NSF rate, and stable-employment percentage? A property-management company in the area should have these aggregated.
- How much new for-sale + rental construction is in the pipeline within 1–3 miles? Heavy new supply typically softens prices + rents 12–24 months out; constrained supply supports both.
Investment metrics
- 1% rule
- 0.91% ✗
- Cap rate
- 6.46%
- Cash-on-cash
- 0.59%
- DSCR
- 1.03
- GRM
- 9.1
CMA / ARV
- ARV (on-the-fly)
- $70,224
- Comps found
- 12
Show comp detail 12 sales within ~0.75 mi
| Address | Dist | Beds/Ba | Sqft | Sold | Price | $/sf | Match |
|---|---|---|---|---|---|---|---|
| 660 N 9th Ave | 0.14mi | 2/1.0 | 800 (-4%) | 2mo | $83,000 | $104 | 85 |
| 714 E Ash St | 0.29mi | 2/1.0 | 825 (-1%) | 1mo | $84,000 | $102 | 84 |
| 476 Baxter Ct | 0.27mi | 2/1.0 | 792 (-5%) | 6mo | $45,000 | $57 | 74 |
| 320 N 5th Ave | 0.35mi | 2/1.0 | 809 (-3%) | 10mo | $52,500 | $65 | 70 |
| 335 Iris Ct | 0.48mi | 3/1.0 (+1) | 864 (+3%) | 3mo | $110,000 | $127 | 65 |
| 1140 E Myrtle St | 0.35mi | 2/1.0 | 744 (-11%) | 3mo | $87,500 | $118 | 63 |
| 62 N 5th Ave | 0.57mi | 2/1.0 | 798 (-4%) | 6mo | $67,000 | $84 | 61 |
| 737 N 5th Ave | 0.12mi | 1/1.0 (-1) | 712 (-15%) | 7mo | $57,500 | $81 | 59 |
| 36 E Olive St | 0.52mi | 1/1.0 (-1) | 906 (+8%) | 2mo | $69,900 | $77 | 54 |
| 904 E Elm St | 0.65mi | 2/1.0 | 896 (+7%) | 11mo | $59,900 | $67 | 48 |
| 906 E Locust St | 0.48mi | 2/1.0 | 960 (+15%) | 7mo | $43,500 | $45 | 47 |
| 840 Ravine Ct | 0.70mi | 2/1.0 | 955 (+14%) | 5mo | $120,000 | $126 | 39 |
Match score weights: distance 35% · size 25% · config 20% · recency 20%. Top-matched comps best support the ARV.
Projected returns pro-forma
-3.0% appreciation · 3.0% rent growth · sell at horizon
- IRR
- -15.3%
- Equity multiple
- 0.45×
- Total profit
- $-17,595
- Equity at exit
- $17,147
- IRR
- -6.8%
- Equity multiple
- 0.57×
- Total profit
- $-13,910
- Equity at exit
- $9,943
Cash invested: $32,200 (down + closing). Projections, not guarantees.
Landlord ↔ Tenant lean methodology
- Overall (STATE)
- 43 Moderately Tenant-Leaning
- State Illinois
- 43 Moderately Tenant-Leaning · D+7
- County
- — inherits STATE
- City
- — inherits STATE
ZIP-level market 61520
- Active inventory
- 108
- Price-to-rent
- 9.1×
Monthly cashflow live
- Estimated rent
- $1,047 medium interval (Pro) →
- Mortgage (P&I)
- −$603
- Tax from tax record
- −$161 /mo · $1,926/yr
- Insurance
- −$48
- HOA
- −$0
- Vacancy / Maint / Mgmt
- −$220
- Net cashflow
- $16
Break-even live
Sensitivity live
| Price | -10% $81 | -5% $48 | +0% $16 | +5% $-17 | +10% $-49 |
|---|---|---|---|---|---|
| Rent | -10% $-67 | -5% $-25 | +0% $16 | +5% $57 | +10% $99 |
| Rate | -1.0pp $74 | -0.5pp $45 | base $16 | +0.5pp $-14 | +1.0pp $-44 |
UW: 25.0% down · 7.5% · 30yr · 1.5% tax · 5.0% vac · 8.0% maint · 8.0% mgmt
Financing live
Cash to close
- Down payment
- $28,750
- Closing costs
- $3,450
- Reserves months
- —
- Total cash needed
- —
Loan-product check · same deal, 3 products live
Conventional
25% down · 7.5% · 30yr
- Down + closing
- —
- Monthly P&I
- —
- Monthly cashflow
- —
- DSCR
- —
- Eligible?
- —
Personal DTI + credit; lowest rate.
DSCR
20% down · 8.5% · 30yr
- Down + closing
- —
- Monthly P&I
- —
- Monthly cashflow
- —
- DSCR
- —
- Eligible?
- —
No personal income docs; deal must DSCR.
Hard money
10% down · 12.0% · 12mo
- Down + closing
- —
- Monthly P&I
- —
- Monthly cashflow
- —
- DSCR
- —
- Eligible?
- —
Short-term bridge; refi at stabilization.
Rent comps 2 comps
| Address | Beds | Baths | Sqft | Rent | $/sqft | DOM | Units | Dist |
|---|---|---|---|---|---|---|---|---|
| 437 N 8th Ave Canton, IL | 2.0 | 1.0 | 690 | $1,200 | $1.74 | 15d | 1 | 0.27mi |
| 143 W Locust St Unit 6 Canton, IL | 1.0 | 1.0 | 780 | $650 | $0.83 | 45d | 1 | 0.80mi |
Listing history 7 events
-
2026-06-16status $115,000 Pending 8 DOM
-
2026-06-15days on market $115,000 Active 8 DOM
-
2026-06-13days on market $115,000 Active 6 DOM
-
2026-06-12days on market $115,000 Active 5 DOM
-
2026-06-09days on market $115,000 Active 2 DOM
-
2026-06-08remarks 679-char remark
-
2026-06-08$115,000 Active 1 DOM
ⓘ Source: listings_history table (triggers on properties + properties_extension) + one-shot
backfill from property_details.listing_events for pre-trigger history.
Tax reassessment forecast IL · Partial reset (capped growth)
- Current annual tax
- $1,926 · $161/mo
- Projected year-2 tax
- $2,268 · $189/mo
- Expected delta
- +$342/yr (+$29/mo · 17.8%)
ⓘ Screening estimate from a state-policy table — verify with the county assessor before closing.
Climate risk First Street
- Flood 1/10 Low FEMA zone X (unshaded) · 0% chance over 30 yrs
- Wildfire 1/10 Low
- Heat 3/10 Moderate 7 d/yr ≥105°F today · 18 d/yr by 30 yrs out
- Wind 2/10 Low 100% chance of damaging wind over 30 yrs
- Air quality 2/10 Low 1 unhealthy d/yr today · 2 by 30 yrs out
Nearby sold comps map
Loading sold comps map…
Walkable amenities ~0.75 mi
Loading nearby amenities…
Taxation est. · year 1
- Rental income
- $12,569
- − Mortgage interest
- −$6,442
- − Property taxes
- −$1,926
- − Insurance
- −$575
- − Repairs & maintenance
- −$1,005
- − Management
- −$1,005
- − Depreciation
- −$3,345
- Taxable loss
- −$1,731
- Est. tax savings @ 24.0%
- +$415
- After-tax cash flow
- $606/yr
For passive investors: Depreciation is non-cash, so a rental often shows a tax loss while cash-flowing — sheltering income. Rental losses are passive: they offset passive income freely, and up to $25,000/yr can offset ordinary (W-2) income if you actively participate and your MAGI is under $100k (phasing out to $0 by $150k); unused losses carry forward. On sale, claimed depreciation is recaptured at up to 25%, and gains may owe capital-gains tax (a 1031 exchange can defer both). Figures are a year-1 estimate at your 24.0% rate — not tax advice; consult a CPA.
Schools (NCES district)
- District
- Canton Union SD 66
- NCES district ID
- 1708280
- Math proficiency
- 19% ▼ -10.00%
- Reading proficiency
- 23% ▼ -12.00%
- Median HH income
- $42,657
- Composite
- 18.03/100
- National rank
- #8980
- State rank
- #417 of 620 in IL
Livability — Canton
- Score
- 72/100
- State rank
- #318
- US rank
- #6313
Category grades
Schools grade is shown separately in the Schools card above.
Census & demographics
- Census place
- Canton, IL
- Population (ZIP)
- 16,098
Population outlook (Fulton County) Hauer SSP2
- Today (2025)
- 33,356 people
- By 2030
- 32,144 · -3.6%
- By 2040
- 29,518 · -11.5%
- By 2050
- 26,775 · -19.7%
- By 2075
- 19,972 · -40.1%
- By 2100
- 13,580 · -59.3%
Race, ethnicity, and origin ACS 2023
- Neighborhood character
- Predominantly White (88%)
- Race & ethnicity
- White 88% Black 5% Hispanic / Latino 4% Two or more races 4% Native American 1%
- Common ancestry
- Slovak 3% Lithuanian 1% Romanian 1%
- Foreign-born
- 2% · Canada
- Languages at home
- 96% English-only · Spanish 3%
Political lean MEDSL · Fulton
- 2024 margin
- Strong R (+23.8) · D 37.1% · R 60.9% · Other 2.0%
- 2008→2024 swing
- -45.2pp toward R · 2008: 21.3pp · 2024: -23.8pp
- All cycles
- 2024: R+23.8 2020: R+20.1 2016: R+15.1 2012: D+11.1 2008: D+21.3
Not yet ingested
- Civics
- —
Market trends
- HPI YoY
- ▼ -88.00%
- Current HPI
- 123.8086
- Rent YoY
- —
- Metro
- —
- State GDP YoY
- ▲ 1.59%
- F500 in state
- 60
Industry mix (Fortune 500 HQ in IL)
| Industry | F500 HQs | Revenue |
|---|---|---|
| Insurance | 4 | $201B |
|
||
| Consumer Goods | 4 | $87B |
|
||
| Industrial Machinery | 3 | $64B |
|
||
| Healthcare | 2 | $55B |
|
||
| Retail / Pharmacy | 1 | $148B |
|
||
| Agriculture / Food | 1 | $86B |
|
||
Price history
+215.1% since first listed11 events — show timeline
- 2026-06-06 Listed $115,000 RMLSA as Distributed by MLS Grid
- 2024-08-15 Sold (Public Records) $95,000 Public Records
- 2024-08-14 Sold (MLS) $95,000 RMLSA as Distributed by MLS Grid
- 2024-07-04 Pending — RMLSA as Distributed by MLS Grid
- 2024-07-01 Listed $98,000 RMLSA as Distributed by MLS Grid
- 2021-08-06 Listing Removed — RMLSA as Distributed by MLS Grid
- 2020-09-08 Sold (Public Records) $78,000 Public Records
- 2020-09-04 Sold (MLS) $78,000 RMLSA as Distributed by MLS Grid
- 2020-06-23 Listed $79,900 RMLSA as Distributed by MLS Grid
- 2003-01-23 Sold (MLS) $36,500 RMLSA as Distributed by MLS Grid
- 2002-11-29 Listed $36,500 RMLSA as Distributed by MLS Grid
Property tax history
+0.4%/yrLatest (2024): $1,926 · +1.7% YoY. Source: county tax records.
Cash-flow waterfall
monthlySold comps — $/sqft
last 12 mo · ≤1 miLoading sold comps…