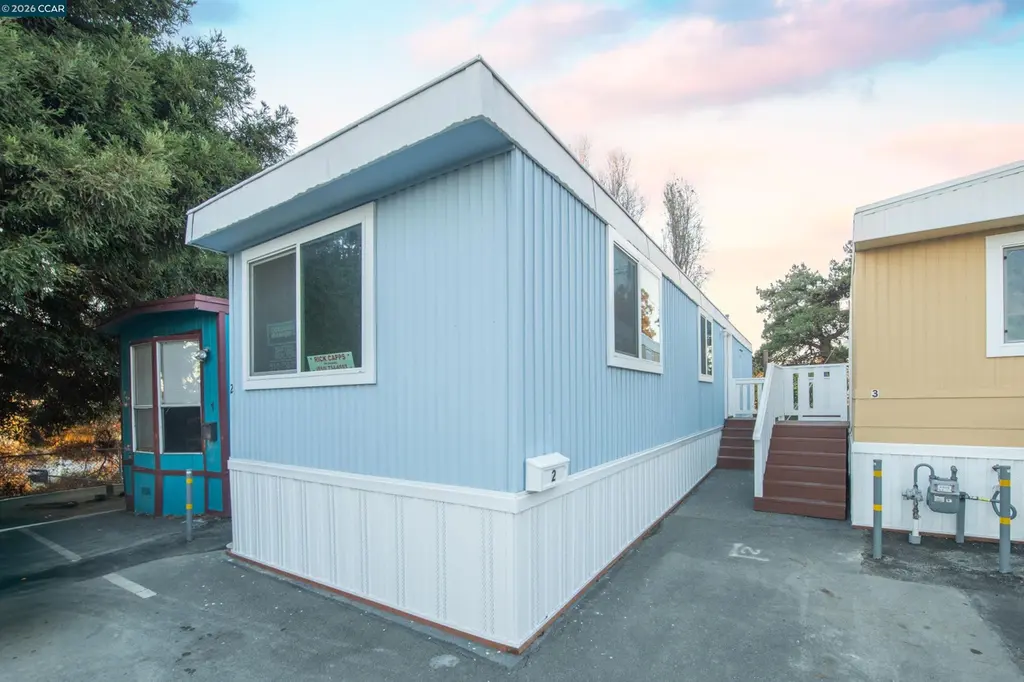
2990 San Pablo Dam Rd #2 · San Pablo, CA
Flood risk 1/10 · Minimal
- FEMA flood zone
- X (unshaded)
- Chance of flooding over 30 yrs
- 0.0%
- Est. flood insurance / yr
- $507 – $1,088
Fire risk 4/10 · Minor
- Est. fire insurance / yr
- $659 – $1,223
Heat risk 3/10 · Minor
- Hot days now (above 87°F)
- 6 days/yr
- Hot days in 30 yrs
- 12 days/yr
Wind risk 1/10 · Minimal
- Chance of severe wind over 30 yrs
- —
Air-quality risk 8/10 · Major
- Unhealthy air days now
- 15 days/yr
- Unhealthy air days in 30 yrs
- 15 days/yr
Risk factors via First Street. Map © Google.
Why this score? — see what drove the C+ grade
The composite is a weighted blend of 9 inputs, each scored 0–100. Each bar is that input's sub-score; the figure is the points it added to the 100-point composite (weight × sub-score).
- Cash flow +30.0/30.0
- 1% rule +10.0/10.0
- DSCR +10.0/10.0
- Condition / age +4.0/5.0
- Rent growth +3.3/5.0
- Schools +3.0/10.0
- Livability +2.9/5.0
- ARV discount +0.0/15.0
- Appreciation +0.0/10.0
$119,500
🖨 Deal sheet 📄 Offer letter ✓ Due diligence
Listing remarks
Remodeled like New One Bedroom, One Bath Mobile Home in an All Age Park in San Pablo By I-80 Freeway and Princeton Plaza! Brand New Range/Oven, Refrigerator, and Stackable Washer/Dryer. Upgrades Include Fresh Exterior Paint, New Vinyl Skirting, Recessed Lighting, Dual Pane Windows, New Counter Tops, New Cabinetry, New Furnace, New Flooring and Walls! This Park Community Is Well Established and Managed By a Pro-Active Hands- On Family Owned Company! Schedule a Personal Showing Appointment Today! There is Parking for one vehicle only!!!
Key facts
- Fresh exterior paint
- Brand new range oven
- Garage
Tags
Property features AI
Finance
- HOA & community: Pets allowed (cats and dogs OK; size and number limits, approval required); Park name not listed
Exterior
- Parking: 1 covered garage space; 1 parking space per unit
- Utilities: Public water; Public sewer; Natural gas connected
- Home design: Manufactured in-park home; Single-wide mobile home; Faces southwest
- Construction: Metal construction; Crawl space foundation; Built as a single-wide mobile home
- Exterior features: Back yard; Located on a court; Level lot
Interior
- Kitchen: Gas range; Solid surface counters; Eat-in kitchen
- Bedrooms: 1 bedroom (street level)
- Flooring: Laminate flooring; Vinyl flooring
- Bathrooms: 1 full bathroom with stall shower
- Heating & cooling: Forced air heating (natural gas); No air conditioning
- Interior features: Solid surface counters; Eat-in kitchen
- Laundry & utility: Washer; Dryer; Laundry closet; Dedicated laundry room; Gas water heater
Neighborhood map
What this means for you Summary
Snapshot
- This is a 1-bed/1.0-bath manufactured listed at $120k. Condition is rated good.
Deal economics
- At list price, monthly cash flow is $756 ($9k/yr) — positive.
- The deal already cash-flows at list — no discount required.
- Meets the 1% rule at list price ($2k rent vs $120k).
- Recommended offer: $116k (3.0% below list) — sets the bar for market timing.
- Cap rate 13.9% vs local median 2.9% in San Pablo — top-decile yield for the area; either an underpriced asset or a hidden risk that comps aren't pricing in. Stress-test before assuming the spread holds.
Location & tenants
- Location reads 58/100 on livability (#715 in CA) — a working-class tenant base; expect higher turnover. Strengths: commute A+, housing B+; Watch: schools F, crime F, amenities F.
- West Contra Costa Unified (suburban): math 24% / reading 35% proficiency, ranked #993 of 1,400 in CA (top 71%) — low school quality limits family demand, transient renter base, plan for 1-2y turnover.
- Market conditions: Rents rising (+3.1%/yr); 123 active listings in the ZIP; 21 comparable units currently listed for rent nearby; rentals at typical pace (median 24d on market — plan ~3-4 weeks tenant-placement turnaround); solid renter incomes; 2,169 units permitted in Contra Costa County in 2024 (896 in 5+ unit buildings).
Forward outlook
- Local home prices are declining (-3.0%/yr); year-one equity from $826 of loan paydown is wiped out by about $4k of value loss. Plan a longer hold.
- Contra Costa County population projected at +26% by 2050 — long-run rental-demand tailwind backs the buy-and-hold thesis.
- At projected returns (-3.0% appreciation + 3.1% rent growth), your $33k cash investment doubles in ~5 years — after that, you're playing with house money.
Negotiation context
- It's been on market 44 days — a 3% lower offer ($116k) is reasonable based on typical stale-listing flexibility.
Questions for the listing agent
- It's been on market 44 days. Have you received any prior offers? Is the seller open to a 3% concession, seller financing, or rate buy-down credit?
- Built in 1971 — when were the roof, HVAC, electrical panel, plumbing, and water heater last replaced?
- Is there a deadline driving the sale (1031 exchange, divorce, estate, relocation)? That informs how much negotiation room exists.
- Schools are F-rated, which usually means shorter tenancies and higher turnover. Who's the typical renter profile here, and what's been the actual vacancy rate?
- Crime grade is F in this area — have there been break-ins, vandalism, or insurance claims at this property in the last 3 years? What carrier currently insures it and at what premium?
- What's the average days-on-market for RENTAL listings here right now (not sales)? A rising rental-DOM trend means longer vacancies and softer asking-rent achievability than the comps imply.
- What's the recent tenant-quality profile in this submarket — average credit score on applications, eviction rate, late-payment / NSF rate, and stable-employment percentage? A property-management company in the area should have these aggregated.
- How much new for-sale + rental construction is in the pipeline within 1–3 miles? Heavy new supply typically softens prices + rents 12–24 months out; constrained supply supports both.
Investment metrics
- 1% rule
- 1.68% ✓
- Cap rate
- 13.88%
- Cash-on-cash
- 27.10%
- DSCR
- 2.21
- GRM
- 5.0
CMA / ARV
- ARV (median comp)
- $80,000
- List price
- $119,500
- Delta
- 49.38%
- Verdict
- OVERPRICED
- Comps
- 2 within 2.0 mi
Projected returns pro-forma
-3.0% appreciation · 3.06% rent growth · sell at horizon
- IRR
- 21.1%
- Equity multiple
- 1.86×
- Total profit
- $28,915
- Equity at exit
- $17,818
- IRR
- 29.3%
- Equity multiple
- 3.62×
- Total profit
- $87,770
- Equity at exit
- $10,332
Cash invested: $33,460 (down + closing). Projections, not guarantees.
Landlord ↔ Tenant lean methodology
- Overall (STATE)
- 18 Strongly Tenant-Friendly
- State California
- 18 Strongly Tenant-Friendly · D+13
- County
- — inherits STATE
- City
- — inherits STATE
ZIP-level market 94806
- Rents YoY
- 3.1%
- Active inventory
- 123
- Price-to-rent
- 5.0×
Monthly cashflow live
- Estimated rent
- $2,002 high interval (Pro) →
- Mortgage (P&I)
- −$627
- Tax est. 1.5%
- −$149 /mo · $1,792/yr
- Insurance
- −$50
- HOA
- −$0
- Vacancy / Maint / Mgmt
- −$420
- Net cashflow
- $756
Break-even live
UW: 25.0% down · 7.5% · 30yr · 1.5% tax · 5.0% vac · 8.0% maint · 8.0% mgmt
Financing live
Cash to close
- Down payment
- $29,875
- Closing costs
- $3,585
- Reserves months
- —
- Total cash needed
- —
Loan-product check · same deal, 3 products live
Conventional
25% down · 7.5% · 30yr
- Down + closing
- —
- Monthly P&I
- —
- Monthly cashflow
- —
- DSCR
- —
- Eligible?
- —
Personal DTI + credit; lowest rate.
DSCR
20% down · 8.5% · 30yr
- Down + closing
- —
- Monthly P&I
- —
- Monthly cashflow
- —
- DSCR
- —
- Eligible?
- —
No personal income docs; deal must DSCR.
Hard money
10% down · 12.0% · 12mo
- Down + closing
- —
- Monthly P&I
- —
- Monthly cashflow
- —
- DSCR
- —
- Eligible?
- —
Short-term bridge; refi at stabilization.
Rent comps 21 comps
| Address | Beds | Baths | Sqft | Rent | $/sqft | DOM | Units | Dist |
|---|---|---|---|---|---|---|---|---|
| 5405 Morrow Dr Unit 1 San Pablo, CA | 2.0 | 1.0 | 700 | $2,225 | $3.18 | 43d | 1 | 0.09mi |
| 6090 N Arlington Blvd Unit B San Pablo, CA | 1.0 | 1.0 | 400 | $1,650 | $4.12 | 43d | 1 | 0.39mi |
| 1330 Contra Costa Ave San Pablo, CA | 2.0 | 1.0–1.5 | 721 | $2,320 | $3.22 | 5d | 8 | 0.51mi |
| 5005 Montoya Ave Richmond, CA | — | 1.0 | 500 | $1,830 | $3.66 | 12d | 1 | 0.59mi |
| 13728 San Pablo Ave San Pablo, CA | 1.0 | 1.0 | 526 | $1,563 | $2.97 | 24d | 1 | 0.61mi |
| 3535 El Portal Dr El Sobrante, CA | 1.0–3.0 | 1.0–3.0 | 969 | $2,429 | $2.51 | 1d | 16 | 0.72mi |
| 1680 24th St San Pablo, CA | 2.0 | 1.0 | 636 | $1,895 | $2.98 | 1d | 1 | 0.97mi |
| 14349 San Pablo Ave San Pablo, CA | 1.0 | 1.0 | 750 | $1,700 | $2.27 | 43d | 1 | 1.03mi |
| 2014 22nd St San Pablo, CA | 1.0 | 1.0 | 500 | $1,800 | $3.60 | 24d | 1 | 1.04mi |
| 827 S 33rd St Unit 827 Richmond, CA | 2.0 | 1.0 | 731 | $2,150 | $2.94 | 43d | 1 | 1.11mi |
| 827 S 33rd St Unit 827 Richmond, CA | 2.0 | 1.0 | 731 | $2,150 | $2.94 | 12d | 1 | 1.11mi |
| 2031 Market Ave Unit private room San Pablo, CA | 2.0 | 1.0 | 700 | $1,200 | $1.71 | 43d | 1 | 1.17mi |
| 2031 Market Ave #124 San Pablo, CA | 2.0 | 1.0 | 691 | $1,000 | $1.45 | 18d | 1 | 1.17mi |
| 1247 23rd St Unit 2245 Richmond, CA | — | 1.0 | 425 | $1,400 | $3.29 | 43d | 1 | 1.17mi |
| 14761 San Pablo Ave Unit 6 San Pablo, CA | 2.0 | 1.0 | 750 | $2,550 | $3.40 | 43d | 1 | 1.21mi |
| 2300 Lancaster Dr Richmond, CA | 1.0 | 1.0 | 668 | $1,782 | $2.67 | 2d | 13 | 1.23mi |
| 649 El Centro Rd Unit 1546147P El Sobrante, CA | 1.0 | 1.0 | 592 | $1,879 | $3.17 | 14d | 1 | 1.27mi |
| 655 Santa Maria Rd Unit B El Sobrante, CA | — | 1.0 | 476 | $1,765 | $3.71 | 43d | 1 | 1.32mi |
| 760 Alhambra Rd El Sobrante, CA | 2.0 | 1.0 | 725 | $2,150 | $2.97 | 24d | 1 | 1.40mi |
| 4481 Appian Way El Sobrante, CA | 1.0–2.0 | 1.0–1.5 | 750 | $2,212 | $2.95 | 24d | 2 | 1.44mi |
| 4474 Appian Way Unit 14 El Sobrante, CA | 2.0 | 1.0 | 750 | $2,250 | $3.00 | 2d | 1 | 1.46mi |
Listing history 15 events
-
2026-06-18days on market $119,500 Active 44 DOM
-
2026-06-17days on market $119,500 Active 43 DOM
-
2026-06-16days on market $119,500 Active 42 DOM
-
2026-06-15days on market $119,500 Active 41 DOM
-
2026-06-13days on market $119,500 Active 39 DOM
-
2026-06-13days on market $119,500 Active 38 DOM
-
2026-06-09days on market $119,500 Active 35 DOM
-
2026-06-08days on market $119,500 Active 34 DOM
-
2026-06-07days on market $119,500 Active 33 DOM
-
2026-06-04days on market $119,500 Active 30 DOM
-
2026-06-03days on market $119,500 Active 29 DOM
-
2026-06-02days on market $119,500 Active 28 DOM
-
2026-06-01days on market $119,500 Active 27 DOM
-
2026-05-31days on market $119,500 Active 26 DOM
-
2026-05-05$119,500 Active 542-char remark
ⓘ Source: listings_history table (triggers on properties + properties_extension) + one-shot
backfill from property_details.listing_events for pre-trigger history.
Climate risk First Street
- Flood 1/10 Low FEMA zone X (unshaded) · 0% chance over 30 yrs
- Wildfire 4/10 Moderate
- Heat 3/10 Moderate 6 d/yr ≥87°F today · 12 d/yr by 30 yrs out
- Wind 1/10 Low
- Air quality 8/10 Severe 15 unhealthy d/yr today · 15 by 30 yrs out
Nearby sold comps map
Loading sold comps map…
Walkable amenities ~0.75 mi
Loading nearby amenities…
Taxation est. · year 1
- Rental income
- $24,023
- − Mortgage interest
- −$6,694
- − Property taxes
- −$1,792
- − Insurance
- −$598
- − Repairs & maintenance
- −$1,922
- − Management
- −$1,922
- − Depreciation
- −$3,476
- Taxable income
- $7,619
- Est. tax owed @ 24.0%
- −$1,828
- After-tax cash flow
- $7,239/yr
For passive investors: Depreciation is non-cash, so a rental often shows a tax loss while cash-flowing — sheltering income. Rental losses are passive: they offset passive income freely, and up to $25,000/yr can offset ordinary (W-2) income if you actively participate and your MAGI is under $100k (phasing out to $0 by $150k); unused losses carry forward. On sale, claimed depreciation is recaptured at up to 25%, and gains may owe capital-gains tax (a 1031 exchange can defer both). Figures are a year-1 estimate at your 24.0% rate — not tax advice; consult a CPA.
Condition & rehab AI · 12 photos
This remodeled mobile home is in good condition with recent updates, making it a great investment opportunity.
Value-add opportunities
- Both Landscaping and curb appeal improvements — Enhances curb appeal and can attract more buyers
- Both Add a small front porch or patio — Can increase the living space and add value
- Both Install a smart home system — Can increase the home's appeal to tech-savvy buyers
Renovation cost estimate screening
Value-add ROI direction
- Both Landscaping and curb appeal improvements — Enhances curb appeal and can attract more buyers ↑
- Both Add a small front porch or patio — Can increase the living space and add value ↑
- Both Install a smart home system — Can increase the home's appeal to tech-savvy buyers ↑
ⓘ Cost ranges are severity-bucket heuristics (US national rule-of-thumb). Get contractor quotes + a written scope before underwriting a rehab budget.
Schools (NCES district)
- District
- West Contra Costa Unified
- NCES district ID
- 0632550
- Math proficiency
- 24% ▲ 1.00%
- Reading proficiency
- 35% ▲ 1.00%
- Median HH income
- $64,837
- Composite
- 30.04/100
- National rank
- #11623
- State rank
- #993 of 1400 in CA
Livability — San Pablo
- Score
- 58/100
- State rank
- #715
- US rank
- #21354
Category grades
Schools grade is shown separately in the Schools card above.
Census & demographics
- Census place
- San Pablo, CA
- County
- Contra Costa County · 1,059,880 people
- Metro
- San Francisco-Oakland-Berkeley, CA
- Population (ZIP)
- 62,546
- Household income
- $86,034
- Rent vs Own
- Severe rent burden
- 2830.0
Population outlook (Contra Costa County) Hauer SSP2
- Today (2025)
- 1,287,720 people
- By 2030
- 1,364,937 · +6.0%
- By 2040
- 1,506,209 · +17.0%
- By 2050
- 1,624,373 · +26.1%
- By 2075
- 1,853,193 · +43.9%
- By 2100
- 1,901,231 · +47.6%
Race, ethnicity, and origin ACS 2023
- Neighborhood character
- Diverse neighborhood (Simpson 0.68)
- Race & ethnicity
- Hispanic / Latino 51% Two or more races 16% Asian 16% Black 13% White 12% Native American 1%
- Hispanic origin (detail)
- Mexican 34%
- Common ancestry
- Estonian 2% Italian 1% Russian 1%
- Foreign-born
- 38% · Canada, China, Vietnam
- Languages at home
- 39% English-only · Spanish 43% Other Indo-European 4% Tagalog/Filipino 3%
Political lean MEDSL · Contra Costa
- 2024 margin
- Solid D (+38.0) · D 67.3% · R 29.4% · Other 3.3%
- 2008→2024 swing
- +0.2pp no change · 2008: 37.8pp · 2024: 38.0pp
- All cycles
- 2024: D+38.0 2020: D+45.3 2016: D+43.5 2012: D+33.7 2008: D+37.8
Not yet ingested
- Civics
- —
Market trends
- HPI YoY
- ▼ -665.89%
- Current HPI
- 323.0082
- Rent YoY
- ▲ 3.06%
- Metro
- San Francisco-Oakland-Berkeley, CA
- State GDP YoY
- ▲ 3.21%
- F500 in state
- 116
Industry mix (Fortune 500 HQ in CA)
| Industry | F500 HQs | Revenue |
|---|---|---|
| Technology | 27 | $1,492B |
|
||
| Financial Services | 3 | $174B |
|
||
| Retail | 3 | $44B |
|
||
| Insurance | 3 | $26B |
|
||
| Media / Entertainment | 2 | $115B |
|
||
| Pharmaceuticals / Biotech | 2 | $62B |
|
||
Price history
1 event — show timeline
- 2026-05-05 Listed $119,500 bridgeMLS, Bay East AOR, or Contra Costa AOR
Cash-flow waterfall
monthlySold comps — $/sqft
last 12 mo · ≤1 miLoading sold comps…