7286 Huntington Ln · Delray Beach, FL
Flood risk 1/10 · Minimal
- FEMA flood zone
- X (unshaded)
- Chance of flooding over 30 yrs
- 0.0%
- Est. flood insurance / yr
- $507 – $1,088
Fire risk 2/10 · Minimal
- Est. fire insurance / yr
- $947 – $1,759
Heat risk 9/10 · Severe
- Hot days now (above 107°F)
- 7 days/yr
- Hot days in 30 yrs
- 26 days/yr
Wind risk 10/10 · Severe
- Chance of severe wind over 30 yrs
- 99.0%
Air-quality risk 2/10 · Minimal
- Unhealthy air days now
- 0 days/yr
- Unhealthy air days in 30 yrs
- 2 days/yr
Risk factors via First Street. Map © Google.
Why this score? — see what drove the A- grade
The composite is a weighted blend of 9 inputs, each scored 0–100. Each bar is that input's sub-score; the figure is the points it added to the 100-point composite (weight × sub-score).
- Cash flow +29.2/30.0
- ARV discount +15.0/15.0
- DSCR +10.0/10.0
- 1% rule +8.1/10.0
- Appreciation +5.3/10.0
- Schools +4.3/10.0
- Livability +3.9/5.0
- Rent growth +2.6/5.0
- Condition / age +2.2/5.0
$217,000
🖨 Deal sheet (PDF) 📄 Offer letter ✓ Due diligence
Listing remarks
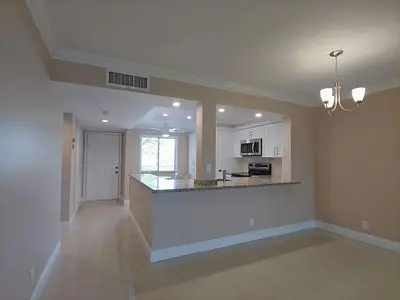
This 1210 square foot condo home has 2 bedrooms and 2.0 bathrooms. This home is located at 7286 Huntington Ln APT 204, Delray Beach, FL 33446.
Key facts
- Built 1986
- Listed 11 days
Property features AI
Exterior
- Home design: Built in 1986
- Construction: Living area approximately 1070
- Exterior features: Located in the Villages of Oriole community
Neighborhood map
What this means for you Summary
Snapshot
- This is a 2-bed/2.0-bath single-family listed at $217k. Condition is rated fair.
Deal economics
- At list price, monthly cash flow is $754 ($9k/yr) — positive.
- The deal already cash-flows at list — no discount required.
- Meets the 1% rule at list price ($3k rent vs $217k).
- Cap rate 10.5% vs local median 4.3% in Delray Beach — top-decile yield for the area; either an underpriced asset or a hidden risk that comps aren't pricing in. Stress-test before assuming the spread holds.
Location & tenants
- Location reads 77/100 on livability (#202 in FL, #3,160 nationally) — a middle-class / working-renter tenant base. Strengths: housing A+, health & safety A+, commute A-; Watch: cost of living C-, crime D-, amenities F.
- Palm Beach (suburban): math 46% / reading 53% proficiency, ranked #34 of 73 in FL (top 47%) — families likely to look elsewhere, expect single-tenant / working-renter base with shorter leases.
- Market conditions: Rents flat; 583 active listings in the ZIP; 40 comparable units currently listed for rent nearby; rentals at typical pace (median 23d on market — plan ~3-4 weeks tenant-placement turnaround); solid renter incomes; 3,974 units permitted in Palm Beach County in 2024 (1,012 in 5+ unit buildings).
- This rent runs 43% of the median local income ($80k/yr) — at the standard rent-burdened threshold; future hikes will face affordability resistance.
Forward outlook
- In year one you build about $3k of equity ($2k loan paydown + $1k appreciation (0.7% local appreciation)).
- Palm Beach County population projected at +30% by 2050 — long-run rental-demand tailwind backs the buy-and-hold thesis.
- At projected returns (0.7% appreciation + 0.5% rent growth), your $61k cash investment doubles in ~5 years — after that, you're playing with house money.
- By year 10, paydown + projected appreciation supports a ~$33k cash-out refi (75% LTV) — recoverable capital for the next deal without selling this one.
Negotiation context
- Only 12 days on market — expect competitive offers; lowballing is unlikely to land.
- 2 sale attempts since 3y ago with the ask held roughly flat each time — persistent listings suggest the price (not the market) is what's stuck; bring a comps-based counter.
Risks & watch-outs
- Climate carrying-cost: severe wind risk, 99% chance of damaging wind over 30y; extreme-heat days projected 7→26/yr by 2055 (HVAC capex compounding) — expect insurance premiums to compound above CPI over the hold.
Questions for the listing agent
- Have any recent inspections been done? Can we get a copy of the seller's disclosures and any deferred-maintenance estimates?
- Is there a deadline driving the sale (1031 exchange, divorce, estate, relocation)? That informs how much negotiation room exists.
- Schools are B-rated — typically a magnet for longer-tenancy family renters. What's the average tenant stay here, and is there a school-zone premium baked into asking?
- Crime grade is D in this area — have there been break-ins, vandalism, or insurance claims at this property in the last 3 years? What carrier currently insures it and at what premium?
- What's the average days-on-market for RENTAL listings here right now (not sales)? A rising rental-DOM trend means longer vacancies and softer asking-rent achievability than the comps imply.
- What's the recent tenant-quality profile in this submarket — average credit score on applications, eviction rate, late-payment / NSF rate, and stable-employment percentage? A property-management company in the area should have these aggregated.
- How much new for-sale + rental construction is in the pipeline within 1–3 miles? Heavy new supply typically softens prices + rents 12–24 months out; constrained supply supports both.
Investment metrics
- 1% rule
- 1.31% ✓
- Cap rate
- 10.46%
- Cash-on-cash
- 14.89%
- DSCR
- 1.66
- GRM
- 6.3
CMA / ARV
- ARV (on-the-fly)
- $313,510
- Comps found
- 1
Show comp detail 1 sale within ~0.75 mi
| Address | Dist | Beds/Ba | Sqft | Sold | Price | $/sf | Match |
|---|---|---|---|---|---|---|---|
| 6839 Moonlit Dr | 0.60mi | 2/2.0 | 1,148 (+7%) | 7mo | $336,450 | $293 | 54 |
Match score weights: distance 35% · size 25% · config 20% · recency 20%. Top-matched comps best support the ARV.
Projected returns pro-forma
0.69% appreciation · 0.51% rent growth · sell at horizon
- IRR
- 14.1%
- Equity multiple
- 1.69×
- Total profit
- $41,848
- Equity at exit
- $70,565
- IRR
- 16.3%
- Equity multiple
- 2.78×
- Total profit
- $107,965
- Equity at exit
- $91,114
Cash invested: $60,760 (down + closing). Projections, not guarantees.
Landlord ↔ Tenant lean methodology
- Overall (STATE)
- 87 Strongly Landlord-Friendly
- State Florida
- 87 Strongly Landlord-Friendly · R+3
- County
- — inherits STATE
- City
- — inherits STATE
ZIP-level market 33446
- Home prices YoY
- 0.3%
- Rents YoY
- 0.5%
- Active inventory
- 583
- Price-to-rent
- 6.3×
Monthly cashflow live
- Estimated rent
- $2,853 high interval (Pro) →
- Mortgage (P&I)
- −$1,138
- Tax est. 1.5%
- −$271 /mo · $3,255/yr
- Insurance
- −$90
- HOA
- −$0
- Vacancy / Maint / Mgmt
- −$599
- Net cashflow
- $754
Break-even live
Sensitivity live
| Price | -10% $904 | -5% $829 | +0% $754 | +5% $679 | +10% $604 |
|---|---|---|---|---|---|
| Rent | -10% $529 | -5% $641 | +0% $754 | +5% $867 | +10% $979 |
| Rate | -1.0pp $863 | -0.5pp $809 | base $754 | +0.5pp $698 | +1.0pp $641 |
UW: 25.0% down · 7.5% · 30yr · 1.5% tax · 5.0% vac · 8.0% maint · 8.0% mgmt
Financing live
Cash to close
- Down payment
- $54,250
- Closing costs
- $6,510
- Reserves months
- —
- Total cash needed
- —
Loan-product check · same deal, 3 products live
Conventional
25% down · 7.5% · 30yr
- Down + closing
- —
- Monthly P&I
- —
- Monthly cashflow
- —
- DSCR
- —
- Eligible?
- —
Personal DTI + credit; lowest rate.
DSCR
20% down · 8.5% · 30yr
- Down + closing
- —
- Monthly P&I
- —
- Monthly cashflow
- —
- DSCR
- —
- Eligible?
- —
No personal income docs; deal must DSCR.
Hard money
10% down · 12.0% · 12mo
- Down + closing
- —
- Monthly P&I
- —
- Monthly cashflow
- —
- DSCR
- —
- Eligible?
- —
Short-term bridge; refi at stabilization.
Rent comps 40 comps
| Address | Beds | Baths | Sqft | Rent | $/sqft | DOM | Units | Dist |
|---|---|---|---|---|---|---|---|---|
| 7286 Huntington Ln #105 Delray Beach, FL | 2.0 | 2.0 | 1070 | $3,350 | $3.13 | 25d | 1 | 0.02mi |
| 7192 Huntington Ln #307 Delray Beach, FL | 2.0 | 2.0 | 1070 | $3,500 | $3.27 | 19d | 1 | 0.09mi |
| 7310 Ashford Pl Delray Beach, FL | 2.0 | 2.0 | 1230 | $3,200 | $2.60 | 16d | 1 | 0.19mi |
| 7310 Ashford Pl Delray Beach, FL | 2.0 | 2.0 | 1230 | $3,200 | $2.60 | 9d | 1 | 0.19mi |
| 7310 Ashford Pl Delray Beach, FL | 2.0 | 2.0 | 1230 | $2,700 | $2.20 | 20d | 2 | 0.19mi |
| 14509 Sloan Ridge Dr Unit 10-104 Luminosa Delray Beach, FL | 3.0 | 2.0 | 1328 | $3,827 | $2.88 | 25d | 1 | 0.19mi |
| 14828 Golden Jax Ln Unit 6-105 Radiance Delray Beach, FL | 2.0 | 2.0 | 1321 | $4,148 | $3.14 | 18d | 1 | 0.19mi |
| 14828 Golden Jax Ln Unit 8-105 Radiance Delray Beach, FL | 2.0 | 2.0 | 1321 | $3,948 | $2.99 | 16d | 1 | 0.19mi |
| 14828 Golden Jax Ln Unit 8103 Delray Beach, FL | 2.0 | 2.0 | 1321 | $3,948 | $2.99 | 0d | 1 | 0.19mi |
| 7076 Huntington Ln #608 Delray Beach, FL | 2.0 | 2.0 | 1230 | $2,600 | $2.11 | 25d | 1 | 0.20mi |
| 14307 Bedford Dr #302 Delray Beach, FL | 2.0 | 2.0 | 990 | $2,200 | $2.22 | 25d | 1 | 0.21mi |
| 14534 Highland Center Way Delray Beach, FL | 2.0 | 2.0 | 1319 | $3,400 | $2.58 | 9d | 1 | 0.22mi |
| 14556 Wiley Range Rd Delray Beach, FL | 2.0 | 2.0 | 1319 | $3,000 | $2.27 | 25d | 1 | 0.25mi |
| 14800 Cumberland Dr Delray Beach, FL | 2.0–3.0 | 2.0 | 1324 | $3,827 | $2.89 | 0d | 4 | 0.29mi |
| 14624 Three Ponds Trl Delray Beach, FL | 3.0 | 2.0 | 1411 | $3,250 | $2.30 | 18d | 1 | 0.29mi |
| 7301 Amberly Ln #304 Delray Beach, FL | 2.0 | 2.0 | 1080 | $1,495 | $1.38 | 9d | 1 | 0.30mi |
| 7260 Kinghurst Dr #205 Delray Beach, FL | 2.0 | 2.0 | 1230 | $2,800 | $2.28 | 20d | 1 | 0.32mi |
| 6866 Huntington Ln #305 Delray Beach, FL | 2.0 | 2.0 | 1230 | $4,500 | $3.66 | 25d | 1 | 0.33mi |
| 14747 Cumberland Dr #301 Delray Beach, FL | 2.0 | 2.0 | 1044 | $1,900 | $1.82 | 25d | 1 | 0.35mi |
| 6795 Huntington Ln #406 Delray Beach, FL | 2.0 | 2.0 | 990 | $2,500 | $2.53 | 22d | 1 | 0.38mi |
| 23 Abbey Ln #208 Delray Beach, FL | 2.0 | 2.0 | 925 | $1,500 | $1.62 | 4d | 1 | 0.38mi |
| 21 Abbey Ln #107 Delray Beach, FL | 2.0 | 2.0 | 925 | $1,800 | $1.95 | 16d | 1 | 0.39mi |
| 20 Abbey Ln #102 Delray Beach, FL | 2.0 | 2.0 | 925 | $2,600 | $2.81 | 25d | 1 | 0.40mi |
| 14723 Cumberland Dr Unit 404 B Delray Beach, FL | 1.0 | 2.0 | 912 | $1,850 | $2.03 | 25d | 1 | 0.41mi |
| 31 Abbey Ln #207 Delray Beach, FL | 2.0 | 2.0 | 925 | $1,300 | $1.41 | 25d | 1 | 0.44mi |
| 19 Abbey Ln #206 Delray Beach, FL | 2.0 | 2.0 | 925 | $1,750 | $1.89 | 25d | 1 | 0.44mi |
| 14 Willowbrook Ln #101 Delray Beach, FL | 2.0 | 2.0 | 1005 | $1,700 | $1.69 | 6d | 1 | 0.44mi |
| 32 Abbey Ln #207 Delray Beach, FL | 2.0 | 2.0 | 925 | $2,500 | $2.70 | 25d | 1 | 0.47mi |
| 14671 Bonaire Blvd #505 Delray Beach, FL | 1.0 | 2.0 | 925 | $1,600 | $1.73 | 25d | 1 | 0.47mi |
| 7350 Kinghurst Dr Delray Beach, FL | 2.0 | 2.0 | 1220 | $4,500 | $3.69 | 16d | 1 | 0.49mi |
| 7350 Kinghurst Dr #305 Delray Beach, FL | 2.0 | 2.0 | 1220 | $4,500 | $3.69 | 23d | 1 | 0.49mi |
| 7350 Kinghurst Dr #305 Delray Beach, FL | 2.0 | 2.0 | 1220 | $4,500 | $3.69 | 0d | 1 | 0.49mi |
| 10 Willowbrook Ln #105 Delray Beach, FL | 2.0 | 2.0 | 1005 | $2,100 | $2.09 | 12d | 1 | 0.52mi |
| 14475 Strathmore Ln Delray Beach, FL | 2.0 | 2.0 | 1230 | $2,422 | $1.97 | 25d | 2 | 0.52mi |
| 14895 Builtmore Way Delray Beach, FL | 2.0 | 2.0 | 1103 | $1,800 | $1.63 | 25d | 1 | 0.53mi |
| 14898 Wedgefield Dr #202 Delray Beach, FL | 2.0 | 2.0 | 1103 | $2,000 | $1.81 | 18d | 1 | 0.53mi |
| 3 Abbey Ln #102 Delray Beach, FL | 2.0 | 2.0 | 925 | $2,500 | $2.70 | 25d | 1 | 0.53mi |
| 14896 Bal Moral Ln Delray Beach, FL | 2.0 | 2.0 | 1040 | $2,200 | $2.12 | 25d | 1 | 0.54mi |
| 7515 S Oriole Blvd Delray Beach, FL | 2.0 | 2.0 | 850 | $1,700 | $2.00 | 25d | 1 | 0.57mi |
| 6813 Moonlit Dr Delray Beach, FL | 2.0 | 2.0 | 1148 | $2,150 | $1.87 | 25d | 1 | 0.58mi |
Listing history 8 events
-
2026-06-18days on market $217,000 Active 12 DOM
-
2026-06-17days on market $217,000 Active 11 DOM
-
2026-06-16days on market $217,000 Active 10 DOM
-
2026-06-15days on market $217,000 Active 9 DOM
-
2026-06-13days on market $217,000 Active 7 DOM
-
2026-06-09days on market $217,000 Active 3 DOM
-
2026-06-07remarks 142-char remark
-
2026-06-07$217,000 Active 1 DOM
ⓘ Source: listings_history table (triggers on properties + properties_extension) + one-shot
backfill from property_details.listing_events for pre-trigger history.
Climate risk First Street
- Flood 1/10 Low FEMA zone X (unshaded) · 0% chance over 30 yrs
- Wildfire 2/10 Low
- Heat 9/10 Extreme 7 d/yr ≥107°F today · 26 d/yr by 30 yrs out
- Wind 10/10 Extreme 99% chance of damaging wind over 30 yrs
- Air quality 2/10 Low 0 unhealthy d/yr today · 2 by 30 yrs out
Nearby sold comps map
Loading sold comps map…
Walkable amenities ~0.75 mi
Loading nearby amenities…
Taxation est. · year 1
- Rental income
- $34,233
- − Mortgage interest
- −$12,155
- − Property taxes
- −$3,255
- − Insurance
- −$1,085
- − Repairs & maintenance
- −$2,739
- − Management
- −$2,739
- − Depreciation
- −$6,313
- Taxable income
- $5,948
- Est. tax owed @ 24.0%
- −$1,427
- After-tax cash flow
- $7,621/yr
For passive investors: Depreciation is non-cash, so a rental often shows a tax loss while cash-flowing — sheltering income. Rental losses are passive: they offset passive income freely, and up to $25,000/yr can offset ordinary (W-2) income if you actively participate and your MAGI is under $100k (phasing out to $0 by $150k); unused losses carry forward. On sale, claimed depreciation is recaptured at up to 25%, and gains may owe capital-gains tax (a 1031 exchange can defer both). Figures are a year-1 estimate at your 24.0% rate — not tax advice; consult a CPA.
Condition & rehab AI · 2 photos
The home appears to be in fair condition with some cosmetic updates needed. Painting the interior walls and maintaining the HVAC system would significantly enhance its value.
Value-add opportunities
- Both Paint interior walls — Fresh paint can improve the home's appearance and make it more appealing to potential buyers or renters.
- Both Clean and maintain HVAC system — A clean and well-maintained HVAC system can improve air quality and reduce energy costs, making the home more attractive to buyers and renters.
Renovation cost estimate screening
Value-add ROI direction
- Both Paint interior walls — Fresh paint can improve the home's appearance and make it more appealing to potential buyers or renters. ↑
- Both Clean and maintain HVAC system — A clean and well-maintained HVAC system can improve air quality and reduce energy costs, making the home more attractive to buyers and renters. ↑
ⓘ Cost ranges are severity-bucket heuristics (US national rule-of-thumb). Get contractor quotes + a written scope before underwriting a rehab budget.
Schools (NCES district)
- District
- Palm Beach
- NCES district ID
- 1201500
- Math proficiency
- 46% ▼ -16.00%
- Reading proficiency
- 53% ▼ -4.00%
- Median HH income
- $53,943
- Composite
- 42.72/100
- National rank
- #3160
- State rank
- #34 of 73 in FL
Livability — Delray Beach
- Score
- 77/100
- State rank
- #202
- US rank
- #3160
Category grades
Schools grade is shown separately in the Schools card above.
Census & demographics
- County
- Palm Beach County · 1,438,312 people
- City population
- 123,167
- Metro
- Miami-Fort Lauderdale-Pompano Beach, FL
- Population (ZIP)
- 28,431
- Household income
- $80,187
- Rent vs Own
- Severe rent burden
- 494.0
Population outlook (Palm Beach County) Hauer SSP2
- Today (2025)
- 1,637,487 people
- By 2030
- 1,743,255 · +6.5%
- By 2040
- 1,948,712 · +19.0%
- By 2050
- 2,132,979 · +30.3%
- By 2075
- 2,530,027 · +54.5%
- By 2100
- 2,706,979 · +65.3%
Race, ethnicity, and origin ACS 2023
- Neighborhood character
- Predominantly White (79%)
- Race & ethnicity
- White 79% Hispanic / Latino 13% Two or more races 9% Black 4%
- Hispanic origin (detail)
- Puerto Rican 3% Dominican 1%
- Common ancestry
- Romanian 9% Scotch-Irish 9% Italian 2%
- Foreign-born
- 20% · Canada, Jamaica, Guatemala
- Languages at home
- 80% English-only · Spanish 12% Other Indo-European 2% French/Haitian/Cajun 2%
Political lean MEDSL · Palm Beach
- 2024 margin
- Toss-up / Even · D 50.0% · R 49.2%
- 2008→2024 swing
- -22.1pp toward R · 2008: 22.9pp · 2024: 0.8pp
- All cycles
- 2024: D+0.8 2020: D+12.8 2016: D+15.3 2012: D+17.0 2008: D+22.9
Not yet ingested
- Civics
- —
Market trends
- HPI YoY
- ▲ 0.69%
- Current HPI
- 242.5138
- Rent YoY
- ▲ 0.51%
- Metro
- Miami-Fort Lauderdale-Pompano Beach, FL
- State GDP YoY
- ▲ 3.28%
- F500 in state
- 36
Industry mix (Fortune 500 HQ in FL)
| Industry | F500 HQs | Revenue |
|---|---|---|
| Industrial Technology | 2 | $29B |
|
||
| Insurance | 2 | $17B |
|
||
| Retail | 1 | $60B |
|
||
| Technology Distribution | 1 | $58B |
|
||
| Homebuilding | 1 | $35B |
|
||
| Technology Manufacturing | 1 | $35B |
|
||
Price history
+9763.6% since first listed4 events — show timeline
- 2026-06-07 Listed $217,000 FSBO.com
- 2024-03-07 Rental Removed $2,000 RMLSFL
- 2024-01-27 Price Changed $2,000 RMLSFL
- 2023-12-11 Listed for Rent $2,200 RMLSFL
Cash-flow waterfall
monthlySold comps — $/sqft
last 12 mo · ≤1 miLoading sold comps…