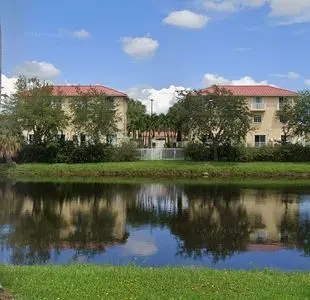
2040 NE 167th St · North Miami Beach, FL
Flood risk 8/10 · Major
- FEMA flood zone
- X (shaded)
- Chance of flooding over 30 yrs
- 0.95%
- Est. flood insurance / yr
- $507 – $1,088
Fire risk 1/10 · Minimal
- Est. fire insurance / yr
- $947 – $1,759
Heat risk 10/10 · Severe
- Hot days now (above 104°F)
- 7 days/yr
- Hot days in 30 yrs
- 27 days/yr
Wind risk 10/10 · Severe
- Chance of severe wind over 30 yrs
- 99.0%
Air-quality risk 2/10 · Minimal
- Unhealthy air days now
- 1 days/yr
- Unhealthy air days in 30 yrs
- 2 days/yr
Risk factors via First Street. Map © Google.
Why this score? — see what drove the C+ grade
The composite is a weighted blend of 9 inputs, each scored 0–100. Each bar is that input's sub-score; the figure is the points it added to the 100-point composite (weight × sub-score).
- Cash flow +25.9/30.0
- DSCR +8.7/10.0
- ARV discount +7.5/15.0
- 1% rule +6.9/10.0
- Schools +4.2/10.0
- Livability +4.1/5.0
- Rent growth +2.1/5.0
- Condition / age +1.0/5.0
- Appreciation +0.0/10.0
$369,000
🖨 Deal sheet 📄 Offer letter ✓ Due diligence
Listing remarks MLS
FOR SALE BY OWNER Beautifully Renovated 3BR/2.5BA Townhouse $369,000 Motivated seller! Recently reduced to $369,000 and priced to sell. Beautiful Mediterranean-style townhouse featuring 3 bedrooms, 2.5 bathrooms, and numerous upgrades. The home is move-in ready with impact-resistant windows and doors, a brand-new 2025 roof, and a bright open-concept layout. Features include: 3 Bedrooms / 2.5 Bathrooms New Roof (2025) Impact Windows & Doors Modern Kitchen Washer & Dryer Included Private Patio Spacious Primary Suite with Walk-In Closet & Private Balcony Assigned Parking Directly in Front of the Unit Community Pool & On-Site Management Excellent location just minutes from Aventura Mall, beaches, restaurants, shopping, and major highways. Additional Information: Annual PACE assessment approximately $2,160/year (included in property taxes) Rentals allowed great opportunity for investors or owner-occupants This home offers outstanding value compared to similar properties in the area. Serious inquiries only. Please contact me for additional information or to schedule a showing.
Key facts
- Renovated townhouse
- Community pool
- Private patio
Tags
Neighborhood map
What this means for you Summary
Snapshot
- This is a 3-bed/3.0-bath other listed at $369k. Condition is rated poor.
Deal economics
- At list price, monthly cash flow is $845 ($10k/yr) — positive.
- The deal already cash-flows at list — no discount required.
- Meets the 1% rule at list price ($4k rent vs $369k).
- Cap rate 9.3% vs local median 5.2% in North Miami Beach — top-decile yield for the area; either an underpriced asset or a hidden risk that comps aren't pricing in. Stress-test before assuming the spread holds.
Location & tenants
- Location reads 82/100 on livability (#71 in FL, #1,177 nationally) — a professional / high-income tenant draw. Strengths: commute A+, housing A+, health & safety A+; Watch: employment D+, crime F.
- Miami-Dade (suburban): math 45% / reading 54% proficiency, ranked #40 of 73 in FL (top 55%) — families likely to look elsewhere, expect single-tenant / working-renter base with shorter leases; 64% free/reduced lunch — lower-income household profile, screen leases tightly.
- Market conditions: Rents soft (-1.6%/yr); 284 active listings in the ZIP; 10,051 units permitted in Miami-Dade County in 2024 (7,758 in 5+ unit buildings).
- At $4,381/mo this rent would consume 87% of the median local household income ($61k/yr) (locally 2509% of renters already pay >50% of income on rent) — very limited rent-growth headroom before tenants either downsize or default.
Forward outlook
- Local home prices are declining (-3.0%/yr); year-one equity from $3k of loan paydown is wiped out by about $11k of value loss. Plan a longer hold.
- Miami-Dade County population projected at +28% by 2050 — long-run rental-demand tailwind backs the buy-and-hold thesis.
Negotiation context
- Only 9 days on market — expect competitive offers; lowballing is unlikely to land.
- 2 sale attempts with the ask held roughly flat each time — persistent listings suggest the price (not the market) is what's stuck; bring a comps-based counter.
Risks & watch-outs
- Watch-outs: flood insurance adds $66/mo.
- Climate carrying-cost: severe flood risk; severe wind risk, 99% chance of damaging wind over 30y; extreme-heat days projected 7→27/yr by 2055 (HVAC capex compounding) — expect insurance premiums to compound above CPI over the hold.
Questions for the listing agent
- Have any recent inspections been done? Can we get a copy of the seller's disclosures and any deferred-maintenance estimates?
- What's the actual annual flood-insurance premium (NFIP or private), and is the property in a SFHA with mandatory coverage?
- Is there a deadline driving the sale (1031 exchange, divorce, estate, relocation)? That informs how much negotiation room exists.
- Crime grade is F in this area — have there been break-ins, vandalism, or insurance claims at this property in the last 3 years? What carrier currently insures it and at what premium?
- What's the average days-on-market for RENTAL listings here right now (not sales)? A rising rental-DOM trend means longer vacancies and softer asking-rent achievability than the comps imply.
- What's the recent tenant-quality profile in this submarket — average credit score on applications, eviction rate, late-payment / NSF rate, and stable-employment percentage? A property-management company in the area should have these aggregated.
- How much new for-sale + rental construction is in the pipeline within 1–3 miles? Heavy new supply typically softens prices + rents 12–24 months out; constrained supply supports both.
Investment metrics
- 1% rule
- 1.19% ✓
- Cap rate
- 9.26%
- Cash-on-cash
- 10.58%
- DSCR
- 1.47
- GRM
- 7.0
CMA / ARV
No comps found within radius.
Projected returns pro-forma
-3.0% appreciation · 0.0% rent growth · sell at horizon
- IRR
- -5.0%
- Equity multiple
- 0.82×
- Total profit
- $-18,734
- Equity at exit
- $55,019
- IRR
- 0.6%
- Equity multiple
- 1.04×
- Total profit
- $3,769
- Equity at exit
- $31,904
Cash invested: $103,320 (down + closing). Projections, not guarantees.
Landlord ↔ Tenant lean methodology
- Overall (STATE)
- 87 Strongly Landlord-Friendly
- State Florida
- 87 Strongly Landlord-Friendly · R+3
- County
- — inherits STATE
- City
- — inherits STATE
ZIP-level market 33162
- Rents YoY
- -1.6%
- Active inventory
- 284
- Price-to-rent
- 7.0×
Monthly cashflow live
- Estimated rent
- $4,381 medium interval (Pro) →
- Mortgage (P&I)
- −$1,935
- Tax est. 1.5%
- −$461 /mo · $5,535/yr
- Insurance
- −$154
- Flood insurance flood zone
- −$66 /mo · $798/yr
- HOA
- −$0
- Vacancy / Maint / Mgmt
- −$920
- Net cashflow
- $845
Break-even live
UW: 25.0% down · 7.5% · 30yr · 1.5% tax · 5.0% vac · 8.0% maint · 8.0% mgmt
Financing live
Cash to close
- Down payment
- $92,250
- Closing costs
- $11,070
- Reserves months
- —
- Total cash needed
- —
Loan-product check · same deal, 3 products live
Conventional
25% down · 7.5% · 30yr
- Down + closing
- —
- Monthly P&I
- —
- Monthly cashflow
- —
- DSCR
- —
- Eligible?
- —
Personal DTI + credit; lowest rate.
DSCR
20% down · 8.5% · 30yr
- Down + closing
- —
- Monthly P&I
- —
- Monthly cashflow
- —
- DSCR
- —
- Eligible?
- —
No personal income docs; deal must DSCR.
Hard money
10% down · 12.0% · 12mo
- Down + closing
- —
- Monthly P&I
- —
- Monthly cashflow
- —
- DSCR
- —
- Eligible?
- —
Short-term bridge; refi at stabilization.
Listing history 7 events
-
2026-06-18days on market $369,000 Active 9 DOM
-
2026-06-17pricedays on market $369,000 Active 8 DOM
-
2026-06-16days on market $369,900 Active 7 DOM
-
2026-06-15days on market $369,900 Active 6 DOM
-
2026-06-13days on market $369,900 Active 4 DOM
-
2026-06-10remarks 663-char remark
-
2026-06-10$369,900 Active 1 DOM
ⓘ Source: listings_history table (triggers on properties + properties_extension) + one-shot
backfill from property_details.listing_events for pre-trigger history.
Climate risk First Street
- Flood 8/10 Severe FEMA zone X (shaded) · 95% chance over 30 yrs
- Wildfire 1/10 Low
- Heat 10/10 Extreme 7 d/yr ≥104°F today · 27 d/yr by 30 yrs out
- Wind 10/10 Extreme 99% chance of damaging wind over 30 yrs
- Air quality 2/10 Low 1 unhealthy d/yr today · 2 by 30 yrs out
Nearby sold comps map
Loading sold comps map…
Walkable amenities ~0.75 mi
Loading nearby amenities…
Taxation est. · year 1
- Rental income
- $52,574
- − Mortgage interest
- −$20,670
- − Property taxes
- −$5,535
- − Insurance
- −$2,642
- − Repairs & maintenance
- −$4,206
- − Management
- −$4,206
- − Depreciation
- −$10,735
- Taxable income
- $4,581
- Est. tax owed @ 24.0%
- −$1,099
- After-tax cash flow
- $9,036/yr
For passive investors: Depreciation is non-cash, so a rental often shows a tax loss while cash-flowing — sheltering income. Rental losses are passive: they offset passive income freely, and up to $25,000/yr can offset ordinary (W-2) income if you actively participate and your MAGI is under $100k (phasing out to $0 by $150k); unused losses carry forward. On sale, claimed depreciation is recaptured at up to 25%, and gains may owe capital-gains tax (a 1031 exchange can defer both). Figures are a year-1 estimate at your 24.0% rate — not tax advice; consult a CPA.
Condition & rehab AI · 1 photo
This property requires extensive repairs and updates across all systems and areas, significantly impacting its current condition and value. Immediate action is needed to address the poor condition and improve its marketability.
Repairs flagged
- Major Kitchen — No photos of the kitchen show any condition.
- Major Bathrooms — No photos of the bathrooms show any condition.
- Major Roof — No photos of the roof show any condition.
- Major Exterior — No photos of the exterior show any condition.
- Major Flooring — No photos of the flooring show any condition.
- Major Interior walls/paint — No photos of the interior walls/paint show any condition.
- Major Windows — No photos of the windows show any condition.
- Major Foundation/structure — No photos of the foundation/structure show any condition.
- Major HVAC/mechanicals — No photos of the HVAC/mechanicals show any condition.
- Major Landscaping/curb appeal — No photos of the landscaping/curb appeal show any condition.
Value-add opportunities
- Resale New kitchen appliances — Modern kitchen appliances can significantly enhance the home's appeal and functionality.
- Resale New flooring — New flooring can improve the home's appearance and increase its market value.
- Resale Paint interior walls — Fresh paint can make the home look more inviting and modern.
- Resale Replace windows and doors — New windows and doors can improve energy efficiency and enhance the home's curb appeal.
- Both Landscaping and curb appeal — A well-maintained yard and landscaping can increase both resale and rental value.
- Both HVAC system upgrade — A new HVAC system can improve comfort and energy efficiency, benefiting both resale and rental markets.
- Extensive Structural repairs — Major structural repairs are necessary to ensure the home's safety and stability, which is crucial for both resale and rental value.
Renovation cost estimate screening
| Repair item | Severity | Est. cost |
|---|---|---|
| Kitchen · No photos of the kitchen show any condition. | Major | $15,000–50,000 |
| Bathrooms · No photos of the bathrooms show any condition. | Major | $15,000–50,000 |
| Roof · No photos of the roof show any condition. | Major | $15,000–50,000 |
| Exterior · No photos of the exterior show any condition. | Major | $15,000–50,000 |
| Flooring · No photos of the flooring show any condition. | Major | $15,000–50,000 |
| Interior walls/paint · No photos of the interior walls/paint show any condition. | Major | $15,000–50,000 |
| Windows · No photos of the windows show any condition. | Major | $15,000–50,000 |
| Foundation/structure · No photos of the foundation/structure show any condition. | Major | $15,000–50,000 |
| HVAC/mechanicals · No photos of the HVAC/mechanicals show any condition. | Major | $15,000–50,000 |
| Landscaping/curb appeal · No photos of the landscaping/curb appeal show any condition. | Major | $15,000–50,000 |
| Total estimated repair cost · 10 items | $150,000–500,000 |
Value-add ROI direction
- Resale New kitchen appliances — Modern kitchen appliances can significantly enhance the home's appeal and functionality. ↑
- Resale New flooring — New flooring can improve the home's appearance and increase its market value. ↑
- Resale Paint interior walls — Fresh paint can make the home look more inviting and modern. ↑
- Resale Replace windows and doors — New windows and doors can improve energy efficiency and enhance the home's curb appeal. ↑
- Both Landscaping and curb appeal — A well-maintained yard and landscaping can increase both resale and rental value. ↑
- Both HVAC system upgrade — A new HVAC system can improve comfort and energy efficiency, benefiting both resale and rental markets. ↑
- Extensive Structural repairs — Major structural repairs are necessary to ensure the home's safety and stability, which is crucial for both resale and rental value. ↑
ⓘ Cost ranges are severity-bucket heuristics (US national rule-of-thumb). Get contractor quotes + a written scope before underwriting a rehab budget.
Schools (NCES district)
- District
- Miami-Dade
- NCES district ID
- 1200390
- Math proficiency
- 45% ▼ -16.00%
- Reading proficiency
- 54% ▼ -5.00%
- Median HH income
- $43,928
- Composite
- 41.76/100
- National rank
- #3397
- State rank
- #40 of 73 in FL
Livability — North Miami Beach
- Score
- 82/100
- State rank
- #71
- US rank
- #1177
Category grades
Schools grade is shown separately in the Schools card above.
Census & demographics
- Census place
- North Miami Beach, FL
- County
- Miami-Dade County · 2,697,751 people
- City population
- 90,324
- Metro
- Miami-Fort Lauderdale-Pompano Beach, FL
- Population (ZIP)
- 46,606
- Household income
- $60,692
- Rent vs Own
- Severe rent burden
- 2509.0
Population outlook (Miami-Dade County) Hauer SSP2
- Today (2025)
- 3,126,439 people
- By 2030
- 3,325,765 · +6.4%
- By 2040
- 3,697,561 · +18.3%
- By 2050
- 4,012,134 · +28.3%
- By 2075
- 4,605,612 · +47.3%
- By 2100
- 4,866,598 · +55.7%
Race, ethnicity, and origin ACS 2023
- Neighborhood character
- Diverse neighborhood (Simpson 0.62)
- Race & ethnicity
- Black 53% Hispanic / Latino 30% Two or more races 15% White 12% Asian 2%
- Hispanic origin (detail)
- Puerto Rican 4% Cuban 7% Dominican 3%
- Common ancestry
- Hispanic 31% Romanian 1% Scotch-Irish 1%
- Foreign-born
- 52% · Canada, Jamaica, Dominican Republic
- Languages at home
- 29% English-only · French/Haitian/Cajun 35% Spanish 30% Other Indo-European 2%
Political lean MEDSL · Miami-Dade
- 2024 margin
- R (+11.4) · D 43.9% · R 55.4%
- 2008→2024 swing
- -27.6pp toward R · 2008: 16.1pp · 2024: -11.4pp
- All cycles
- 2024: R+11.4 2020: D+7.3 2016: D+29.6 2012: D+23.7 2008: D+16.1
Not yet ingested
- Civics
- —
Market trends
- HPI YoY
- ▼ -445.57%
- Current HPI
- 596.6178
- Rent YoY
- ▼ -1.59%
- Metro
- Miami-Fort Lauderdale-Pompano Beach, FL
- State GDP YoY
- ▲ 3.28%
- F500 in state
- 36
Industry mix (Fortune 500 HQ in FL)
| Industry | F500 HQs | Revenue |
|---|---|---|
| Industrial Technology | 2 | $29B |
|
||
| Insurance | 2 | $17B |
|
||
| Retail | 1 | $60B |
|
||
| Technology Distribution | 1 | $58B |
|
||
| Homebuilding | 1 | $35B |
|
||
| Technology Manufacturing | 1 | $35B |
|
||
Price history
+0.2% since first listed2 events — show timeline
- 2026-06-10 Listed $369,900 FSBO.com
- 2026-06-09 Listed $369,000 ForSaleByOwner.com
Cash-flow waterfall
monthlySold comps — $/sqft
last 12 mo · ≤1 miLoading sold comps…