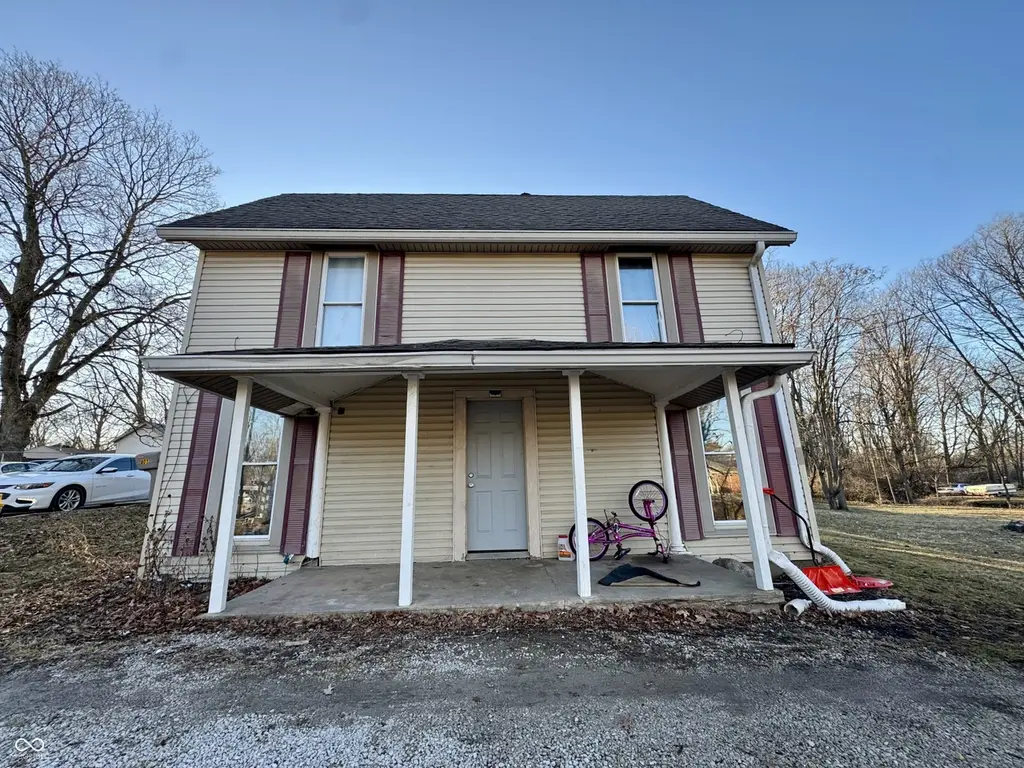
810 E Elmore St · Crawfordsville, IN
Flood risk 6/10 · Moderate
- FEMA flood zone
- X (unshaded)
- Chance of flooding over 30 yrs
- 0.73%
- Est. flood insurance / yr
- $473 – $860
Fire risk 1/10 · Minimal
- Est. fire insurance / yr
- $717 – $1,331
Heat risk 3/10 · Minor
- Hot days now (above 101°F)
- 7 days/yr
- Hot days in 30 yrs
- 18 days/yr
Wind risk 2/10 · Minimal
- Chance of severe wind over 30 yrs
- 1.0%
Air-quality risk 2/10 · Minimal
- Unhealthy air days now
- 1 days/yr
- Unhealthy air days in 30 yrs
- 2 days/yr
Risk factors via First Street. Map © Google.
Why this score? — see what drove the B- grade
The composite is a weighted blend of 9 inputs, each scored 0–100. Each bar is that input's sub-score; the figure is the points it added to the 100-point composite (weight × sub-score).
- Cash flow +24.6/30.0
- ARV discount +15.0/15.0
- DSCR +7.9/10.0
- 1% rule +7.6/10.0
- Livability +3.6/5.0
- Rent growth +3.3/5.0
- Schools +2.5/10.0
- Condition / age +2.5/5.0
- Appreciation +0.0/10.0
$115,000
🖨 Deal sheet 📄 Offer letter ✓ Due diligence
Listing remarks MLS
Rental Investment. Tenants in place. Offered with three other properties as a package. MLS 21934858, 21934859, 21934861. 24 Hour notice to show. Selling As-Is. Recent rehab inside including new AC unit.
Key facts
- Newer ac unit
- Dry branch stream
- New water heater
Tags
Property features AI
Finance
- Other: Property sits on approximately 0.46 acre (about 1/4–1/2 acre)
- HOA & community: Not a low‑maintenance lifestyle community
Exterior
- Parking: Gravel parking
- Utilities: Public water; Municipal sewer connected; No solid waste service listed
- Home design: Single family residence; Two and a half levels; Residential property
- Construction: Vinyl siding exterior; Block foundation
- Exterior features: Covered patio/porch; On a stream (waterfront); No fence
Interior
- Kitchen: Eat-in kitchen
- Bedrooms: Three bedrooms total — one on the main level and two on the upper level (Upper bedrooms: 2, Main bedrooms: 1)
- Bathrooms: One full bathroom (main level)
- Heating & cooling: Forced-air heating (natural gas); Central air conditioning
- Interior features: Eat-in kitchen; Painted woodwork; Finished basement
- Laundry & utility: Washer/dryer connections available
Neighborhood map
What this means for you Summary
Snapshot
- This is a 3-bed/1.0-bath single-family listed at $115k.
Deal economics
- At list price, monthly cash flow is $237 ($3k/yr) — positive.
- The deal already cash-flows at list — no discount required.
- Meets the 1% rule at list price ($1k rent vs $115k).
- Cap rate 8.8% vs local median 3.5% in Crawfordsville — top-decile yield for the area; either an underpriced asset or a hidden risk that comps aren't pricing in. Stress-test before assuming the spread holds.
Location & tenants
- Location reads 72/100 on livability (#118 in IN) — a middle-class / working-renter tenant base. Strengths: cost of living A+, housing A+, crime A; Watch: schools D+, commute D+, amenities F.
- Crawfordsville Community Schools (town): math 27% / reading 32% proficiency, ranked #247 of 301 in IN (top 82%) — low school quality limits family demand, transient renter base, plan for 1-2y turnover.
- Market conditions: Rents rising (+3.3%/yr); 203 active listings in the ZIP; 52 units permitted in Montgomery County in 2024 (0 in 5+ unit buildings).
Forward outlook
- Local home prices are declining (-3.0%/yr); year-one equity from $795 of loan paydown is wiped out by about $3k of value loss. Plan a longer hold.
- Montgomery County population projected to shrink 9% by 2050 — rents likely to lag national; underwrite the cash flow, not the appreciation.
Negotiation context
- Only 1 days on market — expect competitive offers; lowballing is unlikely to land.
- 5 sale attempts since 15y ago with the ask held roughly flat each time — persistent listings suggest the price (not the market) is what's stuck; bring a comps-based counter.
Risks & watch-outs
- Watch-outs: property tax is 2.7% of price; built in 1956 — expect roof / HVAC / electrical / plumbing capex.
- Climate carrying-cost: major flood risk — expect insurance premiums to compound above CPI over the hold.
Questions for the listing agent
- Built in 1956 — when were the roof, HVAC, electrical panel, plumbing, and water heater last replaced?
- Property tax is high relative to price — has the assessment been appealed recently, and will the sale trigger a re-assessment?
- Is there a deadline driving the sale (1031 exchange, divorce, estate, relocation)? That informs how much negotiation room exists.
- Schools are D-rated, which usually means shorter tenancies and higher turnover. Who's the typical renter profile here, and what's been the actual vacancy rate?
- What's the average days-on-market for RENTAL listings here right now (not sales)? A rising rental-DOM trend means longer vacancies and softer asking-rent achievability than the comps imply.
- What's the recent tenant-quality profile in this submarket — average credit score on applications, eviction rate, late-payment / NSF rate, and stable-employment percentage? A property-management company in the area should have these aggregated.
- How much new for-sale + rental construction is in the pipeline within 1–3 miles? Heavy new supply typically softens prices + rents 12–24 months out; constrained supply supports both.
Investment metrics
- 1% rule
- 1.26% ✓
- Cap rate
- 8.76%
- Cash-on-cash
- 8.83%
- DSCR
- 1.39
- GRM
- 6.6
CMA / ARV
- ARV (on-the-fly)
- $186,648
- Comps found
- 12
Show comp detail 12 sales within ~0.75 mi
| Address | Dist | Beds/Ba | Sqft | Sold | Price | $/sf | Match |
|---|---|---|---|---|---|---|---|
| 707 E Elmore St | 0.09mi | 2/1.0 (-1) | 1,782 (-4%) | 4mo | $140,000 | $79 | 81 |
| 604 Robinson St | 0.43mi | 3/2.0 | 1,850 (+0%) | 9mo | $249,000 | $135 | 68 |
| 508 Highland Ave | 0.25mi | 2/1.0 (-1) | 1,900 (+3%) | 13mo | $149,000 | $78 | 68 |
| 1105 Danville Ave | 0.21mi | 4/1.0 (+1) | 1,746 (-6%) | 13mo | $170,000 | $97 | 65 |
| 501 S Grace Ave | 0.71mi | 2/1.0 (-1) | 1,858 (+0%) | 2mo | $165,000 | $89 | 59 |
| 605 Tuttle Ave | 0.23mi | 4/1.5 (+1) | 1,584 (-14%) | 1mo | $160,000 | $101 | 57 |
| 406 Louise Ave | 0.66mi | 3/2.5 | 1,908 (+3%) | 2mo | $223,000 | $117 | 56 |
| 103 E Chestnut St | 0.56mi | 3/1.0 | 2,016 (+9%) | 7mo | $110,000 | $55 | 53 |
| 1213 Durham Dr | 0.60mi | 3/1.5 | 1,618 (-12%) | 3mo | $249,000 | $154 | 47 |
| 508 Wilson Ave | 0.56mi | 3/1.5 | 1,680 (-9%) | 14mo | $175,000 | $104 | 45 |
| 413 S Water St | 0.55mi | 3/2.0 | 2,088 (+13%) | 6mo | $155,000 | $74 | 43 |
| 807 E Main St | 0.63mi | 4/3.0 (+1) | 2,048 (+11%) | 8mo | $236,500 | $115 | 33 |
Match score weights: distance 35% · size 25% · config 20% · recency 20%. Top-matched comps best support the ARV.
Projected returns pro-forma
-3.0% appreciation · 3.28% rent growth · sell at horizon
- IRR
- -2.5%
- Equity multiple
- 0.91×
- Total profit
- $-3,048
- Equity at exit
- $17,147
- IRR
- 7.6%
- Equity multiple
- 1.58×
- Total profit
- $18,836
- Equity at exit
- $9,943
Cash invested: $32,200 (down + closing). Projections, not guarantees.
Landlord ↔ Tenant lean methodology
- Overall (STATE)
- 90 Strongly Landlord-Friendly
- State Indiana
- 90 Strongly Landlord-Friendly · R+11
- County
- — inherits STATE
- City
- — inherits STATE
ZIP-level market 47933
- Home prices YoY
- -27.1%
- Rents YoY
- 3.3%
- Active inventory
- 203
- Price-to-rent
- 6.6×
Monthly cashflow live
- Estimated rent
- $1,450 medium interval (Pro) →
- Mortgage (P&I)
- −$603
- Tax from tax record
- −$258 /mo · $3,094/yr
- Insurance
- −$48
- HOA
- −$0
- Vacancy / Maint / Mgmt
- −$305
- Net cashflow
- $237
Break-even live
UW: 25.0% down · 7.5% · 30yr · 1.5% tax · 5.0% vac · 8.0% maint · 8.0% mgmt
Financing live
Cash to close
- Down payment
- $28,750
- Closing costs
- $3,450
- Reserves months
- —
- Total cash needed
- —
Loan-product check · same deal, 3 products live
Conventional
25% down · 7.5% · 30yr
- Down + closing
- —
- Monthly P&I
- —
- Monthly cashflow
- —
- DSCR
- —
- Eligible?
- —
Personal DTI + credit; lowest rate.
DSCR
20% down · 8.5% · 30yr
- Down + closing
- —
- Monthly P&I
- —
- Monthly cashflow
- —
- DSCR
- —
- Eligible?
- —
No personal income docs; deal must DSCR.
Hard money
10% down · 12.0% · 12mo
- Down + closing
- —
- Monthly P&I
- —
- Monthly cashflow
- —
- DSCR
- —
- Eligible?
- —
Short-term bridge; refi at stabilization.
Listing history 2 events
-
2026-06-09remarks 699-char remark
-
2026-06-09$115,000 Pending 1 DOM
ⓘ Source: listings_history table (triggers on properties + properties_extension) + one-shot
backfill from property_details.listing_events for pre-trigger history.
Tax reassessment forecast IN · Partial reset (capped growth)
- Current annual tax
- $3,094 · $258/mo
- Projected year-2 tax
- $3,094 · $258/mo
- Expected delta
- $0/yr ($0/mo · 0.0%)
ⓘ Screening estimate from a state-policy table — verify with the county assessor before closing.
Climate risk First Street
- Flood 6/10 Major FEMA zone X (unshaded) · 73% chance over 30 yrs
- Wildfire 1/10 Low
- Heat 3/10 Moderate 7 d/yr ≥101°F today · 18 d/yr by 30 yrs out
- Wind 2/10 Low 100% chance of damaging wind over 30 yrs
- Air quality 2/10 Low 1 unhealthy d/yr today · 2 by 30 yrs out
Nearby sold comps map
Loading sold comps map…
Walkable amenities ~0.75 mi
Loading nearby amenities…
Taxation est. · year 1
- Rental income
- $17,403
- − Mortgage interest
- −$6,442
- − Property taxes
- −$3,094
- − Insurance
- −$575
- − Repairs & maintenance
- −$1,392
- − Management
- −$1,392
- − Depreciation
- −$3,345
- Taxable income
- $1,162
- Est. tax owed @ 24.0%
- −$279
- After-tax cash flow
- $2,563/yr
For passive investors: Depreciation is non-cash, so a rental often shows a tax loss while cash-flowing — sheltering income. Rental losses are passive: they offset passive income freely, and up to $25,000/yr can offset ordinary (W-2) income if you actively participate and your MAGI is under $100k (phasing out to $0 by $150k); unused losses carry forward. On sale, claimed depreciation is recaptured at up to 25%, and gains may owe capital-gains tax (a 1031 exchange can defer both). Figures are a year-1 estimate at your 24.0% rate — not tax advice; consult a CPA.
Schools (NCES district)
- District
- Crawfordsville Community Schools
- NCES district ID
- 1802460
- Math proficiency
- 27% ▼ -8.00%
- Reading proficiency
- 32% ▼ -6.00%
- Median HH income
- $39,087
- Composite
- 24.73/100
- National rank
- #7606
- State rank
- #247 of 301 in IN
Livability — Crawfordsville
- Score
- 72/100
- State rank
- #118
- US rank
- #6376
Category grades
Schools grade is shown separately in the Schools card above.
Census & demographics
- Census place
- Crawfordsville, IN
- County
- Montgomery County · 28,357 people
- City population
- 28,357
- Metro
- Crawfordsville, IN
- Population (ZIP)
- 28,357
- Household income
- $68,130
- Rent vs Own
- Severe rent burden
- 464.0
Population outlook (Montgomery County) Hauer SSP2
- Today (2025)
- 37,893 people
- By 2030
- 37,539 · -0.9%
- By 2040
- 36,536 · -3.6%
- By 2050
- 34,454 · -9.1%
- By 2075
- 28,852 · -23.9%
- By 2100
- 21,145 · -44.2%
Race, ethnicity, and origin ACS 2023
- Neighborhood character
- Predominantly White (88%)
- Race & ethnicity
- White 88% Hispanic / Latino 7% Two or more races 7%
- Hispanic origin (detail)
- Mexican 5% Puerto Rican 2%
- Common ancestry
- Slovak 2% Lithuanian 2% Romanian 2%
- Foreign-born
- 4% · Canada
- Languages at home
- 93% English-only · Spanish 6%
Political lean MEDSL · Montgomery
- 2024 margin
- Solid R (+48.2) · D 24.9% · R 73.2% · Other 1.9%
- 2008→2024 swing
- -28.3pp toward R · 2008: -19.9pp · 2024: -48.2pp
- All cycles
- 2024: R+48.2 2020: R+49.1 2016: R+50.9 2012: R+38.5 2008: R+19.9
Not yet ingested
- Civics
- —
Market trends
- HPI YoY
- ▼ -78.91%
- Current HPI
- 211.6864
- Rent YoY
- ▲ 3.28%
- Metro
- Crawfordsville, IN
- State GDP YoY
- ▲ 2.90%
- F500 in state
- 18
Industry mix (Fortune 500 HQ in IN)
| Industry | F500 HQs | Revenue |
|---|---|---|
| Industrial Machinery | 2 | $37B |
|
||
| Healthcare | 1 | $177B |
|
||
| Pharmaceuticals | 1 | $45B |
|
||
| Metals / Steel | 1 | $18B |
|
||
| Agriculture | 1 | $17B |
|
||
| Packaging | 1 | $12B |
|
||
Price history
+389.4% since first listed12 events — show timeline
- 2026-06-09 Pending — MIBOR as Distributed by MLS Grid
- 2026-06-08 Listed $115,000 MIBOR as Distributed by MLS Grid
- 2025-08-27 Listing Removed — MIBOR as Distributed by MLS Grid
- 2025-04-21 Relisted — MIBOR as Distributed by MLS Grid
- 2025-04-07 Pending — MIBOR as Distributed by MLS Grid
- 2025-03-14 Price Changed $154,900 MIBOR as Distributed by MLS Grid
- 2025-02-27 Listed $159,000 MIBOR as Distributed by MLS Grid
- 2023-09-01 Sold (MLS) $103,750 MIBOR as Distributed by MLS Grid
- 2023-08-04 Pending — MIBOR as Distributed by MLS Grid
- 2023-08-01 Listed $110,000 MIBOR as Distributed by MLS Grid
- 2012-04-14 Listing Removed — MIBOR as Distributed by MLS Grid
- 2011-10-17 Listed $23,500 MIBOR as Distributed by MLS Grid
Property tax history
+8.0%/yrLatest (2025): $3,094 · +82.5% YoY. Source: county tax records.
Cash-flow waterfall
monthlySold comps — $/sqft
last 12 mo · ≤1 miLoading sold comps…