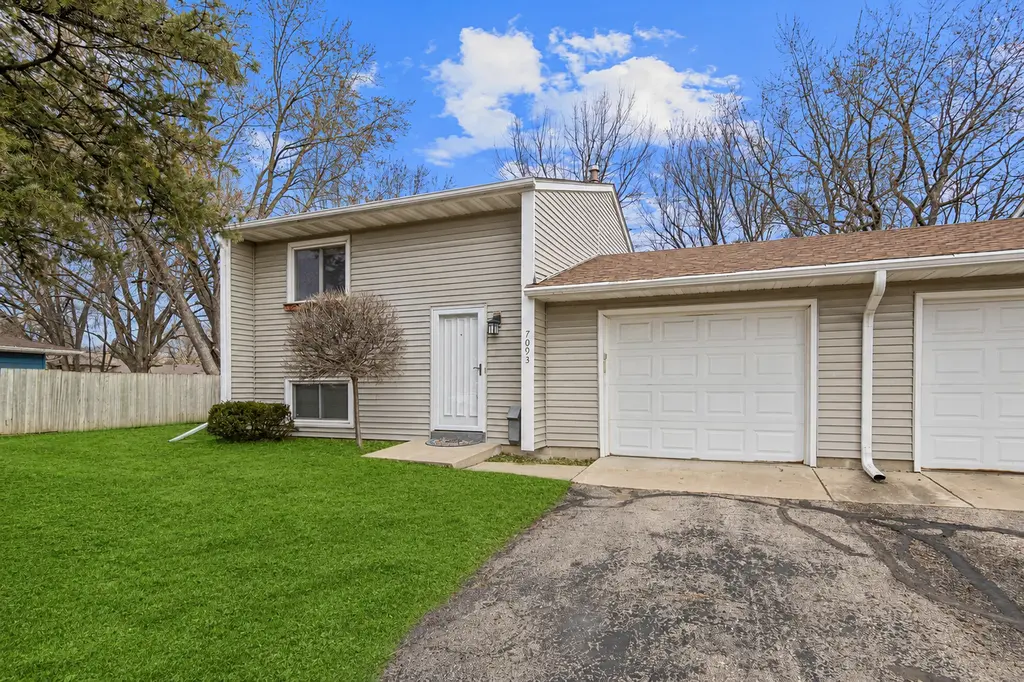
7093 146th St W · Apple Valley, MN
Flood risk 1/10 · Minimal
- FEMA flood zone
- X (unshaded)
- Chance of flooding over 30 yrs
- 0.0%
- Est. flood insurance / yr
- $507 – $1,088
Fire risk 1/10 · Minimal
- Est. fire insurance / yr
- $888 – $1,650
Heat risk 2/10 · Minimal
- Hot days now (above 99°F)
- 7 days/yr
- Hot days in 30 yrs
- 14 days/yr
Wind risk 2/10 · Minimal
- Chance of severe wind over 30 yrs
- —
Air-quality risk 2/10 · Minimal
- Unhealthy air days now
- 1 days/yr
- Unhealthy air days in 30 yrs
- 1 days/yr
Risk factors via First Street. Map © Google.
Why this score? — see what drove the C- grade
The composite is a weighted blend of 9 inputs, each scored 0–100. Each bar is that input's sub-score; the figure is the points it added to the 100-point composite (weight × sub-score).
- Cash flow +17.4/30.0
- ARV discount +7.5/15.0
- 1% rule +5.6/10.0
- DSCR +5.4/10.0
- Schools +4.9/10.0
- Livability +4.3/5.0
- Rent growth +3.3/5.0
- Condition / age +2.5/5.0
- Appreciation +0.0/10.0
$234,900
🖨 Deal sheet 📄 Offer letter ✓ Due diligence
Listing remarks MLS
Gorgeous Remodeled Townhome! Seller spent $1000's in upgrades. Seller used 2nd bedroom as walk-in closet. This house is conveniently located. Easy access to Cedar Ave. Close to nearby parks, schools and shopping centers. Buyer and agent to verify all measurements. A rare opportunity!
Key facts
- Newer furnace
- Attached garage
- Large backyard
Tags
Property features AI
Finance
- Other: Living area approximately 1,120 sq ft (600 above grade, 520 below grade)
- HOA & community: HOA managed by RSP Management; Monthly association fee of $265 covering lawn care, snow removal, professional management and other services
Exterior
- Parking: Attached garage (1 car), approximately 12 x 25
- Utilities: City water connected; City sewer connected; Natural gas
- Home design: Residential property; Attached property; Split entry (bi-level) with multiple levels
- Construction: Other foundation
- Exterior features: Vinyl exterior; Deck
Interior
- Kitchen: Kitchen (upper level)
- Bedrooms: 2 bedrooms (one on lower level, one on lower level); Additional flex room
- Bathrooms: 1 full bathroom
- Heating & cooling: Forced air heating; Central air conditioning
- Interior features: Finished basement; Split entry (bi-level) layout
Neighborhood map
What this means for you Summary
Snapshot
- This is a 4-bed/2.0-bath townhouse listed at $235k.
Deal economics
- At list price, monthly cash flow is $176 ($2k/yr) — positive.
- The deal already cash-flows at list — no discount required.
- Meets the 1% rule at list price ($2k rent vs $235k).
- Cap rate 7.2% vs local median 4.0% in Apple Valley — top-decile yield for the area; either an underpriced asset or a hidden risk that comps aren't pricing in. Stress-test before assuming the spread holds.
Location & tenants
- Location reads 86/100 on livability (#10 in MN, #379 nationally) — a professional / high-income tenant draw. Strengths: commute A+, employment A+, housing A+; Watch: amenities F.
- Rosemount-Apple Valley-Eagan (suburban): math 50% / reading 58% proficiency, ranked #58 of 301 in MN (top 19%) — acceptable for families but not a draw, mixed tenant base, ~2y average lease; only 18% free/reduced lunch — higher-income household profile.
- Market conditions: Rents rising (+3.3%/yr); 277 active listings in the ZIP; 6 comparable units currently listed for rent nearby; rentals leasing fast (median 3d on market — plan ~1-2 weeks tenant-placement turnaround); solid renter incomes; 2,134 units permitted in Dakota County in 2024 (898 in 5+ unit buildings).
- This rent runs 31% of the median local income ($98k/yr) — at the standard rent-burdened threshold; future hikes will face affordability resistance.
Forward outlook
- Local home prices are declining (-3.0%/yr); year-one equity from $2k of loan paydown is wiped out by about $7k of value loss. Plan a longer hold.
- Dakota County population projected at +11% by 2050 — modest demand growth; plan on rents tracking national, not racing it.
Negotiation context
- Only 14 days on market — expect competitive offers; lowballing is unlikely to land.
- 2 sale attempts since 2y ago; this cycle's ask has dropped $41k (15%) from the opening price — seller is motivated, your offer sets the floor, not the list.
Questions for the listing agent
- Built in 1971 — when were the roof, HVAC, electrical panel, plumbing, and water heater last replaced?
- What does the HOA fee cover, when was the last increase, and are there any pending special assessments or reserve-fund shortfalls?
- Is there a deadline driving the sale (1031 exchange, divorce, estate, relocation)? That informs how much negotiation room exists.
- Schools are B-rated — typically a magnet for longer-tenancy family renters. What's the average tenant stay here, and is there a school-zone premium baked into asking?
- What's the average days-on-market for RENTAL listings here right now (not sales)? A rising rental-DOM trend means longer vacancies and softer asking-rent achievability than the comps imply.
- What's the recent tenant-quality profile in this submarket — average credit score on applications, eviction rate, late-payment / NSF rate, and stable-employment percentage? A property-management company in the area should have these aggregated.
- How much new for-sale + rental construction is in the pipeline within 1–3 miles? Heavy new supply typically softens prices + rents 12–24 months out; constrained supply supports both.
Investment metrics
- 1% rule
- 1.06% ✓
- Cap rate
- 7.19%
- Cash-on-cash
- 3.20%
- DSCR
- 1.14
- GRM
- 7.9
CMA / ARV
No comps found within radius.
Projected returns pro-forma
-3.0% appreciation · 3.27% rent growth · sell at horizon
- IRR
- -10.9%
- Equity multiple
- 0.60×
- Total profit
- $-26,064
- Equity at exit
- $35,024
- IRR
- -1.1%
- Equity multiple
- 0.93×
- Total profit
- $-4,921
- Equity at exit
- $20,310
Cash invested: $65,772 (down + closing). Projections, not guarantees.
Landlord ↔ Tenant lean methodology
- Overall (STATE)
- 46 Balanced
- State Minnesota
- 46 Balanced · D+2
- County
- — inherits STATE
- City
- — inherits STATE
ZIP-level market 55124
- Rents YoY
- 3.3%
- Active inventory
- 277
- Price-to-rent
- 7.9×
Monthly cashflow live
- Estimated rent
- $2,493 high interval (Pro) →
- Mortgage (P&I)
- −$1,232
- Tax from tax record
- −$199 /mo · $2,390/yr
- Insurance
- −$98
- HOA
- −$265
- Vacancy / Maint / Mgmt
- −$524
- Net cashflow
- $176
Break-even live
UW: 25.0% down · 7.5% · 30yr · 1.5% tax · 5.0% vac · 8.0% maint · 8.0% mgmt
Financing live
Cash to close
- Down payment
- $58,725
- Closing costs
- $7,047
- Reserves months
- —
- Total cash needed
- —
Loan-product check · same deal, 3 products live
Conventional
25% down · 7.5% · 30yr
- Down + closing
- —
- Monthly P&I
- —
- Monthly cashflow
- —
- DSCR
- —
- Eligible?
- —
Personal DTI + credit; lowest rate.
DSCR
20% down · 8.5% · 30yr
- Down + closing
- —
- Monthly P&I
- —
- Monthly cashflow
- —
- DSCR
- —
- Eligible?
- —
No personal income docs; deal must DSCR.
Hard money
10% down · 12.0% · 12mo
- Down + closing
- —
- Monthly P&I
- —
- Monthly cashflow
- —
- DSCR
- —
- Eligible?
- —
Short-term bridge; refi at stabilization.
Rent comps 6 comps
| Address | Beds | Baths | Sqft | Rent | $/sqft | DOM | Units | Dist |
|---|---|---|---|---|---|---|---|---|
| 14650 Foliage Ave Saint Paul, MN | 3.0 | 1.0–2.0 | 978 | $2,661 | $2.72 | 3d | 23 | 0.54mi |
| 6859 152nd St W Apple Valley, MN | 1.0–3.0 | 1.0–2.0 | 1062 | $2,470 | $2.32 | 2d | 10 | 0.63mi |
| 15600 Galaxie Ave Saint Paul, MN | 1.0–3.0 | 1.0–2.0 | 1244 | $1,935 | $1.55 | 4d | 4 | 0.98mi |
| 15734 Foliage Ave Saint Paul, MN | 1.0–3.0 | 1.0–2.0 | 1042 | $2,136 | $2.05 | 2d | 13 | 1.22mi |
| 7472 157th St W Apple Valley, MN | 1.0–3.0 | 1.0–2.0 | 1031 | $1,750 | $1.70 | 2d | 2 | 1.30mi |
| 15782 Flackwood Trl Apple Valley, MN | 3.0 | 1.5 | 1400 | $1,995 | $1.43 | 20d | 1 | 1.45mi |
HOA detail
- Monthly dues
- $265 · $3,180/yr
Listing history 22 events
-
2026-06-18days on market $234,900 Active 14 DOM
-
2026-06-17days on market $234,900 Active 13 DOM
-
2026-06-16days on market $234,900 Active 12 DOM
-
2026-06-15days on market $234,900 Active 11 DOM
-
2026-06-13days on market $234,900 Active 9 DOM
-
2026-06-13days on market $234,900 Active 8 DOM
-
2026-06-09days on market $234,900 Active 5 DOM
-
2026-06-08days on market $234,900 Active 4 DOM
-
2026-06-07days on market $234,900 Active 3 DOM
-
2026-06-04remarks 677-char remark
-
2026-06-04pricedays on market $234,900 Active 1 DOM
-
2026-06-01days on market $249,000 Active 67 DOM
-
2026-05-31days on market $249,000 Active 66 DOM
-
2026-05-07price $249,000
-
2026-04-14price $255,000
-
2026-03-26$276,000 Active
-
2024-07-31soldstatus $228,000
-
2024-06-28soldstatus $228,000 Sold 284-char remark
Show marketing remark (284 chars)
Gorgeous Remodeled Townhome! Seller spent $1000's in upgrades. Seller used 2nd bedroom as walk-in closet. This house is conveniently located. Easy access to Cedar Ave. Close to nearby parks, schools and shopping centers. Buyer and agent to verify all measurements. A rare opportunity!
-
2024-06-08status Pending 284-char remark
Show marketing remark (284 chars)
Gorgeous Remodeled Townhome! Seller spent $1000's in upgrades. Seller used 2nd bedroom as walk-in closet. This house is conveniently located. Easy access to Cedar Ave. Close to nearby parks, schools and shopping centers. Buyer and agent to verify all measurements. A rare opportunity!
-
2024-04-21historical Contingent - Subject to Statutory Rescission 284-char remark
Show marketing remark (284 chars)
Gorgeous Remodeled Townhome! Seller spent $1000's in upgrades. Seller used 2nd bedroom as walk-in closet. This house is conveniently located. Easy access to Cedar Ave. Close to nearby parks, schools and shopping centers. Buyer and agent to verify all measurements. A rare opportunity!
-
2024-04-15$225,000 Active 284-char remark
Show marketing remark (284 chars)
Gorgeous Remodeled Townhome! Seller spent $1000's in upgrades. Seller used 2nd bedroom as walk-in closet. This house is conveniently located. Easy access to Cedar Ave. Close to nearby parks, schools and shopping centers. Buyer and agent to verify all measurements. A rare opportunity!
-
1989-05-01soldstatus $52,000
ⓘ Source: listings_history table (triggers on properties + properties_extension) + one-shot
backfill from property_details.listing_events for pre-trigger history.
Tax reassessment forecast MN · Partial reset (capped growth)
- Current annual tax
- $2,390 · $199/mo
- Projected year-2 tax
- $2,510 · $209/mo
- Expected delta
- +$120/yr (+$10/mo · 5.0%)
ⓘ Screening estimate from a state-policy table — verify with the county assessor before closing.
Climate risk First Street
- Flood 1/10 Low FEMA zone X (unshaded) · 0% chance over 30 yrs
- Wildfire 1/10 Low
- Heat 2/10 Low 7 d/yr ≥99°F today · 14 d/yr by 30 yrs out
- Wind 2/10 Low
- Air quality 2/10 Low 1 unhealthy d/yr today · 1 by 30 yrs out
Nearby sold comps map
Loading sold comps map…
Walkable amenities ~0.75 mi
Loading nearby amenities…
Taxation est. · year 1
- Rental income
- $29,915
- − Mortgage interest
- −$13,158
- − Property taxes
- −$2,390
- − Insurance
- −$1,174
- − Repairs & maintenance
- −$2,393
- − Management
- −$2,393
- − HOA
- −$3,180
- − Depreciation
- −$6,833
- Taxable loss
- −$1,607
- Est. tax savings @ 24.0%
- +$386
- After-tax cash flow
- $2,492/yr
For passive investors: Depreciation is non-cash, so a rental often shows a tax loss while cash-flowing — sheltering income. Rental losses are passive: they offset passive income freely, and up to $25,000/yr can offset ordinary (W-2) income if you actively participate and your MAGI is under $100k (phasing out to $0 by $150k); unused losses carry forward. On sale, claimed depreciation is recaptured at up to 25%, and gains may owe capital-gains tax (a 1031 exchange can defer both). Figures are a year-1 estimate at your 24.0% rate — not tax advice; consult a CPA.
Schools (NCES district)
- District
- Rosemount-Apple Valley-Eagan
- NCES district ID
- 2732390
- Math proficiency
- 50% ▼ -14.00%
- Reading proficiency
- 58% ▼ -7.00%
- Median HH income
- $85,559
- Composite
- 49.48/100
- National rank
- #2000
- State rank
- #58 of 301 in MN
Livability — Apple Valley
- Score
- 86/100
- State rank
- #10
- US rank
- #379
Category grades
Schools grade is shown separately in the Schools card above.
Census & demographics
- Census place
- Apple Valley, MN
- County
- Dakota County · 417,704 people
- City population
- 55,658
- Metro
- Minneapolis-St. Paul-Bloomington, MN-WI
- Population (ZIP)
- 55,658
- Household income
- $97,727
- Rent vs Own
- Severe rent burden
- 1406.0
Population outlook (Dakota County) Hauer SSP2
- Today (2025)
- 450,671 people
- By 2030
- 465,068 · +3.2%
- By 2040
- 486,770 · +8.0%
- By 2050
- 498,743 · +10.7%
- By 2075
- 533,865 · +18.5%
- By 2100
- 550,133 · +22.1%
Race, ethnicity, and origin ACS 2023
- Neighborhood character
- Predominantly White (69%)
- Race & ethnicity
- White 69% Black 10% Two or more races 9% Hispanic / Latino 7% Asian 6%
- Hispanic origin (detail)
- Mexican 4% Dominican 1%
- Common ancestry
- Portuguese 10% Romanian 3% Italian 3%
- Foreign-born
- 12% · Canada, China, Vietnam
- Languages at home
- 85% English-only · Spanish 5% Other Asian/Pacific 2% Other Indo-European 1%
Political lean MEDSL · Dakota
- 2024 margin
- D (+12.9) · D 55.4% · R 42.5% · Other 2.1%
- 2008→2024 swing
- +7.4pp toward D · 2008: 5.5pp · 2024: 12.9pp
- All cycles
- 2024: D+12.9 2020: D+13.9 2016: D+4.7 2012: D+2.9 2008: D+5.5
Not yet ingested
- Civics
- —
Market trends
- HPI YoY
- ▼ -275.56%
- Current HPI
- 227.4734
- Rent YoY
- ▲ 3.27%
- Metro
- Minneapolis-St. Paul-Bloomington, MN-WI
- State GDP YoY
- ▲ 2.41%
- F500 in state
- 34
Industry mix (Fortune 500 HQ in MN)
| Industry | F500 HQs | Revenue |
|---|---|---|
| Healthcare | 2 | $407B |
|
||
| Retail | 2 | $150B |
|
||
| Consumer Goods | 2 | $32B |
|
||
| Industrial Machinery | 2 | $6B |
|
||
| Agriculture | 1 | $40B |
|
||
| Healthcare / Medical Devices | 1 | $32B |
|
||
Price history
+378.8% since first listed9 events — show timeline
- 2026-05-07 Price Changed $249,000 NORTHSTARMLS as Distributed by MLS Grid
- 2026-04-14 Price Changed $255,000 NORTHSTARMLS as Distributed by MLS Grid
- 2026-03-26 Listed $276,000 NORTHSTARMLS as Distributed by MLS Grid
- 2024-07-31 Sold (Public Records) $228,000 Public Records
- 2024-06-28 Sold (MLS) $228,000 NORTHSTARMLS as Distributed by MLS Grid
- 2024-06-08 Pending — NORTHSTARMLS as Distributed by MLS Grid
- 2024-04-21 Contingent — NORTHSTARMLS as Distributed by MLS Grid
- 2024-04-15 Listed $225,000 NORTHSTARMLS as Distributed by MLS Grid
- 1989-05-01 Sold (Public Records) $52,000 Public Records
Property tax history
+5.6%/yrLatest (2025): $2,390 · +44.3% YoY. Source: county tax records.
Cash-flow waterfall
monthlySold comps — $/sqft
last 12 mo · ≤1 miLoading sold comps…