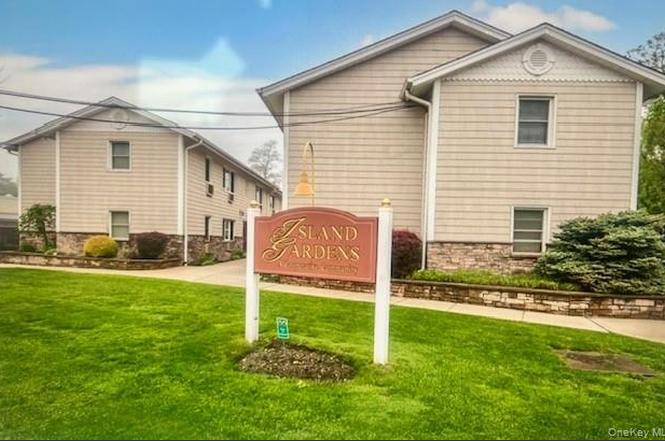
490 Main St Unit B-10 · Farmingdale, NY
Flood risk 4/10 · Minor
- FEMA flood zone
- X (unshaded)
- Chance of flooding over 30 yrs
- 0.22%
- Est. flood insurance / yr
- $507 – $1,088
Fire risk 1/10 · Minimal
- Est. fire insurance / yr
- $691 – $1,283
Heat risk 6/10 · Moderate
- Hot days now (above 94°F)
- 7 days/yr
- Hot days in 30 yrs
- 17 days/yr
Wind risk 6/10 · Moderate
- Chance of severe wind over 30 yrs
- 61.0%
Air-quality risk 4/10 · Minor
- Unhealthy air days now
- 5 days/yr
- Unhealthy air days in 30 yrs
- 7 days/yr
Risk factors via First Street. Map © Google.
Why this score? — see what drove the F grade
The composite is a weighted blend of 9 inputs, each scored 0–100. Each bar is that input's sub-score; the figure is the points it added to the 100-point composite (weight × sub-score).
- ARV discount +7.5/15.0
- 1% rule +6.3/10.0
- Schools +5.3/10.0
- Livability +4.1/5.0
- Rent growth +2.5/5.0
- Condition / age +2.5/5.0
- Cash flow +0.0/30.0
- DSCR +0.0/10.0
- Appreciation +0.0/10.0
$239,000
🖨 Deal sheet (PDF) 📄 Offer letter ✓ Due diligence
Listing remarks MLS
Spacious 1st Floor 1 Br Co-Op. Oak Floors. Large Lr, King Master Br, Spacious Eik, Updated Bath. Laundry On Premises. Walk To Main. St. Shopping, Houses Of Worship & L.I.R.R., Additional information: Appearance:Exc
Key facts
- 2 parking spots
- Built 1961
- Listed 28 days
Property features AI
Exterior
- Parking: Two parking spaces; Common parking lot
- Utilities: PSEG electric; Public sewer; Cable connected; Electricity available; Natural gas connected
- Home design: Townhouse; Stock cooperative; Two stories; Entry level: 1st floor
- Construction: Frame construction with vinyl siding
- Exterior features: Not waterfront; Common parking lot
Interior
- Kitchen: Dishwasher; Gas range
- Bedrooms: Bedroom on the first floor
- Flooring: Hardwood floors
- Bathrooms: One full bathroom
- Heating & cooling: Baseboard heating (natural gas); Wall/window air conditioning units
- Interior features: First-floor bedroom; No basement; Three total rooms; Estimated property condition; Pets allowed (call for details)
Neighborhood map
What this means for you Summary
Snapshot
- This is a 1-bed/1.0-bath condo listed at $239k.
Deal economics
- At list price, monthly cash flow is $-32k ($-382k/yr) — negative.
- The deal already cash-flows at list — no discount required.
- Meets the 1% rule at list price ($3k rent vs $239k).
- Recommended offer: $235k (1.5% below list) — sets the bar for market timing.
- Cap rate -153.5% vs local median 3.2% in Farmingdale — below-typical yield; the buyer is paying a premium for something (appreciation thesis, condition, location) that the cap rate doesn't capture.
Location & tenants
- Location reads 82/100 on livability (#75 in NY, #1,185 nationally) — a professional / high-income tenant draw. Strengths: crime A+, commute A+, employment A+; Watch: cost of living F.
- Farmingdale Union Free School District (suburban): math 59% / reading 56% proficiency, ranked #210 of 590 in NY (top 36%) — acceptable for families but not a draw, mixed tenant base, ~2y average lease; only 17% free/reduced lunch — higher-income household profile.
- Zoned schools: Northside Elementary School (math 57% / reading 57%, grade C+, #842 of 2,108 statewide, top 43%, 381 students, 22% FRL); Howitt School (math 36% / reading 43%, grade F, #418 of 729 statewide, top 59%, 1,199 students, 22% FRL); Farmingdale Senior High School (math 92% / reading 67%, grade A-, #518 of 1,100 statewide, top 51%, 1,703 students, 23% FRL).
- Market conditions: 106 active listings in the ZIP; high-income renter base; 824 units permitted in Nassau County in 2024 (153 in 5+ unit buildings).
Forward outlook
- Local home prices are declining (-3.0%/yr); year-one equity from $2k of loan paydown is wiped out by about $7k of value loss. Plan a longer hold.
- Nassau County population projected at +7% by 2050 — modest demand growth; plan on rents tracking national, not racing it.
Negotiation context
- It's been on market 28 days — a 2% lower offer ($235k) is reasonable based on typical stale-listing flexibility.
- 2 sale attempts since 9y ago with the ask held roughly flat each time — persistent listings suggest the price (not the market) is what's stuck; bring a comps-based counter.
- Current owner paid $142k; list at $239k implies a 68% gain — meaningful room to come down on a strong offer.
Risks & watch-outs
- Watch-outs: HOA is 1197% of rent.
- Climate carrying-cost: major wind risk, 61% chance of damaging wind over 30y; extreme-heat days projected 7→17/yr by 2055 (HVAC capex compounding) — expect insurance premiums to compound above CPI over the hold.
Questions for the listing agent
- What do current leases actually rent for vs. the listed asking? Can we see a recent rent roll and the last 12 months of T-12 income?
- Built in 1961 — when were the roof, HVAC, electrical panel, plumbing, and water heater last replaced?
- What does the HOA fee cover, when was the last increase, and are there any pending special assessments or reserve-fund shortfalls?
- Any open or pending special assessments — roof, HVAC, plumbing, elevator, façade? What's the per-unit balance and payoff schedule, and is the seller paying it off at close or rolling it to the buyer?
- Is there a deadline driving the sale (1031 exchange, divorce, estate, relocation)? That informs how much negotiation room exists.
- Schools are B-rated — typically a magnet for longer-tenancy family renters. What's the average tenant stay here, and is there a school-zone premium baked into asking?
- The area grade is low — what's the realistic commute time and amenity access for the typical tenant pool here? Any planned neighborhood developments (good or bad) we should know about?
- What's the average days-on-market for RENTAL listings here right now (not sales)? A rising rental-DOM trend means longer vacancies and softer asking-rent achievability than the comps imply.
- What's the recent tenant-quality profile in this submarket — average credit score on applications, eviction rate, late-payment / NSF rate, and stable-employment percentage? A property-management company in the area should have these aggregated.
- How much new apartment / multifamily construction is in the pipeline within 1–3 miles? Heavy new supply (>2% of stock underway) typically softens rents 12–24 months out; light construction supports rent growth.
Investment metrics
- 1% rule
- 1.13% ✓
- Cap rate
- -153.53%
- Cash-on-cash
- -570.79%
- DSCR
- -24.40
- GRM
- 7.4
CMA / ARV
No comps found within radius.
Projected returns pro-forma
-3.0% appreciation · 3.0% rent growth · sell at horizon
- IRR
- —
- Equity multiple
- -29.58×
- Total profit
- $-2,046,181
- Equity at exit
- $35,636
- IRR
- —
- Equity multiple
- -63.43×
- Total profit
- $-4,311,484
- Equity at exit
- $20,664
Cash invested: $66,920 (down + closing). Projections, not guarantees.
Landlord ↔ Tenant lean methodology
- Overall (STATE)
- 15 Strongly Tenant-Friendly
- State New York
- 15 Strongly Tenant-Friendly · D+10
- County
- — inherits STATE
- City
- — inherits STATE
ZIP-level market 11735
- Active inventory
- 106
- Price-to-rent
- 7.4×
Monthly cashflow live
- Estimated rent
- $2,699 medium interval (Pro) →
- Mortgage (P&I)
- −$1,253
- Tax est. 1.5%
- −$299 /mo · $3,585/yr
- Insurance
- −$100
- HOA est. from 1 same-building comp
- −$32,312
- Vacancy / Maint / Mgmt
- −$567
- Net cashflow
- $-31,831
Break-even live
Sensitivity live
| Price | -10% $-31,666 | -5% $-31,749 | +0% $-31,831 | +5% $-31,914 | +10% $-31,996 |
|---|---|---|---|---|---|
| Rent | -10% $-32,045 | -5% $-31,938 | +0% $-31,831 | +5% $-31,725 | +10% $-31,618 |
| Rate | -1.0pp $-31,711 | -0.5pp $-31,771 | base $-31,831 | +0.5pp $-31,893 | +1.0pp $-31,956 |
UW: 25.0% down · 7.5% · 30yr · 1.5% tax · 5.0% vac · 8.0% maint · 8.0% mgmt
Financing live
Cash to close
- Down payment
- $59,750
- Closing costs
- $7,170
- Reserves months
- —
- Total cash needed
- —
Loan-product check · same deal, 3 products live
Conventional
25% down · 7.5% · 30yr
- Down + closing
- —
- Monthly P&I
- —
- Monthly cashflow
- —
- DSCR
- —
- Eligible?
- —
Personal DTI + credit; lowest rate.
DSCR
20% down · 8.5% · 30yr
- Down + closing
- —
- Monthly P&I
- —
- Monthly cashflow
- —
- DSCR
- —
- Eligible?
- —
No personal income docs; deal must DSCR.
Hard money
10% down · 12.0% · 12mo
- Down + closing
- —
- Monthly P&I
- —
- Monthly cashflow
- —
- DSCR
- —
- Eligible?
- —
Short-term bridge; refi at stabilization.
HOA detail condo
- Monthly dues
- $0 · $0/yr
- Assessments
- None detected in remarks — confirm with the listing agent.
Listing history 6 events
-
2026-04-13status Pending
-
2026-03-17$239,000 Active
-
2026-03-07historical $239,000
-
2018-05-24soldstatus $142,000 Closed 218-char remark
Show marketing remark (218 chars)
Spacious 1st Floor 1 Br Co-Op. Oak Floors. Large Lr, King Master Br, Spacious Eik, Updated Bath. Laundry On Premises. Walk To Main. St. Shopping, Houses Of Worship & L.I.R.R., Additional information: Appearance:Exc
-
2018-02-12status Under Contract 218-char remark
Show marketing remark (218 chars)
Spacious 1st Floor 1 Br Co-Op. Oak Floors. Large Lr, King Master Br, Spacious Eik, Updated Bath. Laundry On Premises. Walk To Main. St. Shopping, Houses Of Worship & L.I.R.R., Additional information: Appearance:Exc
-
2017-12-21$145,000 New 218-char remark
Show marketing remark (218 chars)
Spacious 1st Floor 1 Br Co-Op. Oak Floors. Large Lr, King Master Br, Spacious Eik, Updated Bath. Laundry On Premises. Walk To Main. St. Shopping, Houses Of Worship & L.I.R.R., Additional information: Appearance:Exc
ⓘ Source: listings_history table (triggers on properties + properties_extension) + one-shot
backfill from property_details.listing_events for pre-trigger history.
Climate risk First Street
- Flood 4/10 Moderate FEMA zone X (unshaded) · 22% chance over 30 yrs
- Wildfire 1/10 Low
- Heat 6/10 Major 7 d/yr ≥94°F today · 17 d/yr by 30 yrs out
- Wind 6/10 Major 61% chance of damaging wind over 30 yrs
- Air quality 4/10 Moderate 5 unhealthy d/yr today · 7 by 30 yrs out
Nearby sold comps map
Loading sold comps map…
Walkable amenities ~0.75 mi
Loading nearby amenities…
Taxation est. · year 1
- Rental income
- $32,391
- − Mortgage interest
- −$13,388
- − Property taxes
- −$3,585
- − Insurance
- −$1,195
- − Repairs & maintenance
- −$2,591
- − Management
- −$2,591
- − HOA
- −$387,744
- − Depreciation
- −$6,953
- Taxable loss
- −$385,656
- Est. tax savings @ 24.0%
- +$92,558
- After-tax cash flow
- $-289,418/yr
For passive investors: Depreciation is non-cash, so a rental often shows a tax loss while cash-flowing — sheltering income. Rental losses are passive: they offset passive income freely, and up to $25,000/yr can offset ordinary (W-2) income if you actively participate and your MAGI is under $100k (phasing out to $0 by $150k); unused losses carry forward. On sale, claimed depreciation is recaptured at up to 25%, and gains may owe capital-gains tax (a 1031 exchange can defer both). Figures are a year-1 estimate at your 24.0% rate — not tax advice; consult a CPA.
Schools (NCES district)
- District
- Farmingdale Union Free School District
- NCES district ID
- 3610980
- Math proficiency
- 59% ▼ -6.00%
- Reading proficiency
- 56% ▲ 3.00%
- Median HH income
- $93,515
- Composite
- 53.18/100
- National rank
- #1505
- State rank
- #210 of 590 in NY
Livability — Farmingdale
- Score
- 82/100
- State rank
- #75
- US rank
- #1185
Category grades
Schools grade is shown separately in the Schools card above.
Census & demographics
- Census place
- Farmingdale, NY
- County
- Nassau County · 653,051 people
- City population
- 32,028
- Metro
- New York-Newark-Jersey City, NY-NJ-PA
- Population (ZIP)
- 32,028
- Household income
- $139,443
- Rent vs Own
- Severe rent burden
- 602.0
Population outlook (Nassau County) Hauer SSP2
- Today (2025)
- 1,409,302 people
- By 2030
- 1,431,482 · +1.6%
- By 2040
- 1,471,607 · +4.4%
- By 2050
- 1,502,845 · +6.6%
- By 2075
- 1,575,403 · +11.8%
- By 2100
- 1,554,356 · +10.3%
Race, ethnicity, and origin ACS 2023
- Neighborhood character
- Predominantly White (71%)
- Race & ethnicity
- White 71% Hispanic / Latino 15% Two or more races 8% Asian 8% Black 4%
- Hispanic origin (detail)
- Puerto Rican 5%
- Common ancestry
- Romanian 4% Scotch-Irish 2% Hispanic 1%
- Foreign-born
- 12% · Canada, China, Jamaica
- Languages at home
- 80% English-only · Spanish 9% Other Indo-European 5% Tagalog/Filipino 1%
Political lean MEDSL · Nassau
- 2024 margin
- Toss-up / Even · D 47.9% · R 52.1%
- 2008→2024 swing
- -12.6pp toward R · 2008: 8.4pp · 2024: -4.2pp
- All cycles
- 2024: R+4.2 2020: D+9.5 2016: D+5.3 2012: D+6.7 2008: D+8.4
Not yet ingested
- Civics
- —
Market trends
- HPI YoY
- ▼ -720.07%
- Current HPI
- 292.0299
- Rent YoY
- —
- Metro
- New York-Newark-Jersey City, NY-NJ-PA
- State GDP YoY
- ▲ 2.60%
- F500 in state
- 92
Industry mix (Fortune 500 HQ in NY)
| Industry | F500 HQs | Revenue |
|---|---|---|
| Financial Services | 10 | $950B |
|
||
| Consumer Goods | 9 | $162B |
|
||
| Insurance | 4 | $225B |
|
||
| Telecommunications | 2 | $144B |
|
||
| Pharmaceuticals | 2 | $112B |
|
||
| Media / Entertainment | 2 | $69B |
|
||
Price history
+64.8% since first listed6 events — show timeline
- 2026-04-13 Pending — OneKey® MLS as Distributed by MLS Grid
- 2026-03-17 Listed $239,000 OneKey® MLS as Distributed by MLS Grid
- 2026-03-07 Coming Soon $239,000 OneKey® MLS as Distributed by MLS Grid
- 2018-05-24 Sold (MLS) $142,000 OneKey® MLS as Distributed by MLS Grid
- 2018-02-12 Pending — OneKey® MLS as Distributed by MLS Grid
- 2017-12-21 Listed $145,000 OneKey® MLS as Distributed by MLS Grid
Cash-flow waterfall
monthlySold comps — $/sqft
last 12 mo · ≤1 miLoading sold comps…