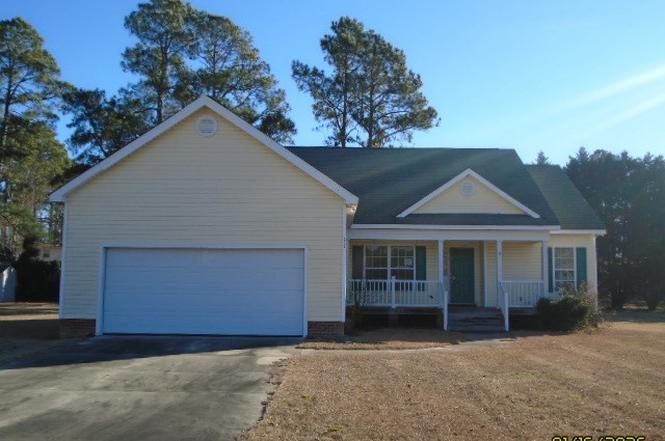
205 Kelly Dr · Laurinburg, NC
Flood risk 1/10 · Minimal
- FEMA flood zone
- X (unshaded)
- Chance of flooding over 30 yrs
- 0.0%
- Est. flood insurance / yr
- $507 – $1,088
Fire risk 5/10 · Moderate
- Est. fire insurance / yr
- $906 – $1,684
Heat risk 7/10 · Major
- Hot days now (above 107°F)
- 7 days/yr
- Hot days in 30 yrs
- 16 days/yr
Wind risk 6/10 · Moderate
- Chance of severe wind over 30 yrs
- 76.0%
Air-quality risk 1/10 · Minimal
- Unhealthy air days now
- 0 days/yr
- Unhealthy air days in 30 yrs
- 0 days/yr
Risk factors via First Street. Map © Google.
Why this score? — see what drove the D+ grade
The composite is a weighted blend of 9 inputs, each scored 0–100. Each bar is that input's sub-score; the figure is the points it added to the 100-point composite (weight × sub-score).
- Cash flow +15.0/30.0
- ARV discount +15.0/15.0
- DSCR +4.6/10.0
- 1% rule +3.5/10.0
- Livability +2.8/5.0
- Rent growth +2.5/5.0
- Condition / age +2.5/5.0
- Schools +2.1/10.0
- Appreciation +0.5/10.0
$160,000
🖨 Deal sheet (PDF) 📄 Offer letter ✓ Due diligence
Listing remarks
OPEN HOUSE SHOWING EVERY SATURDAY 2 TO 2:30 PM UNTIL SOLD! Buy today and profit for tomorrow; A move in the right direction! Whether your an investor or owner occupant looking for a below priced property you have met your match! It needs work, but location appeal and upsize make this a special property. Features a half an acre plus lot, rear deck, three bedroom, two full baths and an open floorplan. Don't miss out on this great opportunity!
Key facts
- Open floorplan
- Half an acre lot
- Rear deck
Tags
Property features AI
Finance
- Other: Located in Laurinburg subdivision; Directions: Turnpike Road to Meadowbrook Drive, to Anita Drive to Kelly Drive
Exterior
- Parking: Attached 2-car garage (2 covered spaces)
- Utilities: Public water; Public sewer
- Home design: Single-family residence; One story; Residential zoning (R15)
- Construction: Vinyl siding
- Exterior features: Deck; Level lot and yard
Interior
- Bedrooms: 5 total rooms
- Flooring: Carpet; Vinyl
- Bathrooms: 2 full bathrooms
- Heating & cooling: Heat pump (heating present)
- Interior features: One fireplace (free-standing); Crawl space basement
Neighborhood map
What this means for you Summary
Snapshot
- This is a 3-bed/2.0-bath single-family listed at $160k.
Deal economics
- At list price, monthly cash flow is $49 ($591/yr) — positive.
- The deal already cash-flows at list — no discount required.
- To meet the 1% rule (rent ≥ 1% of price), the offer needs to be $137k (14.6% below list).
- Recommended offer: $137k (14.6% below list) — sets the bar for 1% rule.
- Cap rate 6.7% vs local median 5.3% in Laurinburg — meaningfully above typical; check what's discounted (condition, days-on-market, listing class) to confirm the premium yield is real.
Location & tenants
- Location reads 56/100 on livability (#632 in NC) — a working-class tenant base; expect higher turnover. Strengths: cost of living A+, housing A-; Watch: health & safety C-, crime F, amenities F.
- Scotland County Schools (town): math 23% / reading 28% proficiency, ranked #160 of 178 in NC (top 90%) — low school quality limits family demand, transient renter base, plan for 1-2y turnover; 72% free/reduced lunch — lower-income household profile, screen leases tightly.
- Zoned schools: Sycamore Lane Elementary (math 12% / reading 21%, grade F, #1,307 of 1,410 statewide, top 93%, 357 students, 98% FRL); Spring Hill Middle (math 25% / reading 29%, grade F, #374 of 475 statewide, top 80%, 643 students, 99% FRL); Scotland High School (math 45% / reading 44%, grade F, #352 of 535 statewide, top 68%, 1,445 students, 98% FRL) — zoned schools average 98% FRL vs 72% district-wide (26 pts higher); higher-poverty schools than district average — tighter screening recommended.
- Market conditions: 157 active listings in the ZIP; 70 units permitted in Scotland County in 2024 (0 in 5+ unit buildings).
Forward outlook
- Local home prices are declining (-3.0%/yr); year-one equity from $1k of loan paydown is wiped out by about $5k of value loss. Plan a longer hold.
- Scotland County population projected at -20% by 2050 — secular population decline; favor cash flow + early exit over multi-decade hold.
Negotiation context
- It's been on market 152 days — a 12% lower offer ($141k) is reasonable based on typical stale-listing flexibility.
- 6 sale attempts since 3y ago; this cycle's ask has dropped $20k (11%) from the opening price — seller is motivated, your offer sets the floor, not the list.
Risks & watch-outs
- Climate carrying-cost: major wind risk, 76% chance of damaging wind over 30y; moderate wildfire risk; extreme-heat days projected 7→16/yr by 2055 (HVAC capex compounding) — expect insurance premiums to compound above CPI over the hold.
Questions for the listing agent
- It's been on market 152 days. Have you received any prior offers? Is the seller open to a 15% concession, seller financing, or rate buy-down credit?
- Why hasn't it sold? Are there any deal-killer items the seller is aware of (foundation, flood, title, zoning, code violations)?
- Is there a deadline driving the sale (1031 exchange, divorce, estate, relocation)? That informs how much negotiation room exists.
- Schools are F-rated, which usually means shorter tenancies and higher turnover. Who's the typical renter profile here, and what's been the actual vacancy rate?
- Crime grade is F in this area — have there been break-ins, vandalism, or insurance claims at this property in the last 3 years? What carrier currently insures it and at what premium?
- The area grade is low — what's the realistic commute time and amenity access for the typical tenant pool here? Any planned neighborhood developments (good or bad) we should know about?
- What's the average days-on-market for RENTAL listings here right now (not sales)? A rising rental-DOM trend means longer vacancies and softer asking-rent achievability than the comps imply.
- What's the recent tenant-quality profile in this submarket — average credit score on applications, eviction rate, late-payment / NSF rate, and stable-employment percentage? A property-management company in the area should have these aggregated.
- How much new for-sale + rental construction is in the pipeline within 1–3 miles? Heavy new supply typically softens prices + rents 12–24 months out; constrained supply supports both.
Investment metrics
- 1% rule
- 0.85% ✗
- Cap rate
- 6.66%
- Cash-on-cash
- 1.32%
- DSCR
- 1.06
- GRM
- 9.8
CMA / ARV
- ARV (on-the-fly)
- $203,073
- Comps found
- 10
Show comp detail 10 sales within ~0.75 mi
| Address | Dist | Beds/Ba | Sqft | Sold | Price | $/sf | Match |
|---|---|---|---|---|---|---|---|
| 1704 Lake Dr | 0.07mi | 3/2.0 | 1,488 (-10%) | 11mo | $175,000 | $118 | 71 |
| 1703 Lake Dr | 0.08mi | 3/2.0 | 1,870 (+13%) | 5mo | $205,000 | $110 | 70 |
| 13080 Debra Dr | 0.37mi | 3/2.0 | 1,582 (-4%) | 13mo | $232,000 | $147 | 65 |
| 1512 Patsy Ln | 0.30mi | 3/2.5 | 1,576 (-4%) | 15mo | $210,000 | $133 | 64 |
| 13260 Blues Farm Rd | 0.33mi | 3/2.0 | 1,811 (+10%) | 22mo | $110,000 | $61 | 50 |
| 12500 Colinwood Cir | 0.62mi | 3/2.0 | 1,698 (+3%) | 20mo | $224,000 | $132 | 50 |
| 12381 Colinwood Cir | 0.74mi | 3/2.0 | 1,725 (+4%) | 14mo | $212,500 | $123 | 46 |
| 13200 West Blvd | 0.61mi | 3/2.0 | 1,784 (+8%) | 15mo | $185,000 | $104 | 46 |
| 12941 Providence Rd | 0.64mi | 3/2.5 | 1,578 (-4%) | 19mo | $187,900 | $119 | 45 |
| 12800 Debra Dr | 0.65mi | 3/2.0 | 1,450 (-12%) | 12mo | $181,500 | $125 | 40 |
Match score weights: distance 35% · size 25% · config 20% · recency 20%. Top-matched comps best support the ARV.
Projected returns pro-forma
-3.0% appreciation · 3.0% rent growth · sell at horizon
- IRR
- -14.2%
- Equity multiple
- 0.49×
- Total profit
- $-22,816
- Equity at exit
- $23,857
- IRR
- -5.5%
- Equity multiple
- 0.64×
- Total profit
- $-15,935
- Equity at exit
- $13,834
Cash invested: $44,800 (down + closing). Projections, not guarantees.
Landlord ↔ Tenant lean methodology
- Overall (STATE)
- 85 Strongly Landlord-Friendly
- State North Carolina
- 85 Strongly Landlord-Friendly · R+3
- County
- — inherits STATE
- City
- — inherits STATE
ZIP-level market 28352
- Home prices YoY
- -3.4%
- Active inventory
- 157
- Price-to-rent
- 9.8×
Monthly cashflow live
- Estimated rent
- $1,366 medium interval (Pro) →
- Mortgage (P&I)
- −$839
- Tax from tax record
- −$124 /mo · $1,489/yr
- Insurance
- −$67
- HOA
- −$0
- Vacancy / Maint / Mgmt
- −$287
- Net cashflow
- $49
Break-even live
Sensitivity live
| Price | -10% $140 | -5% $95 | +0% $49 | +5% $4 | +10% $-41 |
|---|---|---|---|---|---|
| Rent | -10% $-59 | -5% $-5 | +0% $49 | +5% $103 | +10% $157 |
| Rate | -1.0pp $130 | -0.5pp $90 | base $49 | +0.5pp $8 | +1.0pp $-34 |
UW: 25.0% down · 7.5% · 30yr · 1.5% tax · 5.0% vac · 8.0% maint · 8.0% mgmt
Financing live
Cash to close
- Down payment
- $40,000
- Closing costs
- $4,800
- Reserves months
- —
- Total cash needed
- —
Loan-product check · same deal, 3 products live
Conventional
25% down · 7.5% · 30yr
- Down + closing
- —
- Monthly P&I
- —
- Monthly cashflow
- —
- DSCR
- —
- Eligible?
- —
Personal DTI + credit; lowest rate.
DSCR
20% down · 8.5% · 30yr
- Down + closing
- —
- Monthly P&I
- —
- Monthly cashflow
- —
- DSCR
- —
- Eligible?
- —
No personal income docs; deal must DSCR.
Hard money
10% down · 12.0% · 12mo
- Down + closing
- —
- Monthly P&I
- —
- Monthly cashflow
- —
- DSCR
- —
- Eligible?
- —
Short-term bridge; refi at stabilization.
Listing history 33 events
-
2026-06-21days on market $160,000 Active 152 DOM
-
2026-06-18days on market $160,000 Active 149 DOM
-
2026-06-17days on market $160,000 Active 148 DOM
-
2026-06-16days on market $160,000 Active 147 DOM
-
2026-06-15days on market $160,000 Active 146 DOM
-
2026-06-14days on market $160,000 Active 144 DOM
-
2026-06-13days on market $160,000 Active 143 DOM
-
2026-06-10days on market $160,000 Active 141 DOM
-
2026-06-09days on market $160,000 Active 140 DOM
-
2026-06-08days on market $160,000 Active 139 DOM
-
2026-06-07days on market $160,000 Active 138 DOM
-
2026-06-05days on market $160,000 Active 135 DOM
-
2026-06-03days on market $160,000 Active 134 DOM
-
2026-06-02days on market $160,000 Active 133 DOM
-
2026-06-01days on market $160,000 Active 132 DOM
-
2026-05-31days on market $160,000 Active 131 DOM
-
2026-05-30days on market $160,000 Active 130 DOM
-
2026-05-18status Active
-
2026-05-14price $160,000
-
2026-02-24price $170,000
-
2026-01-17$180,000 Active
-
2025-11-22price $180,000
-
2025-10-16$190,000 Active
-
2025-08-14price $190,000
-
2025-07-15$200,000 Active
-
2024-10-07price $154,900
-
2024-10-01price $159,950
-
2024-09-22price $165,000
-
2024-09-16price $194,000
-
2024-09-07$199,000 Active
-
2024-09-02historical
-
2023-06-05historical
-
2023-05-05$205,000 Active
ⓘ Source: listings_history table (triggers on properties + properties_extension) + one-shot
backfill from property_details.listing_events for pre-trigger history.
Tax reassessment forecast NC · Resets to sale price
- Current annual tax
- $1,489 · $124/mo
- Projected year-2 tax
- $1,489 · $124/mo
- Expected delta
- $0/yr ($0/mo · 0.0%)
ⓘ Screening estimate from a state-policy table — verify with the county assessor before closing.
Climate risk First Street
- Flood 1/10 Low FEMA zone X (unshaded) · 0% chance over 30 yrs
- Wildfire 5/10 Major
- Heat 7/10 Severe 7 d/yr ≥107°F today · 16 d/yr by 30 yrs out
- Wind 6/10 Major 76% chance of damaging wind over 30 yrs
- Air quality 1/10 Low 0 unhealthy d/yr today · 0 by 30 yrs out
Nearby sold comps map
Loading sold comps map…
Walkable amenities ~0.75 mi
Loading nearby amenities…
Taxation est. · year 1
- Rental income
- $16,391
- − Mortgage interest
- −$8,962
- − Property taxes
- −$1,489
- − Insurance
- −$800
- − Repairs & maintenance
- −$1,311
- − Management
- −$1,311
- − Depreciation
- −$4,655
- Taxable loss
- −$2,138
- Est. tax savings @ 24.0%
- +$513
- After-tax cash flow
- $1,104/yr
For passive investors: Depreciation is non-cash, so a rental often shows a tax loss while cash-flowing — sheltering income. Rental losses are passive: they offset passive income freely, and up to $25,000/yr can offset ordinary (W-2) income if you actively participate and your MAGI is under $100k (phasing out to $0 by $150k); unused losses carry forward. On sale, claimed depreciation is recaptured at up to 25%, and gains may owe capital-gains tax (a 1031 exchange can defer both). Figures are a year-1 estimate at your 24.0% rate — not tax advice; consult a CPA.
Schools (NCES district)
- District
- Scotland County Schools
- NCES district ID
- 3704200
- Math proficiency
- 23% ▼ -5.00%
- Reading proficiency
- 28% ▼ -3.00%
- Median HH income
- $31,203
- Composite
- 20.66/100
- National rank
- #8536
- State rank
- #160 of 178 in NC
Livability — Laurinburg
- Score
- 56/100
- State rank
- #632
- US rank
- #22962
Category grades
Schools grade is shown separately in the Schools card above.
Census & demographics
- Census place
- Laurinburg, NC
- City population
- 24,177
- Population (ZIP)
- 24,177
Population outlook (Scotland County) Hauer SSP2
- Today (2025)
- 33,331 people
- By 2030
- 32,017 · -3.9%
- By 2040
- 29,290 · -12.1%
- By 2050
- 26,554 · -20.3%
- By 2075
- 19,857 · -40.4%
- By 2100
- 13,851 · -58.4%
Race, ethnicity, and origin ACS 2023
- Neighborhood character
- Diverse neighborhood (Simpson 0.69)
- Race & ethnicity
- Black 42% White 37% Native American 11% Two or more races 6% Hispanic / Latino 4% Asian 1%
- Common ancestry
- Serbian 2% Slovak 1% Italian 1%
- Foreign-born
- 3% · Canada, China
- Languages at home
- 94% English-only · Spanish 3% Chinese 1%
Political lean MEDSL · Scotland
- 2024 margin
- Lean R (+6.9) · D 46.2% · R 53.1%
- 2008→2024 swing
- -22.0pp toward R · 2008: 15.1pp · 2024: -6.9pp
- All cycles
- 2024: R+6.9 2020: R+1.9 2016: D+7.8 2012: D+16.6 2008: D+15.1
Not yet ingested
- Civics
- —
Market trends
- HPI YoY
- ▼ -9.08%
- Current HPI
- 255.331
- Rent YoY
- —
- Metro
- —
- State GDP YoY
- ▲ 3.28%
- F500 in state
- 26
Industry mix (Fortune 500 HQ in NC)
| Industry | F500 HQs | Revenue |
|---|---|---|
| Financial Services | 2 | $213B |
|
||
| Retail | 2 | $95B |
|
||
| Industrial Conglomerate | 1 | $38B |
|
||
| Metals / Steel | 1 | $35B |
|
||
| Utilities | 1 | $30B |
|
||
| Industrial Machinery | 1 | $19B |
|
||
Price history
-22.0% since first listed16 events — show timeline
- 2026-05-18 Relisted — LPRMLS
- 2026-05-14 Price Changed $160,000 LPRMLS
- 2026-02-24 Price Changed $170,000 LPRMLS
- 2026-01-17 Listed $180,000 LPRMLS
- 2025-11-22 Price Changed $180,000 LPRMLS
- 2025-10-16 Listed $190,000 LPRMLS
- 2025-08-14 Price Changed $190,000 LPRMLS
- 2025-07-15 Listed $200,000 LPRMLS
- 2024-10-07 Price Changed $154,900 CANOPYMLS as Distributed by MLS Grid
- 2024-10-01 Price Changed $159,950 CANOPYMLS as Distributed by MLS Grid
- 2024-09-22 Price Changed $165,000 CANOPYMLS as Distributed by MLS Grid
- 2024-09-16 Price Changed $194,000 CANOPYMLS as Distributed by MLS Grid
- 2024-09-07 Listed $199,000 CANOPYMLS as Distributed by MLS Grid
- 2024-09-02 Coming Soon — CANOPYMLS as Distributed by MLS Grid
- 2023-06-05 Listing Removed — TMLS
- 2023-05-05 Listed $205,000 TMLS
Property tax history
+0.0%/yrLatest (2025): $1,489 · +5.0% YoY. Source: county tax records.
Cash-flow waterfall
monthlySold comps — $/sqft
last 12 mo · ≤1 miLoading sold comps…