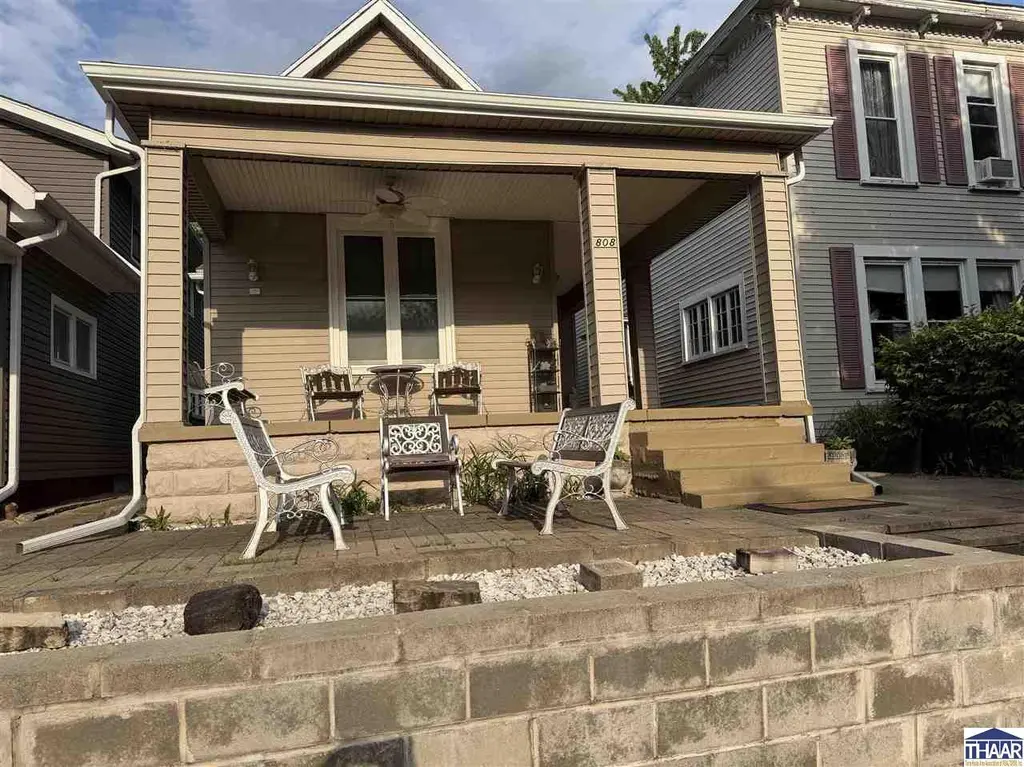
808 S 4th St · Terre Haute, IN
Flood risk 1/10 · Minimal
- FEMA flood zone
- X (unshaded)
- Chance of flooding over 30 yrs
- 0.0%
- Est. flood insurance / yr
- $473 – $860
Fire risk 3/10 · Minor
- Est. fire insurance / yr
- $717 – $1,331
Heat risk 4/10 · Minor
- Hot days now (above 105°F)
- 7 days/yr
- Hot days in 30 yrs
- 19 days/yr
Wind risk 2/10 · Minimal
- Chance of severe wind over 30 yrs
- 1.0%
Air-quality risk 3/10 · Minor
- Unhealthy air days now
- 3 days/yr
- Unhealthy air days in 30 yrs
- 4 days/yr
Risk factors via First Street. Map © Google.
Why this score? — see what drove the D- grade
The composite is a weighted blend of 9 inputs, each scored 0–100. Each bar is that input's sub-score; the figure is the points it added to the 100-point composite (weight × sub-score).
- ARV discount +7.5/15.0
- Appreciation +7.1/10.0
- Cash flow +6.4/30.0
- Livability +3.8/5.0
- Rent growth +3.4/5.0
- Schools +2.9/10.0
- Condition / age +2.5/5.0
- 1% rule +1.5/10.0
- DSCR +0.7/10.0
$160,000
🖨 Deal sheet 📄 Offer letter ✓ Due diligence
Listing remarks
MOTIVATED SELLER Welcomes you to the sunny L-porch and lower patio at 808 S 4th Street. Enjoy this peaceful retreat with no back yard mowing. The home has been regularly maintained and updated from the same homeowner for nearly 30 years. The main floor features living room, dining room, and kitchen with high ceilings and butcher block parkay flooring, a ceramic tiled laundry area, 3 bedrooms, 2 with birch wood walls and closets, 1 full bathroom with tub/shower, glass doors and ceramic tile floor. The finished basement has a 4th bedroom and possibly 5th if desired. There’s plenty of clean storage and gas water heater and furnace. The alley gives access to the 1 car garage with automati
Key facts
- Lower patio
- Birch wood walls
- Finished basement
Tags
Property features AI
Exterior
- Parking: Detached 1-car garage
- Utilities: Public sewer
- Home design: Single-family residence; 1 story
- Construction: Block, brick, and vinyl siding exterior; Shingle roof; Built with a crawl space/partial basement
- Exterior features: Covered patio
Interior
- Flooring: Ceramic tile; Hardwood
- Bathrooms: 1 full bathroom
- Heating & cooling: Natural gas heating; Ceiling fans; Wall/window air conditioning
- Interior features: Insulated windows; Crawl space/partial basement
Neighborhood map
What this means for you Summary
Snapshot
- This is a 3-bed/1.0-bath single-family listed at $160k.
Deal economics
- At list price, monthly cash flow is $-280 ($-3k/yr) — negative.
- To cash-flow at today's rent, offer at most $120k (25.3% below list).
- To meet the 1% rule (rent ≥ 1% of price), the offer needs to be $105k (34.7% below list).
- Recommended offer: $105k (34.7% below list) — sets the bar for 1% rule.
Location & tenants
- Location reads 75/100 on livability (#63 in IN, #4,186 nationally) — a middle-class / working-renter tenant base. Strengths: cost of living A+, housing A+, health & safety A+; Watch: crime F, employment F.
- Vigo County School Corporation (urban): math 32% / reading 37% proficiency, ranked #202 of 301 in IN (top 67%) — families likely to look elsewhere, expect single-tenant / working-renter base with shorter leases.
- Zoned schools: Farrington Grove Elementary School (math 27% / reading 22%, grade F, #762 of 994 statewide, top 78%, 428 students, 92% FRL); Sarah Scott Middle School (math 8% / reading 18%, grade F, #304 of 330 statewide, top 94%, 397 students, 86% FRL); Terre Haute South Vigo High School (math 37% / reading 72%, grade C-, #79 of 369 statewide, top 26%, 1,610 students, 51% FRL) — zoned schools average 76% FRL vs 47% district-wide (29 pts higher); higher-poverty schools than district average — tighter screening recommended.
- Market conditions: Rents rising (+3.7%/yr); 78 active listings in the ZIP; 12 comparable units currently listed for rent nearby; rentals lingering (median 44d on market — plan ~5-8 weeks vacancy on turnover, expect pricing pressure); 100% of comp listings sitting > 30 days — soft ceiling on asking rent; lower-income renter base — watch delinquency; 60 units permitted in Vigo County in 2024 (0 in 5+ unit buildings).
- At $1,046/mo this rent would consume 51% of the median local household income ($25k/yr) (locally 1836% of renters already pay >50% of income on rent) — very limited rent-growth headroom before tenants either downsize or default.
Forward outlook
- In year one you build about $8k of equity ($1k loan paydown + $7k appreciation (4.1% local appreciation)).
- Vigo County population projected to shrink 5% by 2050 — rents likely to lag national; underwrite the cash flow, not the appreciation.
- By year 5, paydown + projected appreciation supports a ~$33k cash-out refi (75% LTV) — recoverable capital for the next deal without selling this one.
Negotiation context
- It's been on market 42 days — a 3% lower offer ($155k) is reasonable based on typical stale-listing flexibility.
- 4 sale attempts; this cycle's ask has dropped $20k (11%) from the opening price — seller is motivated, your offer sets the floor, not the list.
Risks & watch-outs
- Watch-outs: built in 1888 — expect roof / HVAC / electrical / plumbing capex.
Questions for the listing agent
- What do current leases actually rent for vs. the listed asking? Can we see a recent rent roll and the last 12 months of T-12 income?
- It's been on market 42 days. Have you received any prior offers? Is the seller open to a 35% concession, seller financing, or rate buy-down credit?
- Built in 1888 — when were the roof, HVAC, electrical panel, plumbing, and water heater last replaced?
- Is there a deadline driving the sale (1031 exchange, divorce, estate, relocation)? That informs how much negotiation room exists.
- Schools are D-rated, which usually means shorter tenancies and higher turnover. Who's the typical renter profile here, and what's been the actual vacancy rate?
- Crime grade is F in this area — have there been break-ins, vandalism, or insurance claims at this property in the last 3 years? What carrier currently insures it and at what premium?
- The area grade is low — what's the realistic commute time and amenity access for the typical tenant pool here? Any planned neighborhood developments (good or bad) we should know about?
- What's the average days-on-market for RENTAL listings here right now (not sales)? A rising rental-DOM trend means longer vacancies and softer asking-rent achievability than the comps imply.
- What's the recent tenant-quality profile in this submarket — average credit score on applications, eviction rate, late-payment / NSF rate, and stable-employment percentage? A property-management company in the area should have these aggregated.
- How much new for-sale + rental construction is in the pipeline within 1–3 miles? Heavy new supply typically softens prices + rents 12–24 months out; constrained supply supports both.
Investment metrics
- 1% rule
- 0.65% ✗
- Cap rate
- 4.20%
- Cash-on-cash
- -7.49%
- DSCR
- 0.67
- GRM
- 12.8
CMA / ARV
- ARV (median comp)
- $97,248
- List price
- $160,000
- Delta
- 64.53%
- Verdict
- OVERPRICED
- Comps
- 20 within 1.0 mi
Show comp detail 6 sales within ~0.75 mi
| Address | Dist | Beds/Ba | Sqft | Sold | Price | $/sf | Match |
|---|---|---|---|---|---|---|---|
| 1012 S 9th St | 0.46mi | 3/1.0 | 1,214 (+6%) | 7mo | $105,000 | $86 | 63 |
| 1319 S 9th St | 0.55mi | 2/1.0 (-1) | 1,099 (-4%) | 5mo | $30,000 | $27 | 58 |
| 1425 S 11th St | 0.72mi | 2/1.0 (-1) | 1,120 (-3%) | 2mo | $82,500 | $74 | 55 |
| 1415 S 8th St | 0.56mi | 3/1.0 | 1,031 (-10%) | 2mo | $148,000 | $144 | 55 |
| 1211 S 11th St | 0.62mi | 3/1.0 | 1,270 (+10%) | 8mo | $85,000 | $67 | 47 |
| 1158 S Cruft St S | 0.71mi | 2/1.0 (-1) | 1,317 (+14%) | 22mo | $184,150 | $140 | 19 |
Match score weights: distance 35% · size 25% · config 20% · recency 20%. Top-matched comps best support the ARV.
Projected returns pro-forma
4.14% appreciation · 3.74% rent growth · sell at horizon
- IRR
- 4.4%
- Equity multiple
- 1.27×
- Total profit
- $12,142
- Equity at exit
- $82,456
- IRR
- 7.5%
- Equity multiple
- 2.29×
- Total profit
- $57,777
- Equity at exit
- $135,939
Cash invested: $44,800 (down + closing). Projections, not guarantees.
Landlord ↔ Tenant lean methodology
- Overall (STATE)
- 90 Strongly Landlord-Friendly
- State Indiana
- 90 Strongly Landlord-Friendly · R+11
- County
- — inherits STATE
- City
- — inherits STATE
ZIP-level market 47807
- Home prices YoY
- 2.8%
- Rents YoY
- 3.7%
- Active inventory
- 78
- Price-to-rent
- 12.8×
Monthly cashflow live
- Estimated rent
- $1,046 high interval (Pro) →
- Mortgage (P&I)
- −$839
- Tax est. 1.5%
- −$200 /mo · $2,400/yr
- Insurance
- −$67
- HOA
- −$0
- Vacancy / Maint / Mgmt
- −$220
- Net cashflow
- $-280
Break-even live
UW: 25.0% down · 7.5% · 30yr · 1.5% tax · 5.0% vac · 8.0% maint · 8.0% mgmt
Financing live
Cash to close
- Down payment
- $40,000
- Closing costs
- $4,800
- Reserves months
- —
- Total cash needed
- —
Loan-product check · same deal, 3 products live
Conventional
25% down · 7.5% · 30yr
- Down + closing
- —
- Monthly P&I
- —
- Monthly cashflow
- —
- DSCR
- —
- Eligible?
- —
Personal DTI + credit; lowest rate.
DSCR
20% down · 8.5% · 30yr
- Down + closing
- —
- Monthly P&I
- —
- Monthly cashflow
- —
- DSCR
- —
- Eligible?
- —
No personal income docs; deal must DSCR.
Hard money
10% down · 12.0% · 12mo
- Down + closing
- —
- Monthly P&I
- —
- Monthly cashflow
- —
- DSCR
- —
- Eligible?
- —
Short-term bridge; refi at stabilization.
Rent comps 12 comps
| Address | Beds | Baths | Sqft | Rent | $/sqft | DOM | Units | Dist |
|---|---|---|---|---|---|---|---|---|
| 1011 S 4th St Terre Haute, IN | 2.0 | 1.0 | 1268 | $750 | $0.59 | 44d | 1 | 0.13mi |
| 500 College Ave Terre Haute, IN | 2.0 | 1.0 | 809 | $792 | $0.98 | 44d | 14 | 0.14mi |
| 600 S Center St Unit 602 Terre Haute, IN | 3.0 | 1.5 | 1500 | $2,500 | $1.67 | 44d | 1 | 0.27mi |
| 1201 S 7th St Unit 3 Terre Haute, IN | 3.0 | 1.0 | 880 | $925 | $1.05 | 44d | 1 | 0.35mi |
| 1611 S 7th St Apt 4 Terre Haute, IN | 2.0 | 1.0 | 1022 | $795 | $0.78 | 44d | 1 | 0.68mi |
| 1 Sycamore St Terre Haute, IN | 2.0 | 2.0 | 1311 | $1,510 | $1.15 | 44d | 1 | 1.02mi |
| 435 S 18th St Terre Haute, IN | 3.0 | 1.0 | 1108 | $1,050 | $0.95 | 44d | 1 | 1.22mi |
| 1701 Ohio St Unit C Terre Haute, IN | 2.0 | 1.0 | 880 | $950 | $1.08 | 44d | 1 | 1.26mi |
| 501 S 19th St Terre Haute, IN | 2.0 | 1.0 | 1200 | $975 | $0.81 | 44d | 1 | 1.27mi |
| 1320 S 19th St Terre Haute, IN | 2.0 | 1.0 | 830 | $700 | $0.84 | 44d | 1 | 1.32mi |
| 1915 Poplar St Unit A Terre Haute, IN | 3.0 | 1.0 | 1412 | $1,200 | $0.85 | 44d | 1 | 1.33mi |
| 2440 S 11th St Terre Haute, IN | 2.0 | 1.0 | 800 | $1,000 | $1.25 | 44d | 1 | 1.37mi |
Listing history 21 events
-
2026-06-19days on market $160,000 Active 42 DOM
-
2026-06-18days on market $160,000 Active 41 DOM
-
2026-06-17days on market $160,000 Active 40 DOM
-
2026-06-16days on market $160,000 Active 39 DOM
-
2026-06-15days on market $160,000 Active 38 DOM
-
2026-06-14days on market $160,000 Active 36 DOM
-
2026-06-13days on market $160,000 Active 35 DOM
-
2026-06-10days on market $160,000 Active 33 DOM
-
2026-06-09days on market $160,000 Active 32 DOM
-
2026-06-09price $160,000 Active 31 DOM
-
2026-06-08days on market $163,000 Active 31 DOM
-
2026-06-07days on market $163,000 Active 30 DOM
-
2026-06-05days on market $163,000 Active 27 DOM
-
2026-06-02days on market $163,000 Active 25 DOM
-
2026-06-01days on market $163,000 Active 24 DOM
-
2026-05-31days on market $163,000 Active 23 DOM
-
2026-05-30days on market $163,000 Active 22 DOM
-
2026-05-12status Active 1598-char remark
-
2026-05-08status Active 1598-char remark
-
2026-05-06$180,000 Active 1598-char remark
-
2026-05-06$180,000 Active
ⓘ Source: listings_history table (triggers on properties + properties_extension) + one-shot
backfill from property_details.listing_events for pre-trigger history.
Climate risk First Street
- Flood 1/10 Low FEMA zone X (unshaded) · 0% chance over 30 yrs
- Wildfire 3/10 Moderate
- Heat 4/10 Moderate 7 d/yr ≥105°F today · 19 d/yr by 30 yrs out
- Wind 2/10 Low 100% chance of damaging wind over 30 yrs
- Air quality 3/10 Moderate 3 unhealthy d/yr today · 4 by 30 yrs out
Nearby sold comps map
Loading sold comps map…
Walkable amenities ~0.75 mi
Loading nearby amenities…
Taxation est. · year 1
- Rental income
- $12,547
- − Mortgage interest
- −$8,962
- − Property taxes
- −$2,400
- − Insurance
- −$800
- − Repairs & maintenance
- −$1,004
- − Management
- −$1,004
- − Depreciation
- −$4,655
- Taxable loss
- −$6,277
- Est. tax savings @ 24.0%
- +$1,507
- After-tax cash flow
- $-1,850/yr
For passive investors: Depreciation is non-cash, so a rental often shows a tax loss while cash-flowing — sheltering income. Rental losses are passive: they offset passive income freely, and up to $25,000/yr can offset ordinary (W-2) income if you actively participate and your MAGI is under $100k (phasing out to $0 by $150k); unused losses carry forward. On sale, claimed depreciation is recaptured at up to 25%, and gains may owe capital-gains tax (a 1031 exchange can defer both). Figures are a year-1 estimate at your 24.0% rate — not tax advice; consult a CPA.
Schools (NCES district)
- District
- Vigo County School Corporation
- NCES district ID
- 1812090
- Math proficiency
- 32% ▼ -10.00%
- Reading proficiency
- 37% ▼ -8.00%
- Median HH income
- $40,100
- Composite
- 28.97/100
- National rank
- #6625
- State rank
- #202 of 301 in IN
Livability — Terre Haute
- Score
- 75/100
- State rank
- #63
- US rank
- #4186
Category grades
Schools grade is shown separately in the Schools card above.
Census & demographics
- Census place
- Terre Haute, IN
- County
- Vigo County · 91,193 people
- City population
- 91,193
- Metro
- Terre Haute, IN
- Population (ZIP)
- 13,140
- Household income
- $24,706
- Rent vs Own
- Severe rent burden
- 1836.0
Population outlook (Vigo County) Hauer SSP2
- Today (2025)
- 106,366 people
- By 2030
- 105,674 · -0.7%
- By 2040
- 103,731 · -2.5%
- By 2050
- 101,200 · -4.9%
- By 2075
- 95,674 · -10.1%
- By 2100
- 85,910 · -19.2%
Race, ethnicity, and origin ACS 2023
- Neighborhood character
- Predominantly White (74%)
- Race & ethnicity
- White 74% Black 14% Two or more races 8% Hispanic / Latino 4%
- Common ancestry
- Slovak 4% Romanian 2% Lithuanian 1%
- Foreign-born
- 3% · Canada
- Languages at home
- 94% English-only · Spanish 4% Arabic 1%
Political lean MEDSL · Vigo
- 2024 margin
- R (+18.1) · D 40.0% · R 58.1% · Other 2.0%
- 2008→2024 swing
- -33.9pp toward R · 2008: 15.8pp · 2024: -18.1pp
- All cycles
- 2024: R+18.1 2020: R+14.7 2016: R+15.2 2012: D+0.8 2008: D+15.8
Not yet ingested
- Civics
- —
Market trends
- HPI YoY
- ▲ 4.14%
- Current HPI
- 152.8073
- Rent YoY
- ▲ 3.74%
- Metro
- Terre Haute, IN
- State GDP YoY
- ▲ 2.90%
- F500 in state
- 18
Industry mix (Fortune 500 HQ in IN)
| Industry | F500 HQs | Revenue |
|---|---|---|
| Industrial Machinery | 2 | $37B |
|
||
| Healthcare | 1 | $177B |
|
||
| Pharmaceuticals | 1 | $45B |
|
||
| Metals / Steel | 1 | $18B |
|
||
| Agriculture | 1 | $17B |
|
||
| Packaging | 1 | $12B |
|
||
Price history
-11.1% since first listed10 events — show timeline
- 2026-06-08 Price Changed $160,000 MIBOR as Distributed by MLS Grid
- 2026-06-08 Price Changed $160,000 THAAR
- 2026-05-28 Price Changed $163,000 THAAR
- 2026-05-27 Price Changed $163,000 MIBOR as Distributed by MLS Grid
- 2026-05-20 Price Changed $168,000 MIBOR as Distributed by MLS Grid
- 2026-05-19 Price Changed $168,000 THAAR
- 2026-05-12 Relisted — THAAR
- 2026-05-08 Relisted — THAAR
- 2026-05-06 Listed $180,000 THAAR
- 2026-05-06 Listed $180,000 MIBOR as Distributed by MLS Grid
Property tax history
-4.7%/yrLatest (2024): $318 · +27.1% YoY. Source: county tax records.
Cash-flow waterfall
monthlySold comps — $/sqft
last 12 mo · ≤1 miLoading sold comps…