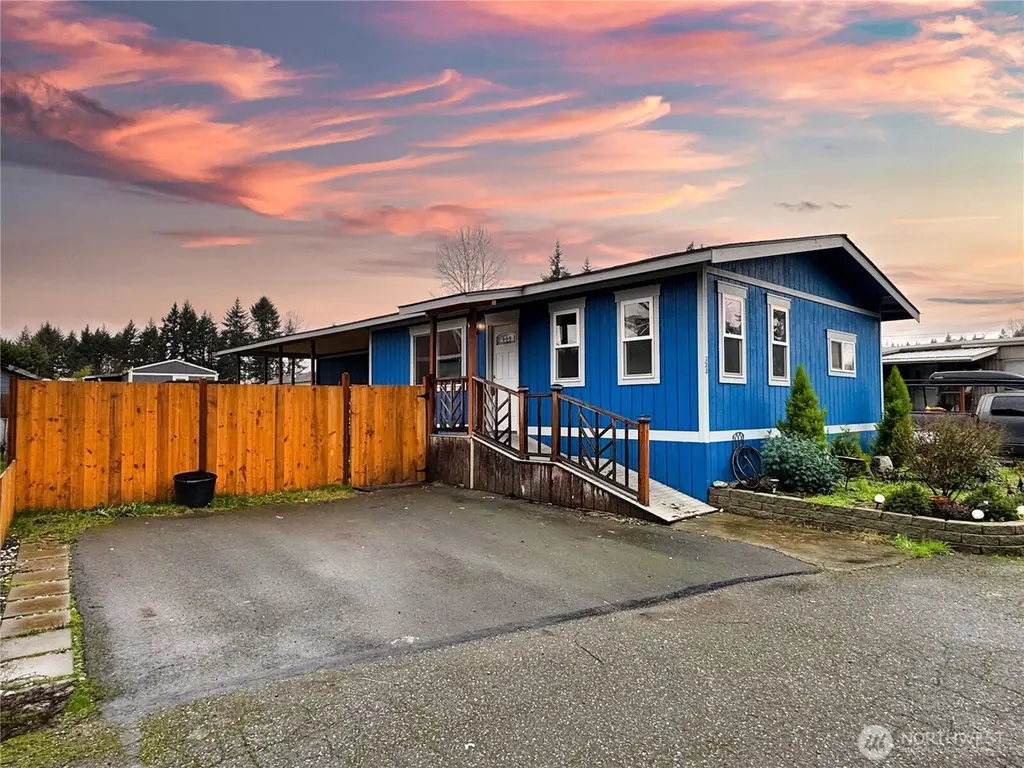
6413 123rd Ave SE #32 · Snohomish, WA
Flood risk No data
- FEMA flood zone
- —
- Chance of flooding over 30 yrs
- —
- Est. flood insurance / yr
- —
Fire risk No data
- Est. fire insurance / yr
- —
Heat risk No data
- Hot days now (above threshold)
- —
- Hot days in 30 yrs
- —
Wind risk No data
- Chance of severe wind over 30 yrs
- —
Air-quality risk No data
- Unhealthy air days now
- —
- Unhealthy air days in 30 yrs
- —
Risk factors via First Street. Map © Google.
Why this score? — see what drove the B grade
The composite is a weighted blend of 9 inputs, each scored 0–100. Each bar is that input's sub-score; the figure is the points it added to the 100-point composite (weight × sub-score).
- Cash flow +30.0/30.0
- 1% rule +10.0/10.0
- DSCR +10.0/10.0
- ARV discount +7.5/15.0
- Schools +5.9/10.0
- Rent growth +4.7/5.0
- Livability +3.9/5.0
- Condition / age +2.5/5.0
- Appreciation +0.0/10.0
$87,500
🖨 Deal sheet 📄 Offer letter ✓ Due diligence
Listing remarks
Seller offering $10,000 credit for CC. Water and sewer are included in the space rent—no extra utility hassles! This charming 2-bedroom, 1-bath home offers a comfortable, spacious layout and a welcoming feel throughout. Enjoy a covered deck perfect for relaxing or entertaining year-round, plus a large fenced lot ideal for pets, gardening, or outdoor activities. Located in an all-ages community with easy access to Highway 9 and Highway 2, just minutes from downtown Snohomish, Monroe, and Lake Stevens. Plenty of parking available. Come see why so many love calling Circle H Mobile Home Park home—welcome home!
Key facts
- Covered deck
- Minutes from monroe
- Large fenced lot
Tags
Neighborhood map
What this means for you Summary
Snapshot
- This is a 2-bed/2.0-bath manufactured listed at $88k.
Deal economics
- At list price, monthly cash flow is $1k ($13k/yr) — positive.
- The deal already cash-flows at list — no discount required.
- Meets the 1% rule at list price ($2k rent vs $88k).
- Recommended offer: $77k (12.0% below list) — sets the bar for market timing.
- Cap rate 20.9% vs local median 2.3% in Snohomish — top-decile yield for the area; either an underpriced asset or a hidden risk that comps aren't pricing in. Stress-test before assuming the spread holds.
Location & tenants
- Location reads 78/100 on livability (#120 in WA, #2,426 nationally) — a middle-class / working-renter tenant base. Strengths: health & safety A+, housing A, schools A-; Watch: amenities F, cost of living F.
- Snohomish School District (suburban): math 58% / reading 69% proficiency, ranked #25 of 291 in WA (top 9%) — acceptable for families but not a draw, mixed tenant base, ~2y average lease; only 18% free/reduced lunch — higher-income household profile.
- Market conditions: Rents rising fast (+8.8%/yr); 236 active listings in the ZIP; high-income renter base; 3,982 units permitted in Snohomish County in 2024 (1,492 in 5+ unit buildings).
Forward outlook
- Local home prices are declining (-3.0%/yr); year-one equity from $605 of loan paydown is wiped out by about $3k of value loss. Plan a longer hold.
- Snohomish County population projected at +30% by 2050 — long-run rental-demand tailwind backs the buy-and-hold thesis.
- At projected returns (-3.0% appreciation + 8.0% rent growth), your $24k cash investment doubles in ~3 years — after that, you're playing with house money.
Negotiation context
- It's been on market 149 days — a 12% lower offer ($77k) is reasonable based on typical stale-listing flexibility.
- 4 sale attempts since 26y ago; this cycle's ask has dropped $38k (30%) from the opening price — seller is motivated, your offer sets the floor, not the list.
- Current owner paid $25k; list at $88k implies a 250% gain — meaningful room to come down on a strong offer.
Questions for the listing agent
- It's been on market 149 days. Have you received any prior offers? Is the seller open to a 12% concession, seller financing, or rate buy-down credit?
- Built in 1974 — when were the roof, HVAC, electrical panel, plumbing, and water heater last replaced?
- Why hasn't it sold? Are there any deal-killer items the seller is aware of (foundation, flood, title, zoning, code violations)?
- Is there a deadline driving the sale (1031 exchange, divorce, estate, relocation)? That informs how much negotiation room exists.
- Schools are A-rated — typically a magnet for longer-tenancy family renters. What's the average tenant stay here, and is there a school-zone premium baked into asking?
- What's the average days-on-market for RENTAL listings here right now (not sales)? A rising rental-DOM trend means longer vacancies and softer asking-rent achievability than the comps imply.
- What's the recent tenant-quality profile in this submarket — average credit score on applications, eviction rate, late-payment / NSF rate, and stable-employment percentage? A property-management company in the area should have these aggregated.
- How much new for-sale + rental construction is in the pipeline within 1–3 miles? Heavy new supply typically softens prices + rents 12–24 months out; constrained supply supports both.
Investment metrics
- 1% rule
- 2.28% ✓
- Cap rate
- 20.90%
- Cash-on-cash
- 52.17%
- DSCR
- 3.32
- GRM
- 3.6
CMA / ARV
- ARV (median comp)
- $333,688
- List price
- $87,500
- Delta
- -73.78%
- Verdict
- UNDERPRICED
- Comps
- 2 within 1.0 mi
Projected returns pro-forma
-3.0% appreciation · 8.0% rent growth · sell at horizon
- IRR
- 55.4%
- Equity multiple
- 3.62×
- Total profit
- $64,199
- Equity at exit
- $13,047
- IRR
- 62.2%
- Equity multiple
- 8.80×
- Total profit
- $191,220
- Equity at exit
- $7,565
Cash invested: $24,500 (down + closing). Projections, not guarantees.
Landlord ↔ Tenant lean methodology
- Overall (STATE)
- 28 Tenant-Leaning
- State Washington
- 28 Tenant-Leaning · D+8
- County
- — inherits STATE
- City
- — inherits STATE
ZIP-level market 98290
- Rents YoY
- 8.8%
- Active inventory
- 236
- Price-to-rent
- 3.6×
Monthly cashflow live
- Estimated rent
- $1,998 medium interval (Pro) →
- Mortgage (P&I)
- −$459
- Tax from tax record
- −$18 /mo · $217/yr
- Insurance
- −$36
- HOA
- −$0
- Vacancy / Maint / Mgmt
- −$420
- Net cashflow
- $1,065
Break-even live
UW: 25.0% down · 7.5% · 30yr · 1.5% tax · 5.0% vac · 8.0% maint · 8.0% mgmt
Financing live
Cash to close
- Down payment
- $21,875
- Closing costs
- $2,625
- Reserves months
- —
- Total cash needed
- —
Loan-product check · same deal, 3 products live
Conventional
25% down · 7.5% · 30yr
- Down + closing
- —
- Monthly P&I
- —
- Monthly cashflow
- —
- DSCR
- —
- Eligible?
- —
Personal DTI + credit; lowest rate.
DSCR
20% down · 8.5% · 30yr
- Down + closing
- —
- Monthly P&I
- —
- Monthly cashflow
- —
- DSCR
- —
- Eligible?
- —
No personal income docs; deal must DSCR.
Hard money
10% down · 12.0% · 12mo
- Down + closing
- —
- Monthly P&I
- —
- Monthly cashflow
- —
- DSCR
- —
- Eligible?
- —
Short-term bridge; refi at stabilization.
Listing history 22 events
-
2026-06-18days on market $87,500 Active 149 DOM
-
2026-06-17days on market $87,500 Active 148 DOM
-
2026-06-16days on market $87,500 Active 147 DOM
-
2026-06-15days on market $87,500 Active 146 DOM
-
2026-06-13days on market $87,500 Active 144 DOM
-
2026-06-09days on market $87,500 Active 140 DOM
-
2026-06-08days on market $87,500 Active 139 DOM
-
2026-06-07days on market $87,500 Active 138 DOM
-
2026-06-04days on market $87,500 Active 135 DOM
-
2026-06-03days on market $87,500 Active 134 DOM
-
2026-06-02days on market $87,500 Active 133 DOM
-
2026-06-01days on market $87,500 Active 132 DOM
-
2026-05-31days on market $87,500 Active 131 DOM
-
2026-05-10status Active
-
2026-05-04status Pending
-
2026-04-15status Active
-
2026-04-15price $87,500
-
2026-04-08status Pending
-
2026-02-19price $115,000
-
2026-01-08$125,000 Active
-
2000-05-01soldstatus $25,000
-
2000-01-23$25,000
ⓘ Source: listings_history table (triggers on properties + properties_extension) + one-shot
backfill from property_details.listing_events for pre-trigger history.
Tax reassessment forecast WA · Resets to sale price
- Current annual tax
- $217 · $18/mo
- Projected year-2 tax
- $858 · $71/mo
- Expected delta
- +$641/yr (+$53/mo · 295.9%)
ⓘ Screening estimate from a state-policy table — verify with the county assessor before closing.
Nearby sold comps map
Loading sold comps map…
Walkable amenities ~0.75 mi
Loading nearby amenities…
Taxation est. · year 1
- Rental income
- $23,978
- − Mortgage interest
- −$4,901
- − Property taxes
- −$217
- − Insurance
- −$438
- − Repairs & maintenance
- −$1,918
- − Management
- −$1,918
- − Depreciation
- −$2,545
- Taxable income
- $12,041
- Est. tax owed @ 24.0%
- −$2,890
- After-tax cash flow
- $9,893/yr
For passive investors: Depreciation is non-cash, so a rental often shows a tax loss while cash-flowing — sheltering income. Rental losses are passive: they offset passive income freely, and up to $25,000/yr can offset ordinary (W-2) income if you actively participate and your MAGI is under $100k (phasing out to $0 by $150k); unused losses carry forward. On sale, claimed depreciation is recaptured at up to 25%, and gains may owe capital-gains tax (a 1031 exchange can defer both). Figures are a year-1 estimate at your 24.0% rate — not tax advice; consult a CPA.
Schools (NCES district)
- District
- Snohomish School District
- NCES district ID
- 5308020
- Math proficiency
- 58% ▬ 0.00%
- Reading proficiency
- 69% ▲ 1.00%
- Median HH income
- $89,715
- Composite
- 59.21/100
- National rank
- #1934
- State rank
- #25 of 291 in WA
Livability — Snohomish
- Score
- 78/100
- State rank
- #120
- US rank
- #2426
Category grades
Schools grade is shown separately in the Schools card above.
Census & demographics
- County
- Snohomish County · 786,756 people
- City population
- 39,826
- Metro
- Seattle-Tacoma-Bellevue, WA
- Population (ZIP)
- 39,826
- Household income
- $132,973
- Rent vs Own
- Severe rent burden
- 522.0
Population outlook (Snohomish County) Hauer SSP2
- Today (2025)
- 899,800 people
- By 2030
- 960,975 · +6.8%
- By 2040
- 1,074,447 · +19.4%
- By 2050
- 1,171,954 · +30.2%
- By 2075
- 1,384,849 · +53.9%
- By 2100
- 1,497,296 · +66.4%
Race, ethnicity, and origin ACS 2023
- Neighborhood character
- Predominantly White (82%)
- Race & ethnicity
- White 82% Two or more races 9% Hispanic / Latino 7% Asian 3%
- Hispanic origin (detail)
- Mexican 5%
- Common ancestry
- Portuguese 7% Lithuanian 5% Italian 3%
- Foreign-born
- 7% · Canada, China
- Languages at home
- 91% English-only · Spanish 5% Other Asian/Pacific 1% Russian/Polish/Slavic 1%
Political lean MEDSL · Snohomish
- 2024 margin
- D (+19.0) · D 57.8% · R 38.9% · Other 3.3%
- 2008→2024 swing
- +0.1pp no change · 2008: 18.9pp · 2024: 19.0pp
- All cycles
- 2024: D+19.0 2020: D+20.6 2016: D+16.6 2012: D+16.2 2008: D+18.9
Not yet ingested
- Civics
- —
Market trends
- HPI YoY
- ▼ -751.01%
- Current HPI
- 338.6319
- Rent YoY
- ▲ 8.82%
- Metro
- Seattle-Tacoma-Bellevue, WA
- State GDP YoY
- ▲ 4.65%
- F500 in state
- 22
Industry mix (Fortune 500 HQ in WA)
| Industry | F500 HQs | Revenue |
|---|---|---|
| Retail | 2 | $269B |
|
||
| Technology / Retail | 1 | $638B |
|
||
| Technology | 1 | $245B |
|
||
| Telecommunications | 1 | $38B |
|
||
| Food / Beverage | 1 | $36B |
|
||
| Automotive / Trucks | 1 | $34B |
|
||
Price history
+250.0% since first listed9 events — show timeline
- 2026-05-10 Relisted — NWMLS as Distributed by MLS Grid
- 2026-05-04 Pending — NWMLS as Distributed by MLS Grid
- 2026-04-15 Relisted — NWMLS as Distributed by MLS Grid
- 2026-04-15 Price Changed $87,500 NWMLS as Distributed by MLS Grid
- 2026-04-08 Pending — NWMLS as Distributed by MLS Grid
- 2026-02-19 Price Changed $115,000 NWMLS as Distributed by MLS Grid
- 2026-01-08 Listed $125,000 NWMLS as Distributed by MLS Grid
- 2000-05-01 Sold (MLS) $25,000 NWMLS as Distributed by MLS Grid
- 2000-01-23 Listed $25,000 NWMLS as Distributed by MLS Grid
Property tax history
+5.7%/yrLatest (2026): $217 · +69.4% YoY. Source: county tax records.
Cash-flow waterfall
monthlySold comps — $/sqft
last 12 mo · ≤1 miLoading sold comps…