24 Archibald Avenue Ave SE · Ludowici, GA
Flood risk 1/10 · Minimal
- FEMA flood zone
- X (unshaded)
- Chance of flooding over 30 yrs
- 0.0%
- Est. flood insurance / yr
- $507 – $1,088
Fire risk 5/10 · Moderate
- Est. fire insurance / yr
- $963 – $1,789
Heat risk 8/10 · Major
- Hot days now (above 110°F)
- 7 days/yr
- Hot days in 30 yrs
- 18 days/yr
Wind risk 8/10 · Major
- Chance of severe wind over 30 yrs
- 99.0%
Air-quality risk 2/10 · Minimal
- Unhealthy air days now
- 2 days/yr
- Unhealthy air days in 30 yrs
- 2 days/yr
Risk factors via First Street. Map © Google.
Why this score? — see what drove the D+ grade
The composite is a weighted blend of 9 inputs, each scored 0–100. Each bar is that input's sub-score; the figure is the points it added to the 100-point composite (weight × sub-score).
- Cash flow +13.0/30.0
- ARV discount +9.8/15.0
- Appreciation +5.6/10.0
- DSCR +3.9/10.0
- Livability +3.6/5.0
- 1% rule +3.2/10.0
- Rent growth +2.5/5.0
- Condition / age +2.5/5.0
- Schools +2.3/10.0
$319,900
🖨 Deal sheet (PDF) 📄 Offer letter ✓ Due diligence
Listing remarks
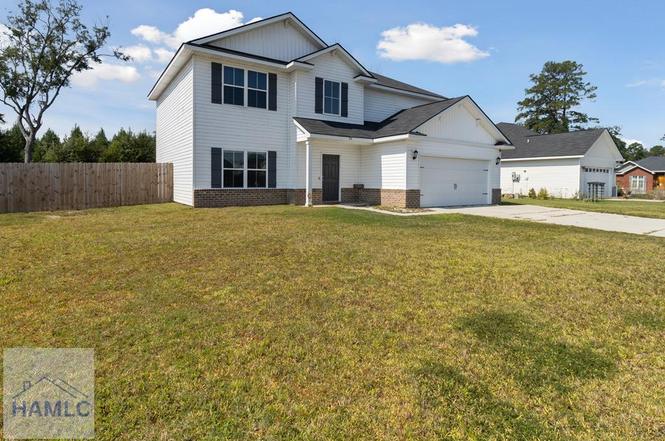
Welcome to Johnston Station! Offering over 2,200 square feet of living space, this 4-bedroom, 2.5-bath home features a functional floor plan designed for both everyday living and entertaining. A dramatic two-story foyer welcomes you inside, leading to multiple living spaces, a formal dining room, and a spacious kitchen complete with an island, stainless steel appliances, and ample cabinet storage. The versatile layout provides plenty of room to spread out, whether you're working from home, hosting guests, or simply enjoying time with family. Upstairs, the primary suite offers a private retreat, while three additional bedrooms provide flexibility for growing households, guest accommodations,
Key facts
- Formal dining room
- Spacious kitchen
- Island
Tags
Property features AI
Exterior
- Parking: 2 parking spaces total; 2 covered parking spaces; 2-car garage; Driveway
- Security: Smoke detectors
- Utilities: Public water; Public sewer
- Home design: Single family residence; Two levels; Residential property
- Construction: Brick veneer, vinyl siding, frame, and wood siding construction; Shingle roof; Slab foundation; Built on an interior, paved lot (approx. 0.25 acres)
- Exterior features: Privacy fencing; Irrigation equipment; Has a view; No additional exterior features listed
Interior
- Kitchen: Dishwasher; Microwave; Refrigerator; Electric water heater
- Flooring: Carpet; Vinyl
- Bathrooms: 2 full bathrooms; 1 half bathroom
- Heating & cooling: Central heating; Central air; Ceiling fans
- Interior features: Ceiling fans; Crown molding; Entrance foyer; Kitchen island; Pantry; Recessed lighting; High ceilings; Double pane windows; Unfurnished; Fireplace in family room
- Laundry & utility: Washer hookup
Neighborhood map
What this means for you Summary
Snapshot
- This is a 4-bed/2.5-bath single-family listed at $320k.
Deal economics
- At list price, monthly cash flow is $-15 ($-176/yr) — negative.
- To cash-flow at today's rent, offer at most $317k (0.8% below list).
- To meet the 1% rule (rent ≥ 1% of price), the offer needs to be $264k (17.6% below list).
- Recommended offer: $264k (17.6% below list) — sets the bar for 1% rule.
Location & tenants
- Location reads 72/100 on livability (#74 in GA) — a middle-class / working-renter tenant base. Strengths: cost of living A+, health & safety A+, crime A; Watch: employment D, amenities F, commute F.
- Long County (rural): math 26% / reading 26% proficiency, ranked #115 of 174 in GA (top 66%) — low school quality limits family demand, transient renter base, plan for 1-2y turnover; 61% free/reduced lunch — lower-income household profile, screen leases tightly.
- Zoned schools: Smiley Elementary School (1,258 students, 67% FRL); Long County Middle School (math 21% / reading 27%, grade F, #311 of 470 statewide, top 68%, 945 students, 69% FRL); Long County High School (math 37% / reading 22%, grade F, #140 of 424 statewide, top 35%, 1,209 students, 70% FRL).
- Market conditions: 412 active listings in the ZIP; 3 comparable units currently listed for rent nearby; rentals lingering (median 46d on market — plan ~5-8 weeks vacancy on turnover, expect pricing pressure); 100% of comp listings sitting > 30 days — soft ceiling on asking rent; 298 units permitted in Long County in 2024 (0 in 5+ unit buildings).
- This rent runs 42% of the median local income ($75k/yr) — at the standard rent-burdened threshold; future hikes will face affordability resistance.
Forward outlook
- In year one you build about $6k of equity ($2k loan paydown + $4k appreciation (1.2% local appreciation)).
- Long County population projected at +72% by 2050 — long-run rental-demand tailwind backs the buy-and-hold thesis.
- At projected returns (1.2% appreciation + 3.0% rent growth), your $90k cash investment doubles in ~10 years — after that, you're playing with house money.
- By year 6, paydown + projected appreciation supports a ~$33k cash-out refi (75% LTV) — recoverable capital for the next deal without selling this one.
Negotiation context
- Only 3 days on market — expect competitive offers; lowballing is unlikely to land.
- 7 sale attempts since 6y ago with the ask held roughly flat each time — persistent listings suggest the price (not the market) is what's stuck; bring a comps-based counter.
- Current owner paid $277k; 15% above their basis — modest negotiation headroom, anchor on the comps not their cost.
Risks & watch-outs
- Climate carrying-cost: severe wind risk, 99% chance of damaging wind over 30y; moderate wildfire risk; extreme-heat days projected 7→18/yr by 2055 (HVAC capex compounding) — expect insurance premiums to compound above CPI over the hold.
Questions for the listing agent
- What do current leases actually rent for vs. the listed asking? Can we see a recent rent roll and the last 12 months of T-12 income?
- Is there a deadline driving the sale (1031 exchange, divorce, estate, relocation)? That informs how much negotiation room exists.
- Schools are D-rated, which usually means shorter tenancies and higher turnover. Who's the typical renter profile here, and what's been the actual vacancy rate?
- The area grade is low — what's the realistic commute time and amenity access for the typical tenant pool here? Any planned neighborhood developments (good or bad) we should know about?
- What's the average days-on-market for RENTAL listings here right now (not sales)? A rising rental-DOM trend means longer vacancies and softer asking-rent achievability than the comps imply.
- What's the recent tenant-quality profile in this submarket — average credit score on applications, eviction rate, late-payment / NSF rate, and stable-employment percentage? A property-management company in the area should have these aggregated.
- How much new for-sale + rental construction is in the pipeline within 1–3 miles? Heavy new supply typically softens prices + rents 12–24 months out; constrained supply supports both.
Investment metrics
- 1% rule
- 0.82% ✗
- Cap rate
- 6.24%
- Cash-on-cash
- -0.20%
- DSCR
- 0.99
- GRM
- 10.1
CMA / ARV
- ARV (on-the-fly)
- $337,412
- Comps found
- 12
Show comp detail 12 sales within ~0.75 mi
| Address | Dist | Beds/Ba | Sqft | Sold | Price | $/sf | Match |
|---|---|---|---|---|---|---|---|
| 286 SE Archibald Ave SE | 0.29mi | 4/2.5 | 2,522 (+0%) | 15mo | $317,000 | $126 | 74 |
| 62 Anna Way SE | 0.10mi | 5/3.0 (+1) | 2,450 (-3%) | 16mo | $328,300 | $134 | 70 |
| 3703 Old Macon Darien Rd SE | 0.35mi | 4/2.5 | 2,321 (-8%) | 2mo | $300,000 | $129 | 69 |
| 299 Archibald Ave SE | 0.26mi | 4/2.5 | 2,319 (-8%) | 11mo | $317,000 | $137 | 66 |
| 185 SE Rimes Ave | 0.20mi | 5/3.0 (+1) | 2,638 (+5%) | 14mo | $330,000 | $125 | 64 |
| 792 South Macon St | 0.54mi | 4/3.0 | 2,388 (-5%) | 5mo | $351,915 | $147 | 60 |
| 270 Archibald Avenue Ave SE | 0.26mi | 5/3.0 (+1) | 2,450 (-3%) | 19mo | $320,000 | $131 | 60 |
| 77 Morrison Way Way SE | 0.11mi | 4/2.5 | 2,855 (+13%) | 17mo | $328,000 | $115 | 59 |
| 35 Frasier Ln | 0.42mi | 5/3.0 (+1) | 2,725 (+8%) | 5mo | $212,000 | $78 | 56 |
| 1568 Buster Phillips Rd SE | 0.58mi | 4/3.0 | 2,632 (+4%) | 15mo | $405,000 | $154 | 51 |
| 2956 Old Macon Darien Rd SE | 0.53mi | 5/3.0 (+1) | 2,717 (+8%) | 19mo | $395,000 | $145 | 39 |
| 761 S Macon St | 0.57mi | 4/2.5 | 2,184 (-13%) | 16mo | $325,000 | $149 | 38 |
Match score weights: distance 35% · size 25% · config 20% · recency 20%. Top-matched comps best support the ARV.
Projected returns pro-forma
1.16% appreciation · 3.0% rent growth · sell at horizon
- IRR
- 1.6%
- Equity multiple
- 1.08×
- Total profit
- $7,507
- Equity at exit
- $111,855
- IRR
- 6.2%
- Equity multiple
- 1.76×
- Total profit
- $68,373
- Equity at exit
- $150,714
Cash invested: $89,572 (down + closing). Projections, not guarantees.
Landlord ↔ Tenant lean methodology
- Overall (STATE)
- 90 Strongly Landlord-Friendly
- State Georgia
- 90 Strongly Landlord-Friendly · R+3
- County
- — inherits STATE
- City
- — inherits STATE
ZIP-level market 31316
- Home prices YoY
- 0.6%
- Active inventory
- 412
- Price-to-rent
- 10.1×
Monthly cashflow live
- Estimated rent
- $2,637 medium interval (Pro) →
- Mortgage (P&I)
- −$1,678
- Tax from tax record
- −$287 /mo · $3,446/yr
- Insurance
- −$133
- HOA
- −$0
- Lot rent
- −$0
- Vacancy / Maint / Mgmt
- −$554
- Net cashflow
- $-15
Break-even live
Sensitivity live
| Price | -10% $166 | -5% $76 | +0% $-15 | +5% $-105 | +10% $-196 |
|---|---|---|---|---|---|
| Rent | -10% $-223 | -5% $-119 | +0% $-15 | +5% $90 | +10% $194 |
| Rate | -1.0pp $146 | -0.5pp $67 | base $-15 | +0.5pp $-98 | +1.0pp $-182 |
UW: 25.0% down · 7.5% · 30yr · 1.5% tax · 5.0% vac · 8.0% maint · 8.0% mgmt
Financing live
Cash to close
- Down payment
- $79,975
- Closing costs
- $9,597
- Reserves months
- —
- Total cash needed
- —
Loan-product check · same deal, 3 products live
Conventional
25% down · 7.5% · 30yr
- Down + closing
- —
- Monthly P&I
- —
- Monthly cashflow
- —
- DSCR
- —
- Eligible?
- —
Personal DTI + credit; lowest rate.
DSCR
20% down · 8.5% · 30yr
- Down + closing
- —
- Monthly P&I
- —
- Monthly cashflow
- —
- DSCR
- —
- Eligible?
- —
No personal income docs; deal must DSCR.
Hard money
10% down · 12.0% · 12mo
- Down + closing
- —
- Monthly P&I
- —
- Monthly cashflow
- —
- DSCR
- —
- Eligible?
- —
Short-term bridge; refi at stabilization.
Rent comps 3 comps
| Address | Beds | Baths | Sqft | Rent | $/sqft | DOM | Units | Dist |
|---|---|---|---|---|---|---|---|---|
| 53 Allen Rawls Way SE Ludowici, GA | 5.0 | 3.0 | 2410 | $2,650 | $1.10 | 46d | 1 | 0.08mi |
| 147 Rimes Ave SE Ludowici, GA | 4.0 | 2.0 | 1782 | $2,100 | $1.18 | 46d | 1 | 0.21mi |
| 171 Baker Field Ln SE Ludowici, GA | 4.0 | 2.0 | 1807 | $2,350 | $1.30 | 46d | 1 | 0.94mi |
Listing history 3 events
-
2026-06-21days on market $319,900 Active 3 DOM
-
2026-06-18remarks 699-char remark
-
2026-06-18$319,900 Active 1 DOM
ⓘ Source: listings_history table (triggers on properties + properties_extension) + one-shot
backfill from property_details.listing_events for pre-trigger history.
Tax reassessment forecast GA · Resets to sale price
- Current annual tax
- $3,446 · $287/mo
- Projected year-2 tax
- $3,446 · $287/mo
- Expected delta
- $0/yr ($0/mo · 0.0%)
ⓘ Screening estimate from a state-policy table — verify with the county assessor before closing.
Climate risk First Street
- Flood 1/10 Low FEMA zone X (unshaded) · 0% chance over 30 yrs
- Wildfire 5/10 Major
- Heat 8/10 Severe 7 d/yr ≥110°F today · 18 d/yr by 30 yrs out
- Wind 8/10 Severe 99% chance of damaging wind over 30 yrs
- Air quality 2/10 Low 2 unhealthy d/yr today · 2 by 30 yrs out
Nearby sold comps map
Loading sold comps map…
Walkable amenities ~0.75 mi
Loading nearby amenities…
Taxation est. · year 1
- Rental income
- $31,647
- − Mortgage interest
- −$17,919
- − Property taxes
- −$3,446
- − Insurance
- −$1,600
- − Repairs & maintenance
- −$2,532
- − Management
- −$2,532
- − Depreciation
- −$9,306
- Taxable loss
- −$5,688
- Est. tax savings @ 24.0%
- +$1,365
- After-tax cash flow
- $1,189/yr
For passive investors: Depreciation is non-cash, so a rental often shows a tax loss while cash-flowing — sheltering income. Rental losses are passive: they offset passive income freely, and up to $25,000/yr can offset ordinary (W-2) income if you actively participate and your MAGI is under $100k (phasing out to $0 by $150k); unused losses carry forward. On sale, claimed depreciation is recaptured at up to 25%, and gains may owe capital-gains tax (a 1031 exchange can defer both). Figures are a year-1 estimate at your 24.0% rate — not tax advice; consult a CPA.
Schools (NCES district)
- District
- Long County
- NCES district ID
- 1303360
- Math proficiency
- 26% ▼ -14.00%
- Reading proficiency
- 26% ▼ -13.00%
- Median HH income
- $45,958
- Composite
- 22.51/100
- National rank
- #8090
- State rank
- #115 of 174 in GA
Livability — Ludowici
- Score
- 72/100
- State rank
- #74
- US rank
- #6449
Category grades
Schools grade is shown separately in the Schools card above.
Census & demographics
- Census place
- Ludowici, GA
- County
- Long County · 13,812 people
- City population
- 13,812
- Metro
- Hinesville, GA
- Population (ZIP)
- 13,812
- Household income
- $74,766
- Rent vs Own
- Severe rent burden
- 109.0
Population outlook (Long County) Hauer SSP2
- Today (2025)
- 24,669 people
- By 2030
- 28,223 · +14.4%
- By 2040
- 35,430 · +43.6%
- By 2050
- 42,403 · +71.9%
- By 2075
- 56,996 · +131.0%
- By 2100
- 64,185 · +160.2%
Race, ethnicity, and origin ACS 2023
- Neighborhood character
- Diverse neighborhood (Simpson 0.56)
- Race & ethnicity
- White 61% Black 23% Hispanic / Latino 8% Two or more races 8%
- Hispanic origin (detail)
- Mexican 2% Puerto Rican 5%
- Common ancestry
- Serbian 1% Italian 1% Romanian 1%
- Foreign-born
- 3% · Canada
- Languages at home
- 92% English-only · Spanish 6% Other Asian/Pacific 1% German/W. Germanic 1%
Political lean MEDSL · Long
- 2024 margin
- Strong R (+29.5) · D 35.1% · R 64.6%
- 2008→2024 swing
- -5.4pp toward R · 2008: -24.1pp · 2024: -29.5pp
- All cycles
- 2024: R+29.5 2020: R+26.4 2016: R+30.8 2012: R+22.9 2008: R+24.1
Not yet ingested
- Civics
- —
Market trends
- HPI YoY
- ▲ 1.16%
- Current HPI
- 195.2978
- Rent YoY
- —
- Metro
- Hinesville, GA
- State GDP YoY
- ▲ 2.66%
- F500 in state
- 28
Industry mix (Fortune 500 HQ in GA)
| Industry | F500 HQs | Revenue |
|---|---|---|
| Paper / Packaging | 2 | $29B |
|
||
| Retail | 1 | $160B |
|
||
| Transportation / Logistics | 1 | $91B |
|
||
| Airlines | 1 | $62B |
|
||
| Consumer Goods | 1 | $47B |
|
||
| Utilities | 1 | $25B |
|
||
Price history
+41.1% since first listed13 events — show timeline
- 2026-06-18 Listed $319,900 HABR
- 2025-01-14 Listing Removed — Hive MLS
- 2025-01-14 Listing Removed — Hive MLS
- 2024-11-19 Listed $309,900 Hive MLS
- 2024-11-19 Listed $309,900 Hive MLS
- 2022-09-23 Sold (Public Records) $277,000 Public Records
- 2022-09-08 Sold (MLS) $277,000 Hive MLS
- 2022-09-08 Sold (MLS) $277,000 HABR
- 2022-07-22 Listed $279,990 Hive MLS
- 2022-07-22 Listed $279,990 HABR
- 2021-04-27 Sold (MLS) $229,700 Hive MLS
- 2020-12-22 Listed $226,700 Hive MLS
- 2020-12-22 Listed $226,700 Hive MLS
Property tax history
+57.5%/yrLatest (2025): $3,446 · -2.6% YoY. Source: county tax records.
Cash-flow waterfall
monthlySold comps — $/sqft
last 12 mo · ≤1 miLoading sold comps…