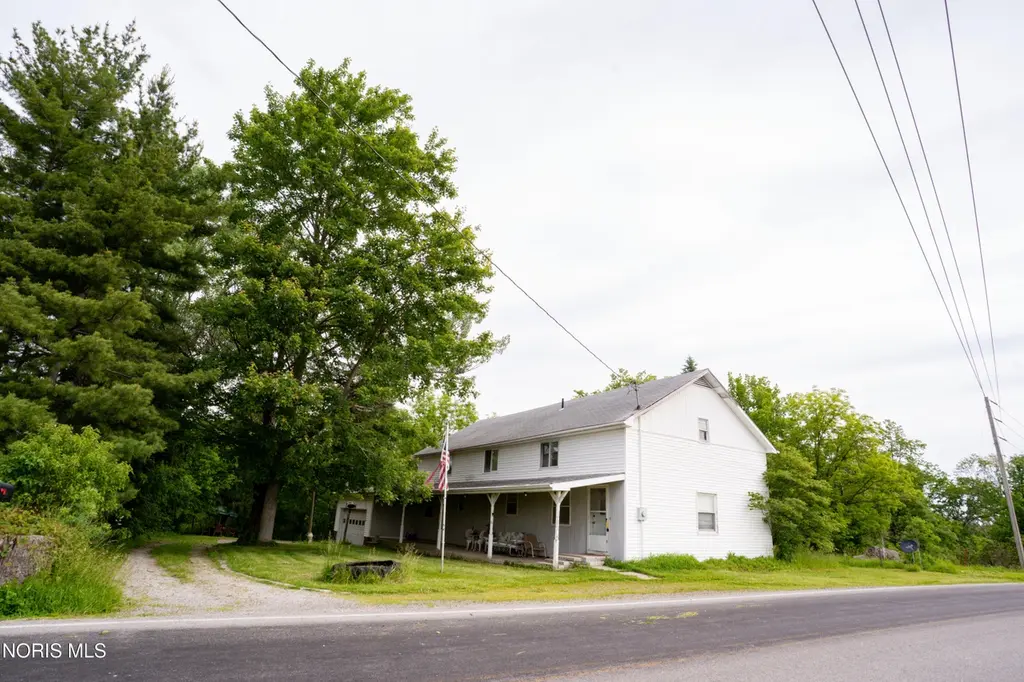
2883 County Road 24 · Stryker, OH
Flood risk 3/10 · Minor
- FEMA flood zone
- A
- Chance of flooding over 30 yrs
- 0.18%
- Est. flood insurance / yr
- $946 – $6,584
Fire risk 1/10 · Minimal
- Est. fire insurance / yr
- $713 – $1,323
Heat risk 3/10 · Minor
- Hot days now (above 100°F)
- 7 days/yr
- Hot days in 30 yrs
- 17 days/yr
Wind risk 2/10 · Minimal
- Chance of severe wind over 30 yrs
- —
Air-quality risk 2/10 · Minimal
- Unhealthy air days now
- 1 days/yr
- Unhealthy air days in 30 yrs
- 3 days/yr
Risk factors via First Street. Map © Google.
Why this score? — see what drove the B grade
The composite is a weighted blend of 9 inputs, each scored 0–100. Each bar is that input's sub-score; the figure is the points it added to the 100-point composite (weight × sub-score).
- Cash flow +30.0/30.0
- DSCR +10.0/10.0
- 1% rule +8.6/10.0
- ARV discount +7.5/15.0
- Schools +6.3/10.0
- Livability +3.6/5.0
- Rent growth +2.5/5.0
- Condition / age +2.2/5.0
- Appreciation +0.0/10.0
$99,000
🖨 Deal sheet 📄 Offer letter ✓ Due diligence
Listing remarks MLS
Large family home with huge rooms, country kitchen and an abundance of cabinets. Condition of appliances is not warranted. Property is being sold "as is".
Key facts
- Owner's retreat
- Flexible floor plan
- Spacious interior
Tags
Property features AI
Exterior
- Parking: Attached 2-car garage
- Utilities: Electricity connected; Propane; Septic tank; Well water
- Home design: Single-family residence (house); One and one-half levels; Not attached to other structures; No common walls
- Construction: Aluminum siding; Block foundation
- Exterior features: Private yard; Covered porch; Side porch; Shingle roof
Interior
- Kitchen: Gas range; Refrigerator
- Bedrooms: Upper-level bedrooms (connected primary bedroom to bathroom); Additional bedrooms on main and upper levels
- Flooring: Carpet; Wood
- Bathrooms: 2 full bathrooms
- Heating & cooling: Forced air propane heating; Window air conditioning unit(s)
- Interior features: Eat-in kitchen; Storage
- Laundry & utility: Laundry on main level
Neighborhood map
What this means for you Summary
Snapshot
- This is a 4-bed/2.0-bath single-family listed at $99k. Condition is rated fair.
Deal economics
- At list price, monthly cash flow is $67 ($803/yr) — positive.
- The deal already cash-flows at list — no discount required.
- Meets the 1% rule at list price ($1k rent vs $99k).
- Recommended offer: $98k (1.5% below list) — sets the bar for market timing.
Location & tenants
- Location reads 72/100 on livability (#361 in OH) — a middle-class / working-renter tenant base. Strengths: crime A+, cost of living A+, housing A+; Watch: amenities F, commute F, health & safety F.
- Stryker Local (rural): math 73% / reading 73% proficiency, ranked #226 of 802 in OH (top 28%) — strong family-tenant draw, lease renewals of 3-5y typical.
- Zoned schools: Stryker Elementary School (math 62% / reading 67%, grade B, #522 of 1,584 statewide, top 36%, 239 students, 0% FRL); Stryker High School (math 67% / reading 67%, grade B, #137 of 781 statewide, top 19%, 150 students, 98% FRL).
- Market conditions: 7 active listings in the ZIP; solid renter incomes; 40 units permitted in Williams County in 2024 (0 in 5+ unit buildings).
Forward outlook
- Local home prices are declining (-3.0%/yr); year-one equity from $684 of loan paydown is wiped out by about $3k of value loss. Plan a longer hold.
- Williams County population projected at -14% by 2050 — secular population decline; favor cash flow + early exit over multi-decade hold.
Negotiation context
- It's been on market 17 days — a 2% lower offer ($98k) is reasonable based on typical stale-listing flexibility.
- 2 sale attempts since 23y ago; this cycle's ask has dropped $11k (10%) from the opening price — seller is motivated, your offer sets the floor, not the list.
- Current owner paid $62k; list at $99k implies a 60% gain — meaningful room to come down on a strong offer.
Risks & watch-outs
- Watch-outs: flood insurance adds $314/mo; built in 1920 — expect roof / HVAC / electrical / plumbing capex.
- Climate carrying-cost: in FEMA flood zone A (mandatory federal flood insurance) — expect insurance premiums to compound above CPI over the hold.
Questions for the listing agent
- Have any recent inspections been done? Can we get a copy of the seller's disclosures and any deferred-maintenance estimates?
- Built in 1920 — when were the roof, HVAC, electrical panel, plumbing, and water heater last replaced?
- What's the actual annual flood-insurance premium (NFIP or private), and is the property in a SFHA with mandatory coverage?
- Is there a deadline driving the sale (1031 exchange, divorce, estate, relocation)? That informs how much negotiation room exists.
- Schools are A-rated — typically a magnet for longer-tenancy family renters. What's the average tenant stay here, and is there a school-zone premium baked into asking?
- What's the average days-on-market for RENTAL listings here right now (not sales)? A rising rental-DOM trend means longer vacancies and softer asking-rent achievability than the comps imply.
- What's the recent tenant-quality profile in this submarket — average credit score on applications, eviction rate, late-payment / NSF rate, and stable-employment percentage? A property-management company in the area should have these aggregated.
- How much new for-sale + rental construction is in the pipeline within 1–3 miles? Heavy new supply typically softens prices + rents 12–24 months out; constrained supply supports both.
Investment metrics
- 1% rule
- 1.36% ✓
- Cap rate
- 10.91%
- Cash-on-cash
- 16.48%
- DSCR
- 1.73
- GRM
- 6.1
CMA / ARV
No comps found within radius.
Projected returns pro-forma
-3.0% appreciation · 3.0% rent growth · sell at horizon
- IRR
- -11.5%
- Equity multiple
- 0.58×
- Total profit
- $-11,565
- Equity at exit
- $14,761
- IRR
- -2.0%
- Equity multiple
- 0.87×
- Total profit
- $-3,714
- Equity at exit
- $8,560
Cash invested: $27,720 (down + closing). Projections, not guarantees.
Landlord ↔ Tenant lean methodology
- Overall (STATE)
- 73 Landlord-Friendly
- State Ohio
- 73 Landlord-Friendly · R+6
- County
- — inherits STATE
- City
- — inherits STATE
ZIP-level market 43557
- Home prices YoY
- -8.3%
- Active inventory
- 7
- Price-to-rent
- 6.1×
Monthly cashflow live
- Estimated rent
- $1,348 medium interval (Pro) →
- Mortgage (P&I)
- −$519
- Tax est. 1.5%
- −$124 /mo · $1,485/yr
- Insurance
- −$41
- Flood insurance flood zone
- −$314 /mo · $3,765/yr
- HOA
- −$0
- Vacancy / Maint / Mgmt
- −$283
- Net cashflow
- $67
Break-even live
UW: 25.0% down · 7.5% · 30yr · 1.5% tax · 5.0% vac · 8.0% maint · 8.0% mgmt
Financing live
Cash to close
- Down payment
- $24,750
- Closing costs
- $2,970
- Reserves months
- —
- Total cash needed
- —
Loan-product check · same deal, 3 products live
Conventional
25% down · 7.5% · 30yr
- Down + closing
- —
- Monthly P&I
- —
- Monthly cashflow
- —
- DSCR
- —
- Eligible?
- —
Personal DTI + credit; lowest rate.
DSCR
20% down · 8.5% · 30yr
- Down + closing
- —
- Monthly P&I
- —
- Monthly cashflow
- —
- DSCR
- —
- Eligible?
- —
No personal income docs; deal must DSCR.
Hard money
10% down · 12.0% · 12mo
- Down + closing
- —
- Monthly P&I
- —
- Monthly cashflow
- —
- DSCR
- —
- Eligible?
- —
Short-term bridge; refi at stabilization.
Listing history 16 events
-
2026-06-18price $99,000 Active 17 DOM
-
2026-06-18days on market $110,000 Active 17 DOM
-
2026-06-17days on market $110,000 Active 16 DOM
-
2026-06-17status $110,000 Active 15 DOM
-
2026-06-16days on market $110,000 Contingent 15 DOM
-
2026-06-15days on market $110,000 Contingent 14 DOM
-
2026-06-14status $110,000 Contingent 12 DOM
-
2026-06-13days on market $110,000 Active 12 DOM
-
2026-06-12days on market $110,000 Active 11 DOM
-
2026-06-09days on market $110,000 Active 8 DOM
-
2026-06-08days on market $110,000 Active 7 DOM
-
2026-06-08days on market $110,000 Active 6 DOM
-
2026-06-07days on market $110,000 Active 5 DOM
-
2026-06-04days on market $110,000 Active 2 DOM
-
2026-06-01remarks 693-char remark
-
2026-06-01$110,000 Active 1 DOM
ⓘ Source: listings_history table (triggers on properties + properties_extension) + one-shot
backfill from property_details.listing_events for pre-trigger history.
Climate risk First Street
- Flood 3/10 Moderate FEMA zone A · 18% chance over 30 yrs
- Wildfire 1/10 Low
- Heat 3/10 Moderate 7 d/yr ≥100°F today · 17 d/yr by 30 yrs out
- Wind 2/10 Low
- Air quality 2/10 Low 1 unhealthy d/yr today · 3 by 30 yrs out
Nearby sold comps map
Loading sold comps map…
Walkable amenities ~0.75 mi
Loading nearby amenities…
Taxation est. · year 1
- Rental income
- $16,175
- − Mortgage interest
- −$5,546
- − Property taxes
- −$1,485
- − Insurance
- −$4,260
- − Repairs & maintenance
- −$1,294
- − Management
- −$1,294
- − Depreciation
- −$2,880
- Taxable loss
- −$583
- Est. tax savings @ 24.0%
- +$140
- After-tax cash flow
- $943/yr
For passive investors: Depreciation is non-cash, so a rental often shows a tax loss while cash-flowing — sheltering income. Rental losses are passive: they offset passive income freely, and up to $25,000/yr can offset ordinary (W-2) income if you actively participate and your MAGI is under $100k (phasing out to $0 by $150k); unused losses carry forward. On sale, claimed depreciation is recaptured at up to 25%, and gains may owe capital-gains tax (a 1031 exchange can defer both). Figures are a year-1 estimate at your 24.0% rate — not tax advice; consult a CPA.
Condition & rehab AI · 12 photos
This home requires significant repairs and updates to improve its condition and increase its value. The most impactful updates include painting, replacing flooring, cabinets, and fixtures, as well as landscaping and HVAC system replacement.
Repairs flagged
- Major siding — Severe weathering and peeling paint.
- Major interior walls — Signs of water damage and peeling paint.
- Major kitchen cabinets — Outdated and worn-out appearance.
- Major bathroom fixtures — Outdated and worn-out appearance.
- Major flooring — Worn carpet and flooring in multiple rooms.
- Major HVAC system — No visible damage, but may need inspection and replacement.
- Major landscaping — Overgrown lawn and lack of landscaping.
Value-add opportunities
- Resale Paint interior walls — Fresh paint can make a significant difference in the home's appearance.
- Resale Replace flooring — New flooring can improve the home's overall appearance and increase its value.
- Resale Replace kitchen cabinets — New cabinets can make the kitchen more functional and visually appealing.
- Resale Replace bathroom fixtures — New fixtures can make the bathrooms more functional and visually appealing.
- Both Landscaping and yard work — A well-maintained yard can increase the home's curb appeal and rental value.
- Resale HVAC system replacement — A new HVAC system can improve the home's comfort and energy efficiency, increasing its value.
- Resale Replace exterior siding — New siding can improve the home's curb appeal and increase its value.
Renovation cost estimate screening
| Repair item | Severity | Est. cost |
|---|---|---|
| siding · Severe weathering and peeling paint. | Major | $15,000–50,000 |
| interior walls · Signs of water damage and peeling paint. | Major | $15,000–50,000 |
| kitchen cabinets · Outdated and worn-out appearance. | Major | $15,000–50,000 |
| bathroom fixtures · Outdated and worn-out appearance. | Major | $15,000–50,000 |
| flooring · Worn carpet and flooring in multiple rooms. | Major | $15,000–50,000 |
| HVAC system · No visible damage, but may need inspection and replacement. | Major | $15,000–50,000 |
| landscaping · Overgrown lawn and lack of landscaping. | Major | $15,000–50,000 |
| Total estimated repair cost · 7 items | $105,000–350,000 |
Value-add ROI direction
- Resale Paint interior walls — Fresh paint can make a significant difference in the home's appearance. ↑
- Resale Replace flooring — New flooring can improve the home's overall appearance and increase its value. ↑
- Resale Replace kitchen cabinets — New cabinets can make the kitchen more functional and visually appealing. ↑
- Resale Replace bathroom fixtures — New fixtures can make the bathrooms more functional and visually appealing. ↑
- Both Landscaping and yard work — A well-maintained yard can increase the home's curb appeal and rental value. ↑
- Resale HVAC system replacement — A new HVAC system can improve the home's comfort and energy efficiency, increasing its value. ↑
- Resale Replace exterior siding — New siding can improve the home's curb appeal and increase its value. ↑
ⓘ Cost ranges are severity-bucket heuristics (US national rule-of-thumb). Get contractor quotes + a written scope before underwriting a rehab budget.
Schools (NCES district)
- District
- Stryker Local
- NCES district ID
- 3905065
- Math proficiency
- 73% ▲ 3.00%
- Reading proficiency
- 73% ▲ 3.00%
- Median HH income
- $52,467
- Composite
- 63.17/100
- National rank
- #1305
- State rank
- #226 of 802 in OH
Livability — Stryker
- Score
- 72/100
- State rank
- #361
- US rank
- #5865
Category grades
Schools grade is shown separately in the Schools card above.
Census & demographics
- County
- Williams · 37,585 people
- Population (ZIP)
- 3,219
- Household income
- $80,163
- Rent vs Own
- Severe rent burden
- 11.6
Population outlook (Williams County) Hauer SSP2
- Today (2025)
- 36,125 people
- By 2030
- 35,264 · -2.4%
- By 2040
- 33,264 · -7.9%
- By 2050
- 31,072 · -14.0%
- By 2075
- 26,553 · -26.5%
- By 2100
- 21,318 · -41.0%
Race, ethnicity, and origin ACS 2023
- Neighborhood character
- Predominantly White (80%)
- Race & ethnicity
- White 80% Hispanic / Latino 12% Two or more races 6% Black 5% Native American 3%
- Hispanic origin (detail)
- Mexican 7% Puerto Rican 1%
- Common ancestry
- Lithuanian 4% Romanian 2% Slovak 2%
- Foreign-born
- 1% · Canada
- Languages at home
- 96% English-only · Spanish 4%
Political lean MEDSL · Williams
- 2024 margin
- Solid R (+48.2) · D 25.4% · R 73.7%
- 2008→2024 swing
- -39.0pp toward R · 2008: -9.3pp · 2024: -48.2pp
- All cycles
- 2024: R+48.2 2020: R+46.2 2016: R+43.8 2012: R+16.3 2008: R+9.3
Not yet ingested
- Civics
- —
Market trends
- HPI YoY
- ▼ -20.03%
- Current HPI
- 220.9472
- Rent YoY
- —
- Metro
- —
- State GDP YoY
- ▲ 1.98%
- F500 in state
- 48
Industry mix (Fortune 500 HQ in OH)
| Industry | F500 HQs | Revenue |
|---|---|---|
| Insurance | 3 | $145B |
|
||
| Industrial Machinery | 3 | $49B |
|
||
| Financial Services | 3 | $24B |
|
||
| Consumer Goods | 2 | $93B |
|
||
| Aerospace / Defense | 2 | $47B |
|
||
| Utilities | 2 | $33B |
|
||
Price history
+84.9% since first listed4 events — show timeline
- 2026-06-01 Listed $110,000 NORIS
- 2003-07-14 Sold (MLS) $62,000 NORIS
- 2003-06-11 Price Changed $62,000 NORIS
- 2003-02-07 Listed $59,500 NORIS
Cash-flow waterfall
monthlySold comps — $/sqft
last 12 mo · ≤1 miLoading sold comps…