958 Waterview Ln · Carolina Shores, NC
Flood risk 5/10 · Moderate
- FEMA flood zone
- X (unshaded)
- Chance of flooding over 30 yrs
- 0.66%
- Est. flood insurance / yr
- $507 – $1,088
Fire risk 4/10 · Minor
- Est. fire insurance / yr
- $906 – $1,684
Heat risk 9/10 · Severe
- Hot days now (above 106°F)
- 7 days/yr
- Hot days in 30 yrs
- 18 days/yr
Wind risk 8/10 · Major
- Chance of severe wind over 30 yrs
- 99.0%
Air-quality risk 2/10 · Minimal
- Unhealthy air days now
- 1 days/yr
- Unhealthy air days in 30 yrs
- 1 days/yr
Risk factors via First Street. Map © Google.
Why this score? — see what drove the F grade
The composite is a weighted blend of 9 inputs, each scored 0–100. Each bar is that input's sub-score; the figure is the points it added to the 100-point composite (weight × sub-score).
- Cash flow +12.7/30.0
- Schools +3.9/10.0
- DSCR +3.8/10.0
- Livability +3.2/5.0
- 1% rule +2.5/10.0
- Rent growth +2.5/5.0
- Condition / age +2.5/5.0
- ARV discount +0.0/15.0
- Appreciation +0.0/10.0
$299,800
🖨 Deal sheet 📄 Offer letter ✓ Due diligence
Listing remarks MLS
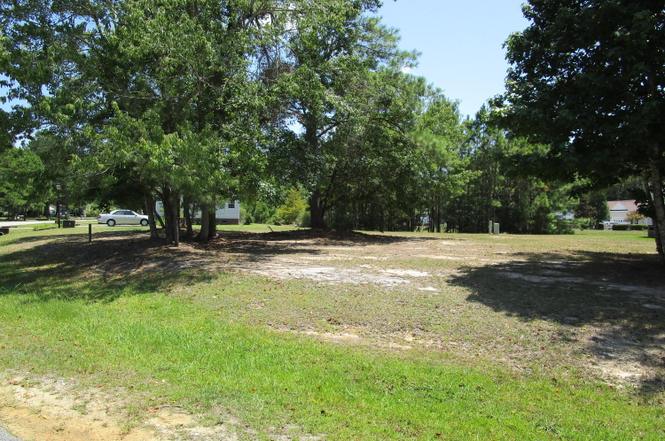
Opportunity! One of the few remaining residential building lots in The Village at Calabash. Located on one of the subdivisions stocked fishing ponds, this lot is located within the Town of Carolina Shores. There are low Property Owners Association fees; a community swimming pool and clubhouse. The Village at Calabash is a well-established manufactured housing community where pride of ownership is evident. There are paved streets, public water and sewer. This would be a perfect site for your vacation or retirement manufactured home. Located just minutes from the beautiful south Brunswick Island beaches, the center of town, shopping, great restaurants and championship golf. Opportunity usually does not knock twice, so call today and start enjoying the coastal Carolina lifestyle tomorrow!
Key facts
- Pool area
- Gas fireplace
- Club house
Tags
Neighborhood map
What this means for you Summary
Snapshot
- This is a 3-bed/2.0-bath manufactured listed at $300k.
Deal economics
- At list price, monthly cash flow is $-36 ($-427/yr) — negative.
- To cash-flow at today's rent, offer at most $294k (2.1% below list).
- To meet the 1% rule (rent ≥ 1% of price), the offer needs to be $226k (24.7% below list).
- Recommended offer: $226k (24.7% below list) — sets the bar for 1% rule.
- Cap rate 6.2% vs local median 3.9% in Carolina Shores — top-decile yield for the area; either an underpriced asset or a hidden risk that comps aren't pricing in. Stress-test before assuming the spread holds.
Location & tenants
- Location reads 64/100 on livability (#352 in NC) — a middle-class / working-renter tenant base. Strengths: housing A+, crime A, cost of living B+; Watch: health & safety D, schools F, amenities F.
- Brunswick County Schools (rural): math 45% / reading 47% proficiency, ranked #82 of 178 in NC (top 46%) — families likely to look elsewhere, expect single-tenant / working-renter base with shorter leases.
- Market conditions: 691 active listings in the ZIP; 11 comparable units currently listed for rent nearby; rentals at typical pace (median 21d on market — plan ~3-4 weeks tenant-placement turnaround); solid renter incomes; 6,112 units permitted in Brunswick County in 2024 (990 in 5+ unit buildings).
- This rent runs 36% of the median local income ($75k/yr) — at the standard rent-burdened threshold; future hikes will face affordability resistance.
Forward outlook
- Local home prices are declining (-3.0%/yr); year-one equity from $2k of loan paydown is wiped out by about $9k of value loss. Plan a longer hold.
- Brunswick County population projected at +36% by 2050 — long-run rental-demand tailwind backs the buy-and-hold thesis.
Negotiation context
- It's been on market 90 days — a 6% lower offer ($282k) is reasonable based on typical stale-listing flexibility.
- 2 sale attempts since 9y ago; this cycle's ask has dropped $16k (5%) from the opening price — seller is motivated, your offer sets the floor, not the list.
- Current owner paid $20k; list at $300k implies a 1399% gain — meaningful room to come down on a strong offer.
Risks & watch-outs
- Climate carrying-cost: moderate flood risk; severe wind risk, 99% chance of damaging wind over 30y; extreme-heat days projected 7→18/yr by 2055 (HVAC capex compounding) — expect insurance premiums to compound above CPI over the hold.
Questions for the listing agent
- What do current leases actually rent for vs. the listed asking? Can we see a recent rent roll and the last 12 months of T-12 income?
- It's been on market 90 days. Have you received any prior offers? Is the seller open to a 25% concession, seller financing, or rate buy-down credit?
- Why hasn't it sold? Are there any deal-killer items the seller is aware of (foundation, flood, title, zoning, code violations)?
- Is there a deadline driving the sale (1031 exchange, divorce, estate, relocation)? That informs how much negotiation room exists.
- Schools are F-rated, which usually means shorter tenancies and higher turnover. Who's the typical renter profile here, and what's been the actual vacancy rate?
- The area grade is low — what's the realistic commute time and amenity access for the typical tenant pool here? Any planned neighborhood developments (good or bad) we should know about?
- What's the average days-on-market for RENTAL listings here right now (not sales)? A rising rental-DOM trend means longer vacancies and softer asking-rent achievability than the comps imply.
- What's the recent tenant-quality profile in this submarket — average credit score on applications, eviction rate, late-payment / NSF rate, and stable-employment percentage? A property-management company in the area should have these aggregated.
- How much new for-sale + rental construction is in the pipeline within 1–3 miles? Heavy new supply typically softens prices + rents 12–24 months out; constrained supply supports both.
Investment metrics
- 1% rule
- 0.75% ✗
- Cap rate
- 6.15%
- Cash-on-cash
- -0.51%
- DSCR
- 0.98
- GRM
- 11.1
CMA / ARV
- ARV (on-the-fly)
- $239,904
- Comps found
- 12
Show comp detail 12 sales within ~0.75 mi
| Address | Dist | Beds/Ba | Sqft | Sold | Price | $/sf | Match |
|---|---|---|---|---|---|---|---|
| 845 Watson Ave SW | 0.20mi | 3/2.0 | 1,811 (-5%) | 3mo | $273,000 | $151 | 80 |
| 1030 Palm Ct SW | 0.32mi | 3/2.0 | 1,928 (+1%) | 7mo | $278,500 | $144 | 77 |
| 891 Palmer Dr | 0.29mi | 3/2.0 | 1,792 (-6%) | 1mo | $260,000 | $145 | 76 |
| 903 Wedge Ct SW | 0.22mi | 3/2.0 | 1,848 (-3%) | 12mo | $222,000 | $120 | 75 |
| 1062 Cedar Ct SW | 0.38mi | 3/2.0 | 1,943 (+2%) | 13mo | $245,000 | $126 | 68 |
| 815 Watson Ave | 0.40mi | 3/2.0 | 1,770 (-7%) | 10mo | $223,000 | $126 | 61 |
| 1073 Captains Ct | 0.46mi | 3/2.0 | 1,675 (-12%) | 2mo | $200,000 | $119 | 57 |
| 1024 Palm Ct SW | 0.29mi | 2/2.0 (-1) | 1,680 (-12%) | 6mo | $196,000 | $117 | 57 |
| 822 Watson Ave SW | 0.36mi | 3/2.0 | 2,142 (+12%) | 18mo | $244,000 | $114 | 48 |
| 831 Bogie Ln | 0.44mi | 3/3.0 | 1,704 (-10%) | 15mo | $253,000 | $148 | 46 |
| 1092 Nautical Ln SW | 0.67mi | 3/3.0 | 1,720 (-10%) | 13mo | $230,000 | $134 | 38 |
| 1111 Captains Ct SW | 0.73mi | 3/2.0 | 1,620 (-15%) | 9mo | $200,000 | $123 | 34 |
Match score weights: distance 35% · size 25% · config 20% · recency 20%. Top-matched comps best support the ARV.
Projected returns pro-forma
-3.0% appreciation · 3.0% rent growth · sell at horizon
- IRR
- -17.2%
- Equity multiple
- 0.39×
- Total profit
- $-50,969
- Equity at exit
- $44,701
- IRR
- -9.2%
- Equity multiple
- 0.43×
- Total profit
- $-47,795
- Equity at exit
- $25,921
Cash invested: $83,944 (down + closing). Projections, not guarantees.
Landlord ↔ Tenant lean methodology
- Overall (STATE)
- 85 Strongly Landlord-Friendly
- State North Carolina
- 85 Strongly Landlord-Friendly · R+3
- County
- — inherits STATE
- City
- — inherits STATE
ZIP-level market 28467
- Home prices YoY
- -33.7%
- Active inventory
- 691
- Price-to-rent
- 11.1×
Monthly cashflow live
- Estimated rent
- $2,258 high interval (Pro) →
- Mortgage (P&I)
- −$1,572
- Tax from tax record
- −$123 /mo · $1,472/yr
- Insurance
- −$125
- HOA
- −$0
- Vacancy / Maint / Mgmt
- −$474
- Net cashflow
- $-36
Break-even live
UW: 25.0% down · 7.5% · 30yr · 1.5% tax · 5.0% vac · 8.0% maint · 8.0% mgmt
Financing live
Cash to close
- Down payment
- $74,950
- Closing costs
- $8,994
- Reserves months
- —
- Total cash needed
- —
Loan-product check · same deal, 3 products live
Conventional
25% down · 7.5% · 30yr
- Down + closing
- —
- Monthly P&I
- —
- Monthly cashflow
- —
- DSCR
- —
- Eligible?
- —
Personal DTI + credit; lowest rate.
DSCR
20% down · 8.5% · 30yr
- Down + closing
- —
- Monthly P&I
- —
- Monthly cashflow
- —
- DSCR
- —
- Eligible?
- —
No personal income docs; deal must DSCR.
Hard money
10% down · 12.0% · 12mo
- Down + closing
- —
- Monthly P&I
- —
- Monthly cashflow
- —
- DSCR
- —
- Eligible?
- —
Short-term bridge; refi at stabilization.
Rent comps 11 comps
| Address | Beds | Baths | Sqft | Rent | $/sqft | DOM | Units | Dist |
|---|---|---|---|---|---|---|---|---|
| 1016 Harbor Dr Calabash, NC | 4.0 | 2.0 | 1780 | $2,400 | $1.35 | 14d | 1 | 0.32mi |
| 1035 Brightwater Way Calabash, NC | 1.0–3.0 | 1.0–2.5 | 1327 | $2,145 | $1.62 | 23d | 1 | 0.50mi |
| 1063 Harbor Dr Calabash, NC | 3.0 | 2.0 | 1421 | $2,200 | $1.55 | 21d | 1 | 0.72mi |
| 834 Greenwood Ct Calabash, NC | 3.0 | 2.0 | 1475 | $2,100 | $1.42 | 14d | 1 | 1.02mi |
| 31 Quaker Ridge Dr Calabash, NC | 2.0–3.0 | 2.0 | 1411 | $2,292 | $1.62 | 21d | 51 | 1.06mi |
| 2033 Wild Indigo CIR NW Calabash, NC | 3.0 | 3.0 | 1457 | $1,775 | $1.22 | 23d | 1 | 1.17mi |
| 70 Callaway Dr NW OCEAN ISL BCH, NC | 2.0–3.0 | 2.0 | 1324 | $1,882 | $1.42 | 14d | 35 | 1.22mi |
| 614 Silos Way Carolina Shores, NC | 3.0 | 2.0 | 1750 | $2,500 | $1.43 | 23d | 1 | 1.23mi |
| 660 Aubrey Ln Calabash, NC | 1.0–2.0 | 1.0–2.0 | 1081 | $2,870 | $2.65 | 14d | 69 | 1.28mi |
| 891 Mh Marina Rd #3 Carolina Shores, NC | 2.0 | 2.0 | 1250 | $1,300 | $1.04 | 14d | 1 | 1.49mi |
| 1086 Mille Ave Calabash, NC | 3.0 | 2.0 | 1232 | $2,000 | $1.62 | 23d | 1 | 1.49mi |
Listing history 11 events
-
2026-06-03days on market $299,800 Active 90 DOM
-
2026-06-02days on market $299,800 Active 89 DOM
-
2026-06-01days on market $299,800 Active 88 DOM
-
2026-05-31days on market $299,800 Active 87 DOM
-
2026-05-30days on market $299,800 Active 86 DOM
-
2026-03-13price $299,800
-
2026-03-05$315,900 Active
-
2021-08-20soldstatus $20,000
-
2018-10-19soldstatus $21,500
-
2018-10-18soldstatus $21,900 796-char remark
Show marketing remark (796 chars)
Opportunity! One of the few remaining residential building lots in The Village at Calabash. Located on one of the subdivisions stocked fishing ponds, this lot is located within the Town of Carolina Shores. There are low Property Owners Association fees; a community swimming pool and clubhouse. The Village at Calabash is a well-established manufactured housing community where pride of ownership is evident. There are paved streets, public water and sewer. This would be a perfect site for your vacation or retirement manufactured home. Located just minutes from the beautiful south Brunswick Island beaches, the center of town, shopping, great restaurants and championship golf. Opportunity usually does not knock twice, so call today and start enjoying the coastal Carolina lifestyle tomorrow!
-
2017-08-01$25,900 796-char remark
Show marketing remark (796 chars)
Opportunity! One of the few remaining residential building lots in The Village at Calabash. Located on one of the subdivisions stocked fishing ponds, this lot is located within the Town of Carolina Shores. There are low Property Owners Association fees; a community swimming pool and clubhouse. The Village at Calabash is a well-established manufactured housing community where pride of ownership is evident. There are paved streets, public water and sewer. This would be a perfect site for your vacation or retirement manufactured home. Located just minutes from the beautiful south Brunswick Island beaches, the center of town, shopping, great restaurants and championship golf. Opportunity usually does not knock twice, so call today and start enjoying the coastal Carolina lifestyle tomorrow!
ⓘ Source: listings_history table (triggers on properties + properties_extension) + one-shot
backfill from property_details.listing_events for pre-trigger history.
Tax reassessment forecast NC · Resets to sale price
- Current annual tax
- $1,472 · $123/mo
- Projected year-2 tax
- $2,458 · $205/mo
- Expected delta
- +$986/yr (+$82/mo · 67.0%)
ⓘ Screening estimate from a state-policy table — verify with the county assessor before closing.
Climate risk First Street
- Flood 5/10 Major FEMA zone X (unshaded) · 66% chance over 30 yrs
- Wildfire 4/10 Moderate
- Heat 9/10 Extreme 7 d/yr ≥106°F today · 18 d/yr by 30 yrs out
- Wind 8/10 Severe 99% chance of damaging wind over 30 yrs
- Air quality 2/10 Low 1 unhealthy d/yr today · 1 by 30 yrs out
Nearby sold comps map
Loading sold comps map…
Walkable amenities ~0.75 mi
Loading nearby amenities…
Taxation est. · year 1
- Rental income
- $27,101
- − Mortgage interest
- −$16,793
- − Property taxes
- −$1,472
- − Insurance
- −$1,499
- − Repairs & maintenance
- −$2,168
- − Management
- −$2,168
- − Depreciation
- −$8,721
- Taxable loss
- −$5,721
- Est. tax savings @ 24.0%
- +$1,373
- After-tax cash flow
- $946/yr
For passive investors: Depreciation is non-cash, so a rental often shows a tax loss while cash-flowing — sheltering income. Rental losses are passive: they offset passive income freely, and up to $25,000/yr can offset ordinary (W-2) income if you actively participate and your MAGI is under $100k (phasing out to $0 by $150k); unused losses carry forward. On sale, claimed depreciation is recaptured at up to 25%, and gains may owe capital-gains tax (a 1031 exchange can defer both). Figures are a year-1 estimate at your 24.0% rate — not tax advice; consult a CPA.
Schools (NCES district)
- District
- Brunswick County Schools
- NCES district ID
- 3700420
- Math proficiency
- 45% ▲ 4.00%
- Reading proficiency
- 47% ▲ 4.00%
- Median HH income
- $47,494
- Composite
- 39.23/100
- National rank
- #4011
- State rank
- #82 of 178 in NC
Livability — Carolina Shores
- Score
- 64/100
- State rank
- #352
- US rank
- #13907
Category grades
Schools grade is shown separately in the Schools card above.
Census & demographics
- Census place
- Carolina Shores, NC
- County
- Brunswick County · 131,536 people
- City population
- 13,313
- Metro
- Myrtle Beach-Conway-North Myrtle Beach, SC-NC
- Population (ZIP)
- 13,313
- Household income
- $75,341
- Rent vs Own
- Severe rent burden
- 81.0
Population outlook (Brunswick County) Hauer SSP2
- Today (2025)
- 152,111 people
- By 2030
- 165,705 · +8.9%
- By 2040
- 188,494 · +23.9%
- By 2050
- 206,228 · +35.6%
- By 2075
- 237,876 · +56.4%
- By 2100
- 251,451 · +65.3%
Race, ethnicity, and origin ACS 2023
- Neighborhood character
- Predominantly White (90%)
- Race & ethnicity
- White 90% Two or more races 4% Black 3% Hispanic / Latino 2%
- Common ancestry
- Slovak 5% Romanian 5% Lithuanian 3%
- Foreign-born
- 3% · Canada
- Languages at home
- 98% English-only · Spanish 1%
Political lean MEDSL · Brunswick
- 2024 margin
- Strong R (+24.9) · D 37.2% · R 62.0%
- 2008→2024 swing
- -6.9pp toward R · 2008: -17.9pp · 2024: -24.9pp
- All cycles
- 2024: R+24.9 2020: R+25.0 2016: R+28.7 2012: R+22.2 2008: R+17.9
Not yet ingested
- Civics
- —
Market trends
- HPI YoY
- ▼ -67.90%
- Current HPI
- 133.7186
- Rent YoY
- —
- Metro
- Myrtle Beach-Conway-North Myrtle Beach, SC-NC
- State GDP YoY
- ▲ 3.28%
- F500 in state
- 26
Industry mix (Fortune 500 HQ in NC)
| Industry | F500 HQs | Revenue |
|---|---|---|
| Financial Services | 2 | $213B |
|
||
| Retail | 2 | $95B |
|
||
| Industrial Conglomerate | 1 | $38B |
|
||
| Metals / Steel | 1 | $35B |
|
||
| Utilities | 1 | $30B |
|
||
| Industrial Machinery | 1 | $19B |
|
||
Price history
+1057.5% since first listed6 events — show timeline
- 2026-03-13 Price Changed $299,800 ForSaleByOwner.com
- 2026-03-05 Listed $315,900 ForSaleByOwner.com
- 2021-08-20 Sold (Public Records) $20,000 Public Records
- 2018-10-19 Sold (Public Records) $21,500 Public Records
- 2018-10-18 Sold (MLS) $21,900 Hive MLS
- 2017-08-01 Listed $25,900 Hive MLS
Property tax history
+32.1%/yrLatest (2025): $1,472 · +0.0% YoY. Source: county tax records.
Cash-flow waterfall
monthlySold comps — $/sqft
last 12 mo · ≤1 miLoading sold comps…