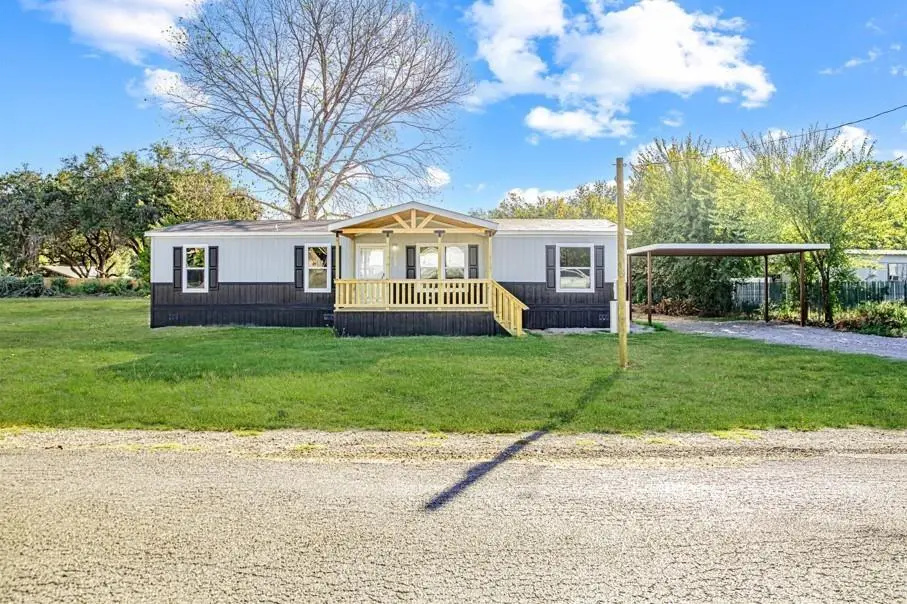
123 Kelly Ct · Reno, TX
Flood risk No data
- FEMA flood zone
- —
- Chance of flooding over 30 yrs
- —
- Est. flood insurance / yr
- —
Fire risk No data
- Est. fire insurance / yr
- —
Heat risk No data
- Hot days now (above threshold)
- —
- Hot days in 30 yrs
- —
Wind risk No data
- Chance of severe wind over 30 yrs
- —
Air-quality risk No data
- Unhealthy air days now
- —
- Unhealthy air days in 30 yrs
- —
Risk factors via First Street. Map © Google.
Why this score? — see what drove the F grade
The composite is a weighted blend of 9 inputs, each scored 0–100. Each bar is that input's sub-score; the figure is the points it added to the 100-point composite (weight × sub-score).
- Cash flow +11.6/30.0
- 1% rule +3.4/10.0
- DSCR +3.4/10.0
- Schools +3.3/10.0
- Rent growth +3.1/5.0
- Livability +3.0/5.0
- Condition / age +2.5/5.0
- ARV discount +0.0/15.0
- Appreciation +0.0/10.0
$254,990
🖨 Deal sheet 📄 Offer letter ✓ Due diligence
Listing remarks MLS
Situated on a 0.34-acre lot outside the city limits, this new 2025 home offers open space and a relaxed country setting in Azle’s Timbercreek Valley. The home at 123 Kelly Ct. features 4 bedrooms and 2 bathrooms with a practical layout designed for everyday living. The main living area opens directly to the kitchen, dining area, and den, creating a connected flow that works well for both daily routines and gatherings. The kitchen features built-in cabinets for extra storage, a functional island with plenty of counter space, making cooking and entertaining a breeze. The den provides flexible space for a home office, second living area, or hobby room. The laundry room is generously sized, perfect for storage and daily tasks. With Low-E windows, the home stays cozy in winter and cool in summer. The primary bedroom includes a private ensuite bathroom and walk-in closet. Outside, enjoy a covered front porch and open yard ideal for outdoor activities, pets, or taking in wide Texas skies. Covered parking is provided by a 20' × 20' carport, perfect for your cars and trucks. This property offers country-style living with no HOA rules, plenty of space, and easy access to nearby amenities. The home is backed by a 1-year manufacturer’s warranty. Schedule your showing today to see all this home has to offer.
Key facts
- Flexible space
- Open space
- Country setting
Tags
Neighborhood map
What this means for you Summary
Snapshot
- This is a 4-bed/2.0-bath land listed at $255k.
Deal economics
- At list price, monthly cash flow is $-80 ($-954/yr) — negative.
- To cash-flow at today's rent, offer at most $243k (4.5% below list).
- To meet the 1% rule (rent ≥ 1% of price), the offer needs to be $213k (16.5% below list).
- Recommended offer: $213k (16.5% below list) — sets the bar for 1% rule.
- Cap rate 5.9% vs local median 2.0% in Reno — top-decile yield for the area; either an underpriced asset or a hidden risk that comps aren't pricing in. Stress-test before assuming the spread holds.
Location & tenants
- Location reads 59/100 on livability (#1,131 in TX) — a working-class tenant base; expect higher turnover. Strengths: cost of living A+, housing A+, crime A; Watch: employment D+, schools D-, amenities F.
- Springtown ISD (town): math 36% / reading 40% proficiency, ranked #435 of 826 in TX (top 53%) — families likely to look elsewhere, expect single-tenant / working-renter base with shorter leases.
- Market conditions: Rents rising (+2.3%/yr); 591 active listings in the ZIP; solid renter incomes; 437 units permitted in Parker County in 2024 (0 in 5+ unit buildings).
Forward outlook
- Local home prices are declining (-3.0%/yr); year-one equity from $2k of loan paydown is wiped out by about $8k of value loss. Plan a longer hold.
- Parker County population projected at +32% by 2050 — long-run rental-demand tailwind backs the buy-and-hold thesis.
Negotiation context
- It's been on market 139 days — a 12% lower offer ($224k) is reasonable based on typical stale-listing flexibility.
- 3 sale attempts with the ask held roughly flat each time — persistent listings suggest the price (not the market) is what's stuck; bring a comps-based counter.
Questions for the listing agent
- What do current leases actually rent for vs. the listed asking? Can we see a recent rent roll and the last 12 months of T-12 income?
- It's been on market 139 days. Have you received any prior offers? Is the seller open to a 16% concession, seller financing, or rate buy-down credit?
- Why hasn't it sold? Are there any deal-killer items the seller is aware of (foundation, flood, title, zoning, code violations)?
- Is there a deadline driving the sale (1031 exchange, divorce, estate, relocation)? That informs how much negotiation room exists.
- Schools are D-rated, which usually means shorter tenancies and higher turnover. Who's the typical renter profile here, and what's been the actual vacancy rate?
- The area grade is low — what's the realistic commute time and amenity access for the typical tenant pool here? Any planned neighborhood developments (good or bad) we should know about?
- What's the average days-on-market for RENTAL listings here right now (not sales)? A rising rental-DOM trend means longer vacancies and softer asking-rent achievability than the comps imply.
- What's the recent tenant-quality profile in this submarket — average credit score on applications, eviction rate, late-payment / NSF rate, and stable-employment percentage? A property-management company in the area should have these aggregated.
- How much new for-sale + rental construction is in the pipeline within 1–3 miles? Heavy new supply typically softens prices + rents 12–24 months out; constrained supply supports both.
Investment metrics
- 1% rule
- 0.84% ✗
- Cap rate
- 5.92%
- Cash-on-cash
- -1.34%
- DSCR
- 0.94
- GRM
- 10.0
CMA / ARV
- ARV (median comp)
- $183,646
- List price
- $254,990
- Delta
- 38.85%
- Verdict
- OVERPRICED
- Comps
- 10 within 1.0 mi
Projected returns pro-forma
-3.0% appreciation · 2.31% rent growth · sell at horizon
- IRR
- -19.3%
- Equity multiple
- 0.33×
- Total profit
- $-47,819
- Equity at exit
- $38,020
- IRR
- -13.4%
- Equity multiple
- 0.24×
- Total profit
- $-53,973
- Equity at exit
- $22,047
Cash invested: $71,397 (down + closing). Projections, not guarantees.
Landlord ↔ Tenant lean methodology
- Overall (STATE)
- 87 Strongly Landlord-Friendly
- State Texas
- 87 Strongly Landlord-Friendly · R+5
- County
- — inherits STATE
- City
- — inherits STATE
ZIP-level market 76020
- Home prices YoY
- -20.6%
- Rents YoY
- 2.3%
- Active inventory
- 591
- Price-to-rent
- 10.0×
Monthly cashflow live
- Estimated rent
- $2,130 medium interval (Pro) →
- Mortgage (P&I)
- −$1,337
- Tax est. 1.5%
- −$319 /mo · $3,825/yr
- Insurance
- −$106
- HOA
- −$0
- Vacancy / Maint / Mgmt
- −$447
- Net cashflow
- $-80
Break-even live
UW: 25.0% down · 7.5% · 30yr · 1.5% tax · 5.0% vac · 8.0% maint · 8.0% mgmt
Financing live
Cash to close
- Down payment
- $63,748
- Closing costs
- $7,650
- Reserves months
- —
- Total cash needed
- —
Loan-product check · same deal, 3 products live
Conventional
25% down · 7.5% · 30yr
- Down + closing
- —
- Monthly P&I
- —
- Monthly cashflow
- —
- DSCR
- —
- Eligible?
- —
Personal DTI + credit; lowest rate.
DSCR
20% down · 8.5% · 30yr
- Down + closing
- —
- Monthly P&I
- —
- Monthly cashflow
- —
- DSCR
- —
- Eligible?
- —
No personal income docs; deal must DSCR.
Hard money
10% down · 12.0% · 12mo
- Down + closing
- —
- Monthly P&I
- —
- Monthly cashflow
- —
- DSCR
- —
- Eligible?
- —
Short-term bridge; refi at stabilization.
Listing history 20 events
-
2026-06-18days on market $254,990 Active 139 DOM
-
2026-06-17days on market $254,990 Active 138 DOM
-
2026-06-16days on market $254,990 Active 137 DOM
-
2026-06-15days on market $254,990 Active 136 DOM
-
2026-06-13days on market $254,990 Active 134 DOM
-
2026-06-13days on market $254,990 Active 133 DOM
-
2026-06-09days on market $254,990 Active 130 DOM
-
2026-06-08days on market $254,990 Active 129 DOM
-
2026-06-07days on market $254,990 Active 128 DOM
-
2026-06-04days on market $254,990 Active 125 DOM
-
2026-06-03days on market $254,990 Active 124 DOM
-
2026-06-02days on market $254,990 Active 123 DOM
-
2026-06-01days on market $254,990 Active 122 DOM
-
2026-05-31days on market $254,990 Active 121 DOM
-
2026-02-24price $254,990 1334-char remark
Show marketing remark (1334 chars)
Situated on a 0.34-acre lot outside the city limits, this new 2025 home offers open space and a relaxed country setting in Azle’s Timbercreek Valley. The home at 123 Kelly Ct. features 4 bedrooms and 2 bathrooms with a practical layout designed for everyday living. The main living area opens directly to the kitchen, dining area, and den, creating a connected flow that works well for both daily routines and gatherings. The kitchen features built-in cabinets for extra storage, a functional island with plenty of counter space, making cooking and entertaining a breeze. The den provides flexible space for a home office, second living area, or hobby room. The laundry room is generously sized, perfect for storage and daily tasks. With Low-E windows, the home stays cozy in winter and cool in summer. The primary bedroom includes a private ensuite bathroom and walk-in closet. Outside, enjoy a covered front porch and open yard ideal for outdoor activities, pets, or taking in wide Texas skies. Covered parking is provided by a 20' × 20' carport, perfect for your cars and trucks. This property offers country-style living with no HOA rules, plenty of space, and easy access to nearby amenities. The home is backed by a 1-year manufacturer’s warranty. Schedule your showing today to see all this home has to offer.
-
2026-02-02historical
-
2026-01-30$259,990 Active 1334-char remark
Show marketing remark (1334 chars)
Situated on a 0.34-acre lot outside the city limits, this new 2025 home offers open space and a relaxed country setting in Azle’s Timbercreek Valley. The home at 123 Kelly Ct. features 4 bedrooms and 2 bathrooms with a practical layout designed for everyday living. The main living area opens directly to the kitchen, dining area, and den, creating a connected flow that works well for both daily routines and gatherings. The kitchen features built-in cabinets for extra storage, a functional island with plenty of counter space, making cooking and entertaining a breeze. The den provides flexible space for a home office, second living area, or hobby room. The laundry room is generously sized, perfect for storage and daily tasks. With Low-E windows, the home stays cozy in winter and cool in summer. The primary bedroom includes a private ensuite bathroom and walk-in closet. Outside, enjoy a covered front porch and open yard ideal for outdoor activities, pets, or taking in wide Texas skies. Covered parking is provided by a 20' × 20' carport, perfect for your cars and trucks. This property offers country-style living with no HOA rules, plenty of space, and easy access to nearby amenities. The home is backed by a 1-year manufacturer’s warranty. Schedule your showing today to see all this home has to offer.
-
2025-10-25$269,990 Active
-
2025-09-23historical
-
2025-05-01$69,000 Active
ⓘ Source: listings_history table (triggers on properties + properties_extension) + one-shot
backfill from property_details.listing_events for pre-trigger history.
Nearby sold comps map
Loading sold comps map…
Walkable amenities ~0.75 mi
Loading nearby amenities…
Taxation est. · year 1
- Rental income
- $25,560
- − Mortgage interest
- −$14,283
- − Property taxes
- −$3,825
- − Insurance
- −$1,275
- − Repairs & maintenance
- −$2,045
- − Management
- −$2,045
- − Depreciation
- −$7,418
- Taxable loss
- −$5,331
- Est. tax savings @ 24.0%
- +$1,279
- After-tax cash flow
- $325/yr
For passive investors: Depreciation is non-cash, so a rental often shows a tax loss while cash-flowing — sheltering income. Rental losses are passive: they offset passive income freely, and up to $25,000/yr can offset ordinary (W-2) income if you actively participate and your MAGI is under $100k (phasing out to $0 by $150k); unused losses carry forward. On sale, claimed depreciation is recaptured at up to 25%, and gains may owe capital-gains tax (a 1031 exchange can defer both). Figures are a year-1 estimate at your 24.0% rate — not tax advice; consult a CPA.
Schools (NCES district)
- District
- Springtown ISD
- NCES district ID
- 4841280
- Math proficiency
- 36% ▼ -14.00%
- Reading proficiency
- 40% ▼ -2.00%
- Median HH income
- $56,136
- Composite
- 33.41/100
- National rank
- #5474
- State rank
- #435 of 826 in TX
Livability — Reno
- Score
- 59/100
- State rank
- #1131
- US rank
- #20008
Category grades
Schools grade is shown separately in the Schools card above.
Census & demographics
- County
- Parker County · 144,797 people
- Metro
- Dallas-Fort Worth-Arlington, TX
- Population (ZIP)
- 34,602
- Household income
- $87,298
- Rent vs Own
- Severe rent burden
- 433.0
Population outlook (Parker County) Hauer SSP2
- Today (2025)
- 147,426 people
- By 2030
- 157,863 · +7.1%
- By 2040
- 177,519 · +20.4%
- By 2050
- 194,786 · +32.1%
- By 2075
- 238,799 · +62.0%
- By 2100
- 264,126 · +79.2%
Race, ethnicity, and origin ACS 2023
- Neighborhood character
- Predominantly White (78%)
- Race & ethnicity
- White 78% Hispanic / Latino 18% Two or more races 9% Black 1%
- Hispanic origin (detail)
- Mexican 15%
- Common ancestry
- Slovak 2% Italian 1% Portuguese 1%
- Foreign-born
- 5% · Canada
- Languages at home
- 89% English-only · Spanish 11%
Political lean MEDSL · Parker
- 2024 margin
- Solid R (+66.4) · D 16.4% · R 82.8%
- 2008→2024 swing
- -11.2pp toward R · 2008: -55.2pp · 2024: -66.4pp
- All cycles
- 2024: R+66.4 2020: R+64.4 2016: R+67.5 2012: R+65.8 2008: R+55.2
Not yet ingested
- Civics
- —
Market trends
- HPI YoY
- ▼ -74.72%
- Current HPI
- 287.155
- Rent YoY
- ▲ 2.31%
- Metro
- Dallas-Fort Worth-Arlington, TX
- State GDP YoY
- ▲ 3.95%
- F500 in state
- 110
Industry mix (Fortune 500 HQ in TX)
| Industry | F500 HQs | Revenue |
|---|---|---|
| Energy | 16 | $1,198B |
|
||
| Technology | 5 | $198B |
|
||
| Engineering / Construction | 4 | $72B |
|
||
| Energy Services | 3 | $60B |
|
||
| Utilities | 3 | $41B |
|
||
| Healthcare | 2 | $330B |
|
||
Price history
+269.6% since first listed6 events — show timeline
- 2026-02-24 Price Changed $254,990 NTREIS
- 2026-02-02 Listing Removed — NTREIS
- 2026-01-30 Listed $259,990 NTREIS
- 2025-10-25 Listed $269,990 NTREIS
- 2025-09-23 Listing Removed — NTREIS
- 2025-05-01 Listed $69,000 NTREIS
Cash-flow waterfall
monthlySold comps — $/sqft
last 12 mo · ≤1 miLoading sold comps…