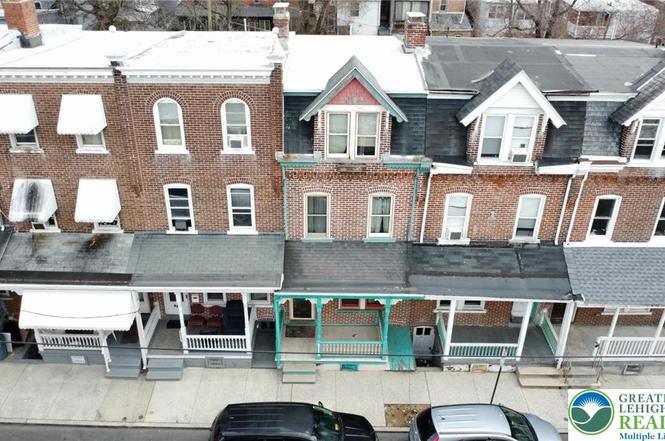
623 Park St · Allentown, PA
Flood risk 1/10 · Minimal
- FEMA flood zone
- X (unshaded)
- Chance of flooding over 30 yrs
- 0.0%
- Est. flood insurance / yr
- $473 – $860
Fire risk 1/10 · Minimal
- Est. fire insurance / yr
- $511 – $949
Heat risk 5/10 · Moderate
- Hot days now (above 100°F)
- 7 days/yr
- Hot days in 30 yrs
- 15 days/yr
Wind risk 4/10 · Minor
- Chance of severe wind over 30 yrs
- 16.0%
Air-quality risk 3/10 · Minor
- Unhealthy air days now
- 3 days/yr
- Unhealthy air days in 30 yrs
- 4 days/yr
Risk factors via First Street. Map © Google.
Why this score? — see what drove the B- grade
The composite is a weighted blend of 9 inputs, each scored 0–100. Each bar is that input's sub-score; the figure is the points it added to the 100-point composite (weight × sub-score).
- Cash flow +25.4/30.0
- ARV discount +15.0/15.0
- DSCR +8.4/10.0
- 1% rule +6.4/10.0
- Livability +4.0/5.0
- Rent growth +3.9/5.0
- Condition / age +2.5/5.0
- Schools +1.2/10.0
- Appreciation +0.0/10.0
$189,900
🖨 Deal sheet 📄 Offer letter ✓ Due diligence
Listing remarks
* * Multiple offers have been submitted. The Seller's attorney is asking for highest and best offers to be submitted by March 17th 1:00PM. * * Lots of space in this solid brick Allentown row. 5 bedrooms all with decent closet space plus two full baths. One full bath on first floor and one full bath on second floor add flexibility. The floor plan has good flow as you enter into a classic front vestibule foyer leading to the living room that is open to the dining room and eat in kitchen. Classic enclosed front foyer. Natural forced air furnace looks recent as well as gas hot water heater. 200 AMP service panel was installed 2021 as per inspection sticker. Full basement with outside entranc
Key facts
- Solid brick
- One car garage
- Full basement
Tags
Neighborhood map
What this means for you Summary
Snapshot
- This is a 5-bed/2.0-bath single-family listed at $190k.
Deal economics
- At list price, monthly cash flow is $438 ($5k/yr) — positive.
- The deal already cash-flows at list — no discount required.
- Meets the 1% rule at list price ($2k rent vs $190k).
- Cap rate 9.1% vs local median 5.3% in Allentown — top-decile yield for the area; either an underpriced asset or a hidden risk that comps aren't pricing in. Stress-test before assuming the spread holds.
Location & tenants
- Location reads 81/100 on livability (#171 in PA, #1,440 nationally) — a professional / high-income tenant draw. Strengths: commute A+, cost of living A+, housing A+; Watch: schools D+, employment D.
- Allentown City SD (urban): math 10% / reading 20% proficiency, ranked #513 of 539 in PA (top 95%) — low school quality limits family demand, transient renter base, plan for 1-2y turnover; 73% free/reduced lunch — lower-income household profile, screen leases tightly.
- Market conditions: Rents rising fast (+5.5%/yr); 167 active listings in the ZIP; 32 comparable units currently listed for rent nearby; rentals at typical pace (median 20d on market — plan ~3-4 weeks tenant-placement turnaround); lower-income renter base — watch delinquency; 765 units permitted in Lehigh County in 2024 (286 in 5+ unit buildings).
- At $2,169/mo this rent would consume 60% of the median local household income ($43k/yr) (locally 4313% of renters already pay >50% of income on rent) — very limited rent-growth headroom before tenants either downsize or default.
Forward outlook
- Local home prices are declining (-3.0%/yr); year-one equity from $1k of loan paydown is wiped out by about $6k of value loss. Plan a longer hold.
- Lehigh County population projected at +21% by 2050 — long-run rental-demand tailwind backs the buy-and-hold thesis.
- At projected returns (-3.0% appreciation + 5.5% rent growth), your $53k cash investment doubles in ~9 years — after that, you're playing with house money.
Negotiation context
- Only 7 days on market — expect competitive offers; lowballing is unlikely to land.
- Current owner paid $44k; list at $190k implies a 332% gain — meaningful room to come down on a strong offer.
Risks & watch-outs
- Watch-outs: built in 1901 — expect roof / HVAC / electrical / plumbing capex.
- Climate carrying-cost: extreme-heat days projected 7→15/yr by 2055 (HVAC capex compounding) — expect insurance premiums to compound above CPI over the hold.
Questions for the listing agent
- Built in 1901 — when were the roof, HVAC, electrical panel, plumbing, and water heater last replaced?
- Is there a deadline driving the sale (1031 exchange, divorce, estate, relocation)? That informs how much negotiation room exists.
- Schools are D-rated, which usually means shorter tenancies and higher turnover. Who's the typical renter profile here, and what's been the actual vacancy rate?
- What's the average days-on-market for RENTAL listings here right now (not sales)? A rising rental-DOM trend means longer vacancies and softer asking-rent achievability than the comps imply.
- What's the recent tenant-quality profile in this submarket — average credit score on applications, eviction rate, late-payment / NSF rate, and stable-employment percentage? A property-management company in the area should have these aggregated.
- How much new for-sale + rental construction is in the pipeline within 1–3 miles? Heavy new supply typically softens prices + rents 12–24 months out; constrained supply supports both.
Investment metrics
- 1% rule
- 1.14% ✓
- Cap rate
- 9.06%
- Cash-on-cash
- 9.88%
- DSCR
- 1.44
- GRM
- 7.3
CMA / ARV
- ARV (on-the-fly)
- $363,168
- Comps found
- 4
Show comp detail 4 sales within ~0.75 mi
| Address | Dist | Beds/Ba | Sqft | Sold | Price | $/sf | Match |
|---|---|---|---|---|---|---|---|
| 1051 N 10th St | 0.63mi | 4/1.5 (-1) | 1,712 (-2%) | 1mo | $385,000 | $225 | 60 |
| 1030 N 10th St | 0.62mi | 4/2.5 (-1) | 1,927 (+10%) | 10mo | $400,000 | $208 | 39 |
| 924 Oak St | 0.52mi | 6/2.5 (+1) | 1,620 (-7%) | 23mo | $228,000 | $141 | 38 |
| 422 N 11th St | 0.55mi | 4/2.5 (-1) | 1,563 (-10%) | 18mo | $270,000 | $173 | 34 |
Match score weights: distance 35% · size 25% · config 20% · recency 20%. Top-matched comps best support the ARV.
Projected returns pro-forma
-3.0% appreciation · 5.48% rent growth · sell at horizon
- IRR
- 1.3%
- Equity multiple
- 1.05×
- Total profit
- $2,659
- Equity at exit
- $28,315
- IRR
- 13.2%
- Equity multiple
- 2.17×
- Total profit
- $62,197
- Equity at exit
- $16,419
Cash invested: $53,172 (down + closing). Projections, not guarantees.
Landlord ↔ Tenant lean methodology
- Overall (STATE)
- 62 Landlord-Friendly
- State Pennsylvania
- 62 Landlord-Friendly · EVEN
- County
- — inherits STATE
- City
- — inherits STATE
ZIP-level market 18102
- Rents YoY
- 5.5%
- Active inventory
- 167
- Price-to-rent
- 7.3×
Monthly cashflow live
- Estimated rent
- $2,169 high interval (Pro) →
- Mortgage (P&I)
- −$996
- Tax from tax record
- −$201 /mo · $2,413/yr
- Insurance
- −$79
- HOA
- −$0
- Vacancy / Maint / Mgmt
- −$456
- Net cashflow
- $438
Break-even live
UW: 25.0% down · 7.5% · 30yr · 1.5% tax · 5.0% vac · 8.0% maint · 8.0% mgmt
Financing live
Cash to close
- Down payment
- $47,475
- Closing costs
- $5,697
- Reserves months
- —
- Total cash needed
- —
Loan-product check · same deal, 3 products live
Conventional
25% down · 7.5% · 30yr
- Down + closing
- —
- Monthly P&I
- —
- Monthly cashflow
- —
- DSCR
- —
- Eligible?
- —
Personal DTI + credit; lowest rate.
DSCR
20% down · 8.5% · 30yr
- Down + closing
- —
- Monthly P&I
- —
- Monthly cashflow
- —
- DSCR
- —
- Eligible?
- —
No personal income docs; deal must DSCR.
Hard money
10% down · 12.0% · 12mo
- Down + closing
- —
- Monthly P&I
- —
- Monthly cashflow
- —
- DSCR
- —
- Eligible?
- —
Short-term bridge; refi at stabilization.
Rent comps 32 comps
| Address | Beds | Baths | Sqft | Rent | $/sqft | DOM | Units | Dist |
|---|---|---|---|---|---|---|---|---|
| 631 W Allen St Allentown, PA | 5.0 | 1.5 | 1695 | $2,100 | $1.24 | 44d | 1 | 0.01mi |
| 622 Park St Allentown, PA | 5.0 | 1.5 | 1638 | $2,300 | $1.40 | 3d | 1 | 0.02mi |
| 535 Tilghman St Unit 2ND Allentown, PA | 4.0 | 2.0 | 1500 | $1,750 | $1.17 | 3d | 1 | 0.14mi |
| 432 N Law St Allentown, PA | 4.0 | 1.0 | 1328 | $1,500 | $1.13 | 14d | 1 | 0.19mi |
| 814 Washington St #2 Allentown, PA | 4.0 | 1.0 | 1200 | $1,600 | $1.33 | 3d | 1 | 0.26mi |
| 738 W Cedar St Allentown, PA | 5.0 | 1.5 | 1900 | $2,500 | $1.32 | 44d | 1 | 0.27mi |
| 823 W Washington St Allentown, PA | 4.0 | 1.0 | 1400 | $1,950 | $1.39 | 14d | 1 | 0.29mi |
| 828 W Gordon St Allentown, PA | 4.0 | 2.5 | 1628 | $2,250 | $1.38 | 3d | 1 | 0.31mi |
| 856 N 8th St Allentown, PA | 5.0 | 1.5 | 1499 | $1,975 | $1.32 | 19d | 1 | 0.34mi |
| 913 N 6th St Allentown, PA | 4.0 | 1.0 | 1476 | $1,698 | $1.15 | 14d | 1 | 0.35mi |
| 626 N 11th St Allentown, PA | 4.0 | 1.5 | 1642 | $2,200 | $1.34 | 3d | 1 | 0.51mi |
| 389 W Turner St Allentown, PA | 4.0 | 1.5 | 2144 | $2,400 | $1.12 | 3d | 1 | 0.55mi |
| 1304 N 4th St Allentown, PA | 5.0 | 2.0 | 1891 | $2,900 | $1.53 | 44d | 1 | 0.57mi |
| 213 Chew St Allentown, PA | 5.0 | 1.0 | 1725 | $2,100 | $1.22 | 44d | 1 | 0.67mi |
| 164 W Tilghman St Allentown, PA | 5.0 | 2.0 | 1801 | $2,250 | $1.25 | 23d | 1 | 0.71mi |
| 948 W Maple St Allentown, PA | 4.0 | 1.0 | 1932 | $2,300 | $1.19 | 44d | 1 | 0.77mi |
| 1338 W Liberty St Allentown, PA | 4.0 | 1.0 | 1526 | $2,000 | $1.31 | 14d | 1 | 0.81mi |
| 208 Ridge Ave Allentown, PA | 4.0 | 1.0 | 1396 | $1,600 | $1.15 | 3d | 1 | 0.82mi |
| 208 Ridge Ave Allentown, PA | 4.0 | 1.0 | 1396 | $1,700 | $1.22 | 23d | 1 | 0.82mi |
| 1348 W Liberty St Allentown, PA | 5.0 | 1.0 | 1561 | $1,900 | $1.22 | 23d | 1 | 0.83mi |
| 630 N Front St Allentown, PA | 4.0 | 1.0 | 1912 | $1,900 | $0.99 | 23d | 1 | 0.84mi |
| 1341 Chew St Allentown, PA | 5.0 | 1.5 | 2139 | $2,500 | $1.17 | 21d | 1 | 0.87mi |
| 111 Ridge Ave Allentown, PA | 4.0 | 1.0 | 1658 | $1,650 | $1.00 | 44d | 1 | 0.89mi |
| 1111 Fullerton Ave Allentown, PA | 5.0 | 1.5 | 1670 | $2,200 | $1.32 | 44d | 1 | 0.94mi |
| 1455 W Tilghman St Allentown, PA | 4.0 | 1.5 | 1520 | $1,850 | $1.22 | 44d | 1 | 0.95mi |
| 36 S Jefferson St Allentown, PA | 5.0 | 1.5 | 2128 | $2,500 | $1.17 | 14d | 1 | 0.97mi |
| 144 S 12th St Allentown, PA | 4.0 | 2.0 | 1242 | $2,000 | $1.61 | 3d | 1 | 1.01mi |
| 1538 Chew St Allentown, PA | 5.0 | 1.0 | 1874 | $2,800 | $1.49 | 19d | 1 | 1.09mi |
| 41 S Franklin St Allentown, PA | 5.0 | 2.0 | 1897 | $2,500 | $1.32 | 14d | 1 | 1.13mi |
| 216 S 14th St Allentown, PA | 4.0 | 1.5 | 1640 | $2,300 | $1.40 | 3d | 1 | 1.20mi |
| 1542 Walnut St Apt 2 Allentown, PA | 4.0 | 1.0 | 1132 | $1,850 | $1.63 | 21d | 1 | 1.29mi |
| 450 Hanover Ave Allentown, PA | 5.0 | 1.0 | 1692 | $2,200 | $1.30 | 23d | 1 | 1.43mi |
Listing history 4 events
-
2026-03-18status Pending
-
2026-03-11$189,900 Active
-
1987-03-20soldstatus $44,000
-
1983-09-30soldstatus $20,000
ⓘ Source: listings_history table (triggers on properties + properties_extension) + one-shot
backfill from property_details.listing_events for pre-trigger history.
Tax reassessment forecast PA · Partial reset (capped growth)
- Current annual tax
- $2,413 · $201/mo
- Projected year-2 tax
- $2,707 · $226/mo
- Expected delta
- +$294/yr (+$24/mo · 12.2%)
ⓘ Screening estimate from a state-policy table — verify with the county assessor before closing.
Climate risk First Street
- Flood 1/10 Low FEMA zone X (unshaded) · 0% chance over 30 yrs
- Wildfire 1/10 Low
- Heat 5/10 Major 7 d/yr ≥100°F today · 15 d/yr by 30 yrs out
- Wind 4/10 Moderate 16% chance of damaging wind over 30 yrs
- Air quality 3/10 Moderate 3 unhealthy d/yr today · 4 by 30 yrs out
Nearby sold comps map
Loading sold comps map…
Walkable amenities ~0.75 mi
Loading nearby amenities…
Taxation est. · year 1
- Rental income
- $26,031
- − Mortgage interest
- −$10,637
- − Property taxes
- −$2,413
- − Insurance
- −$950
- − Repairs & maintenance
- −$2,082
- − Management
- −$2,082
- − Depreciation
- −$5,524
- Taxable income
- $2,342
- Est. tax owed @ 24.0%
- −$562
- After-tax cash flow
- $4,690/yr
For passive investors: Depreciation is non-cash, so a rental often shows a tax loss while cash-flowing — sheltering income. Rental losses are passive: they offset passive income freely, and up to $25,000/yr can offset ordinary (W-2) income if you actively participate and your MAGI is under $100k (phasing out to $0 by $150k); unused losses carry forward. On sale, claimed depreciation is recaptured at up to 25%, and gains may owe capital-gains tax (a 1031 exchange can defer both). Figures are a year-1 estimate at your 24.0% rate — not tax advice; consult a CPA.
Schools (NCES district)
- District
- Allentown City SD
- NCES district ID
- 4202280
- Math proficiency
- 10% ▼ -10.00%
- Reading proficiency
- 20% ▼ -15.00%
- Median HH income
- $36,337
- Composite
- 12.43/100
- National rank
- #9630
- State rank
- #513 of 539 in PA
Livability — Allentown
- Score
- 81/100
- State rank
- #171
- US rank
- #1440
Category grades
Schools grade is shown separately in the Schools card above.
Census & demographics
- Census place
- Allentown, PA
- County
- Lehigh County · 333,019 people
- City population
- 172,996
- Metro
- Allentown-Bethlehem-Easton, PA-NJ
- Population (ZIP)
- 51,001
- Household income
- $43,085
- Rent vs Own
- Severe rent burden
- 4313.0
Population outlook (Lehigh County) Hauer SSP2
- Today (2025)
- 392,957 people
- By 2030
- 408,319 · +3.9%
- By 2040
- 440,007 · +12.0%
- By 2050
- 475,940 · +21.1%
- By 2075
- 590,448 · +50.3%
- By 2100
- 690,314 · +75.7%
Race, ethnicity, and origin ACS 2023
- Neighborhood character
- Predominantly Hispanic (69%)
- Race & ethnicity
- Hispanic / Latino 69% Two or more races 28% White 18% Black 10%
- Hispanic origin (detail)
- Mexican 3% Puerto Rican 38% Dominican 22%
- Common ancestry
- Polish 1% Romanian 1% Hispanic 1%
- Foreign-born
- 22% · Canada, Jamaica
- Languages at home
- 45% English-only · Spanish 52% Arabic 2%
Political lean MEDSL · Lehigh
- 2024 margin
- Toss-up / Even · D 50.7% · R 48.0% · Other 1.2%
- 2008→2024 swing
- -12.9pp toward R · 2008: 15.6pp · 2024: 2.7pp
- All cycles
- 2024: D+2.7 2020: D+7.6 2016: D+4.4 2012: D+7.5 2008: D+15.6
Not yet ingested
- Civics
- —
Market trends
- HPI YoY
- ▼ -227.01%
- Current HPI
- 404.834
- Rent YoY
- ▲ 5.48%
- Metro
- Allentown-Bethlehem-Easton, PA-NJ
- State GDP YoY
- ▲ 1.68%
- F500 in state
- 34
Industry mix (Fortune 500 HQ in PA)
| Industry | F500 HQs | Revenue |
|---|---|---|
| Healthcare | 2 | $309B |
|
||
| Insurance | 2 | $27B |
|
||
| Telecommunications / Media | 1 | $124B |
|
||
| Industrial Distribution | 1 | $22B |
|
||
| Financial Services | 1 | $20B |
|
||
| Chemicals / Materials | 1 | $18B |
|
||
Price history
+849.5% since first listed4 events — show timeline
- 2026-03-18 Pending — GLVRMLS
- 2026-03-11 Listed $189,900 GLVRMLS
- 1987-03-20 Sold (Public Records) $44,000 Public Records
- 1983-09-30 Sold (Public Records) $20,000 Public Records
Property tax history
-2.0%/yrLatest (2026): $2,413 · +0.7% YoY. Source: county tax records.
Cash-flow waterfall
monthlySold comps — $/sqft
last 12 mo · ≤1 miLoading sold comps…