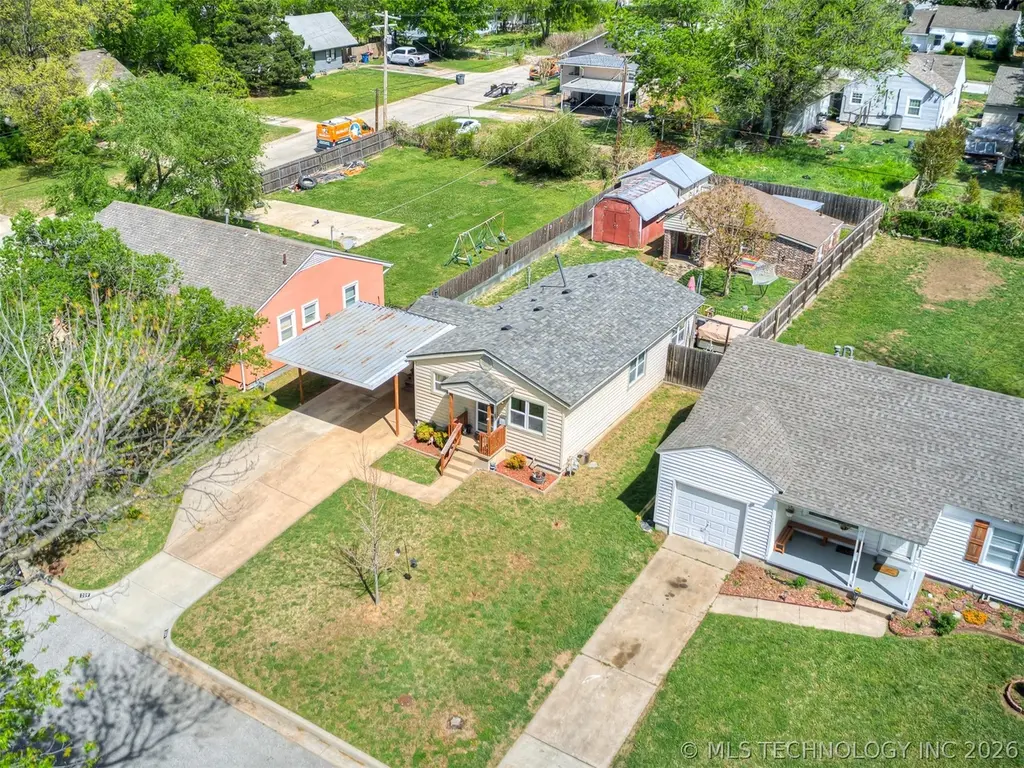
209 S Quebec Ave · Tulsa, OK
Flood risk 1/10 · Minimal
- FEMA flood zone
- X (unshaded)
- Chance of flooding over 30 yrs
- 0.0%
- Est. flood insurance / yr
- $507 – $1,088
Fire risk 1/10 · Minimal
- Est. fire insurance / yr
- $2,463 – $4,575
Heat risk 6/10 · Moderate
- Hot days now (above 110°F)
- 7 days/yr
- Hot days in 30 yrs
- 17 days/yr
Wind risk 2/10 · Minimal
- Chance of severe wind over 30 yrs
- 4.0%
Air-quality risk 3/10 · Minor
- Unhealthy air days now
- 2 days/yr
- Unhealthy air days in 30 yrs
- 3 days/yr
Risk factors via First Street. Map © Google.
Why this score? — see what drove the F grade
The composite is a weighted blend of 9 inputs, each scored 0–100. Each bar is that input's sub-score; the figure is the points it added to the 100-point composite (weight × sub-score).
- Cash flow +14.4/30.0
- DSCR +4.4/10.0
- Livability +3.8/5.0
- Rent growth +3.7/5.0
- 1% rule +3.4/10.0
- Condition / age +2.5/5.0
- Schools +0.8/10.0
- ARV discount +0.0/15.0
- Appreciation +0.0/10.0
$200,000
🖨 Deal sheet 📄 Offer letter ✓ Due diligence
Listing remarks MLS
2 HOUSES FOR THE PRICE OF 1. BOTH ARE VERY NICELY UPDATED & MOVE IN READY. MAIN HOUSE IS 3 BEDS 1 BATH, SMALLER HOUSE IS 1 BED 1 BATH BOTH HAVE INSIDE UTILITY. EXCELLENT RENTAL POSSIBILITY OR LIVE IN ONE AND RENT ONE! LARGE DECK AND 2 HUGE STORAGE SHEDS.
Key facts
- Updated electrical
- New hvac
- Two homes on one lot
Tags
Property features AI
Finance
- HOA & community: Sidewalks; Gutters
Exterior
- Parking: 1-car garage; Carport
- Security: Smoke detector(s); No safety shelter
- Utilities: Electricity available; Natural gas available; Public water; Public sewer; High speed internet available; Fiber optic available
- Home design: Single-story home; Crawlspace foundation
- Construction: Brick and wood frame construction; Asphalt/fiberglass roof; Built according to public records
- Exterior features: Rain gutters; Covered patio/porch, deck, and porch; Shed(s), storage, and workshop; Full fencing; Mature trees; West-facing
Interior
- Kitchen: Dishwasher; Oven; Range; Disposal
- Flooring: Laminate flooring; Tile flooring
- Bathrooms: 2 full bathrooms
- Heating & cooling: Central heating (gas); Central air; Window unit(s)
- Interior features: Aluminum window frames with insulated windows; Storm door(s); Laminate counters, quartz counters, and stone counters; Ceiling fan(s); Gas oven connection
- Laundry & utility: Electric dryer hookup; Electric water heater; Tankless water heater
Neighborhood map
What this means for you Summary
Snapshot
- This is a 4-bed/1.0-bath single-family listed at $200k.
Deal economics
- At list price, monthly cash flow is $40 ($474/yr) — positive.
- The deal already cash-flows at list — no discount required.
- To meet the 1% rule (rent ≥ 1% of price), the offer needs to be $168k (15.9% below list).
- Recommended offer: $168k (15.9% below list) — sets the bar for 1% rule.
- Cap rate 6.5% vs local median 3.9% in Tulsa — top-decile yield for the area; either an underpriced asset or a hidden risk that comps aren't pricing in. Stress-test before assuming the spread holds.
Location & tenants
- Location reads 75/100 on livability (#13 in OK, #4,058 nationally) — a middle-class / working-renter tenant base. Strengths: amenities A+, commute A+, cost of living A+; Watch: schools F, crime F, employment D-.
- Tulsa (urban): math 7% / reading 12% proficiency, ranked #250 of 270 in OK (top 93%) — low school quality limits family demand, transient renter base, plan for 1-2y turnover; 76% free/reduced lunch — lower-income household profile, screen leases tightly.
- Market conditions: Rents rising fast (+4.7%/yr); 116 active listings in the ZIP; 1 comparable units currently listed for rent nearby; 2,818 units permitted in Tulsa County in 2024 (518 in 5+ unit buildings).
- This rent runs 34% of the median local income ($59k/yr) — at the standard rent-burdened threshold; future hikes will face affordability resistance.
Forward outlook
- Local home prices are declining (-3.0%/yr); year-one equity from $1k of loan paydown is wiped out by about $6k of value loss. Plan a longer hold.
- Tulsa County population projected at +30% by 2050 — long-run rental-demand tailwind backs the buy-and-hold thesis.
Negotiation context
- Only 4 days on market — expect competitive offers; lowballing is unlikely to land.
- 5 sale attempts since 27y ago with the ask held roughly flat each time — persistent listings suggest the price (not the market) is what's stuck; bring a comps-based counter.
- Current owner paid $123k; list at $200k implies a 63% gain — meaningful room to come down on a strong offer.
Risks & watch-outs
- Watch-outs: built in 1950 — expect roof / HVAC / electrical / plumbing capex.
- Climate carrying-cost: extreme-heat days projected 7→17/yr by 2055 (HVAC capex compounding) — expect insurance premiums to compound above CPI over the hold.
Questions for the listing agent
- Built in 1950 — when were the roof, HVAC, electrical panel, plumbing, and water heater last replaced?
- Is there a deadline driving the sale (1031 exchange, divorce, estate, relocation)? That informs how much negotiation room exists.
- Schools are F-rated, which usually means shorter tenancies and higher turnover. Who's the typical renter profile here, and what's been the actual vacancy rate?
- Crime grade is F in this area — have there been break-ins, vandalism, or insurance claims at this property in the last 3 years? What carrier currently insures it and at what premium?
- The area grade is low — what's the realistic commute time and amenity access for the typical tenant pool here? Any planned neighborhood developments (good or bad) we should know about?
- What's the average days-on-market for RENTAL listings here right now (not sales)? A rising rental-DOM trend means longer vacancies and softer asking-rent achievability than the comps imply.
- What's the recent tenant-quality profile in this submarket — average credit score on applications, eviction rate, late-payment / NSF rate, and stable-employment percentage? A property-management company in the area should have these aggregated.
- How much new for-sale + rental construction is in the pipeline within 1–3 miles? Heavy new supply typically softens prices + rents 12–24 months out; constrained supply supports both.
Investment metrics
- 1% rule
- 0.84% ✗
- Cap rate
- 6.53%
- Cash-on-cash
- 0.85%
- DSCR
- 1.04
- GRM
- 9.9
CMA / ARV
- ARV (on-the-fly)
- $144,150
- Comps found
- 9
Show comp detail 9 sales within ~0.75 mi
| Address | Dist | Beds/Ba | Sqft | Sold | Price | $/sf | Match |
|---|---|---|---|---|---|---|---|
| 227 S Toledo Ave | 0.20mi | 3/1.0 (-1) | 956 (+3%) | 0mo | $158,000 | $165 | 81 |
| 3911 E Admiral Ct | 0.38mi | 3/2.0 (-1) | 923 (-1%) | 2mo | $175,000 | $190 | 71 |
| 250 S Richmond Ave | 0.10mi | 3/1.5 (-1) | 1,050 (+13%) | 5mo | $84,000 | $80 | 62 |
| 3741 E 2nd St | 0.24mi | 3/1.5 (-1) | 1,048 (+13%) | 3mo | $160,000 | $153 | 58 |
| 508 S Quebec Ave | 0.29mi | 3/1.0 (-1) | 1,025 (+10%) | 14mo | $204,900 | $200 | 53 |
| 923 S New Haven Ave | 0.60mi | 3/1.0 (-1) | 1,003 (+8%) | 6mo | $197,000 | $196 | 49 |
| 3932 E Archer St | 0.38mi | 3/1.0 (-1) | 1,006 (+8%) | 22mo | $130,000 | $129 | 45 |
| 708 N New Haven Ave | 0.56mi | 3/1.0 (-1) | 997 (+7%) | 22mo | $151,000 | $151 | 38 |
| 4640 E Independence St | 0.71mi | 3/1.0 (-1) | 1,064 (+14%) | 14mo | $165,000 | $155 | 26 |
Match score weights: distance 35% · size 25% · config 20% · recency 20%. Top-matched comps best support the ARV.
Projected returns pro-forma
-3.0% appreciation · 4.73% rent growth · sell at horizon
- IRR
- -13.2%
- Equity multiple
- 0.52×
- Total profit
- $-26,946
- Equity at exit
- $29,821
- IRR
- -1.9%
- Equity multiple
- 0.86×
- Total profit
- $-7,696
- Equity at exit
- $17,292
Cash invested: $56,000 (down + closing). Projections, not guarantees.
Landlord ↔ Tenant lean methodology
- Overall (STATE)
- 83 Strongly Landlord-Friendly
- State Oklahoma
- 83 Strongly Landlord-Friendly · R+20
- County
- — inherits STATE
- City
- — inherits STATE
ZIP-level market 74112
- Rents YoY
- 4.7%
- Active inventory
- 116
- Price-to-rent
- 9.9×
Monthly cashflow live
- Estimated rent
- $1,681 medium interval (Pro) →
- Mortgage (P&I)
- −$1,049
- Tax from tax record
- −$157 /mo · $1,879/yr
- Insurance
- −$83
- HOA
- −$0
- Vacancy / Maint / Mgmt
- −$353
- Net cashflow
- $40
Break-even live
UW: 25.0% down · 7.5% · 30yr · 1.5% tax · 5.0% vac · 8.0% maint · 8.0% mgmt
Financing live
Cash to close
- Down payment
- $50,000
- Closing costs
- $6,000
- Reserves months
- —
- Total cash needed
- —
Loan-product check · same deal, 3 products live
Conventional
25% down · 7.5% · 30yr
- Down + closing
- —
- Monthly P&I
- —
- Monthly cashflow
- —
- DSCR
- —
- Eligible?
- —
Personal DTI + credit; lowest rate.
DSCR
20% down · 8.5% · 30yr
- Down + closing
- —
- Monthly P&I
- —
- Monthly cashflow
- —
- DSCR
- —
- Eligible?
- —
No personal income docs; deal must DSCR.
Hard money
10% down · 12.0% · 12mo
- Down + closing
- —
- Monthly P&I
- —
- Monthly cashflow
- —
- DSCR
- —
- Eligible?
- —
Short-term bridge; refi at stabilization.
Rent comps 1 comps
| Address | Beds | Baths | Sqft | Rent | $/sqft | DOM | Units | Dist |
|---|---|---|---|---|---|---|---|---|
| 43 S Toledo Ave Tulsa, OK | 3.0 | 2.0 | 884 | $1,650 | $1.87 | 16d | 1 | 0.21mi |
Listing history 16 events
-
2026-04-13status Pending
-
2026-04-09$200,000 Active
-
2017-09-08soldstatus $123,000
-
2017-09-05soldstatus $123,000 Closed 260-char remark
Show marketing remark (260 chars)
2 HOUSES FOR THE PRICE OF 1. BOTH ARE VERY NICELY UPDATED & MOVE IN READY. MAIN HOUSE IS 3 BEDS 1 BATH, SMALLER HOUSE IS 1 BED 1 BATH BOTH HAVE INSIDE UTILITY. EXCELLENT RENTAL POSSIBILITY OR LIVE IN ONE AND RENT ONE! LARGE DECK AND 2 HUGE STORAGE SHEDS.
-
2017-07-17status Pending 260-char remark
Show marketing remark (260 chars)
2 HOUSES FOR THE PRICE OF 1. BOTH ARE VERY NICELY UPDATED & MOVE IN READY. MAIN HOUSE IS 3 BEDS 1 BATH, SMALLER HOUSE IS 1 BED 1 BATH BOTH HAVE INSIDE UTILITY. EXCELLENT RENTAL POSSIBILITY OR LIVE IN ONE AND RENT ONE! LARGE DECK AND 2 HUGE STORAGE SHEDS.
-
2017-06-20$126,995 Active 260-char remark
Show marketing remark (260 chars)
2 HOUSES FOR THE PRICE OF 1. BOTH ARE VERY NICELY UPDATED & MOVE IN READY. MAIN HOUSE IS 3 BEDS 1 BATH, SMALLER HOUSE IS 1 BED 1 BATH BOTH HAVE INSIDE UTILITY. EXCELLENT RENTAL POSSIBILITY OR LIVE IN ONE AND RENT ONE! LARGE DECK AND 2 HUGE STORAGE SHEDS.
-
2003-03-21soldstatus $69,500
-
2003-03-12soldstatus $69,500 247-char remark
Show marketing remark (247 chars)
PRISTINE, MOVE-IN READY. MUST SEE! DESIGNER COLORS. NEWER: PAINT, TILE, CARPET, H & A, APPLIANCES, EXT. DOORS (INCLUDING FRENCH FROM MASTER), GREAT DECK. LARGE UTILITY ROOM. 2ND HOUSE ON PROPERTY USED AS SHOP. COULD BE MOTHER-IN-LAW OR RENTAL.
-
2003-02-10historical 247-char remark
Show marketing remark (247 chars)
PRISTINE, MOVE-IN READY. MUST SEE! DESIGNER COLORS. NEWER: PAINT, TILE, CARPET, H & A, APPLIANCES, EXT. DOORS (INCLUDING FRENCH FROM MASTER), GREAT DECK. LARGE UTILITY ROOM. 2ND HOUSE ON PROPERTY USED AS SHOP. COULD BE MOTHER-IN-LAW OR RENTAL.
-
2002-12-31$69,900 247-char remark
Show marketing remark (247 chars)
PRISTINE, MOVE-IN READY. MUST SEE! DESIGNER COLORS. NEWER: PAINT, TILE, CARPET, H & A, APPLIANCES, EXT. DOORS (INCLUDING FRENCH FROM MASTER), GREAT DECK. LARGE UTILITY ROOM. 2ND HOUSE ON PROPERTY USED AS SHOP. COULD BE MOTHER-IN-LAW OR RENTAL.
-
2002-12-13historical
-
2002-10-07$69,900
-
1999-08-25soldstatus $45,000
-
1999-08-08historical
-
1999-06-08$49,900
-
1999-01-29soldstatus $30,000
ⓘ Source: listings_history table (triggers on properties + properties_extension) + one-shot
backfill from property_details.listing_events for pre-trigger history.
Tax reassessment forecast OK · Resets to sale price
- Current annual tax
- $1,879 · $157/mo
- Projected year-2 tax
- $1,879 · $157/mo
- Expected delta
- $0/yr ($0/mo · 0.0%)
ⓘ Screening estimate from a state-policy table — verify with the county assessor before closing.
Climate risk First Street
- Flood 1/10 Low FEMA zone X (unshaded) · 0% chance over 30 yrs
- Wildfire 1/10 Low
- Heat 6/10 Major 7 d/yr ≥110°F today · 17 d/yr by 30 yrs out
- Wind 2/10 Low 4% chance of damaging wind over 30 yrs
- Air quality 3/10 Moderate 2 unhealthy d/yr today · 3 by 30 yrs out
Nearby sold comps map
Loading sold comps map…
Walkable amenities ~0.75 mi
Loading nearby amenities…
Taxation est. · year 1
- Rental income
- $20,176
- − Mortgage interest
- −$11,203
- − Property taxes
- −$1,879
- − Insurance
- −$1,000
- − Repairs & maintenance
- −$1,614
- − Management
- −$1,614
- − Depreciation
- −$5,818
- Taxable loss
- −$2,952
- Est. tax savings @ 24.0%
- +$709
- After-tax cash flow
- $1,183/yr
For passive investors: Depreciation is non-cash, so a rental often shows a tax loss while cash-flowing — sheltering income. Rental losses are passive: they offset passive income freely, and up to $25,000/yr can offset ordinary (W-2) income if you actively participate and your MAGI is under $100k (phasing out to $0 by $150k); unused losses carry forward. On sale, claimed depreciation is recaptured at up to 25%, and gains may owe capital-gains tax (a 1031 exchange can defer both). Figures are a year-1 estimate at your 24.0% rate — not tax advice; consult a CPA.
Schools (NCES district)
- District
- Tulsa
- NCES district ID
- 4030240
- Math proficiency
- 7% ▼ -9.00%
- Reading proficiency
- 12% ▼ -7.00%
- Median HH income
- $37,895
- Composite
- 8.04/100
- National rank
- #9919
- State rank
- #250 of 270 in OK
Livability — Tulsa
- Score
- 75/100
- State rank
- #13
- US rank
- #4058
Category grades
Schools grade is shown separately in the Schools card above.
Census & demographics
- Census place
- Tulsa, OK
- County
- Tulsa County · 640,811 people
- City population
- 389,418
- Metro
- Tulsa, OK
- Population (ZIP)
- 21,386
- Household income
- $58,951
- Rent vs Own
- Severe rent burden
- 755.0
Population outlook (Tulsa County) Hauer SSP2
- Today (2025)
- 723,846 people
- By 2030
- 766,033 · +5.8%
- By 2040
- 851,386 · +17.6%
- By 2050
- 938,389 · +29.6%
- By 2075
- 1,166,011 · +61.1%
- By 2100
- 1,350,277 · +86.5%
Race, ethnicity, and origin ACS 2023
- Neighborhood character
- Diverse neighborhood (Simpson 0.64)
- Race & ethnicity
- White 56% Hispanic / Latino 20% Two or more races 16% Black 9% Native American 6% Asian 1%
- Hispanic origin (detail)
- Mexican 14% Puerto Rican 1%
- Common ancestry
- Slovak 2% Lithuanian 2% Italian 1%
- Foreign-born
- 9% · Canada
- Languages at home
- 82% English-only · Spanish 15% Other Asian/Pacific 1%
Political lean MEDSL · Tulsa
- 2024 margin
- R (+15.2) · D 41.3% · R 56.5% · Other 2.2%
- 2008→2024 swing
- +9.2pp toward D · 2008: -24.5pp · 2024: -15.2pp
- All cycles
- 2024: R+15.2 2020: R+15.6 2016: R+22.9 2012: R+27.4 2008: R+24.5
Not yet ingested
- Civics
- —
Market trends
- HPI YoY
- ▼ -207.46%
- Current HPI
- 271.3292
- Rent YoY
- ▲ 4.73%
- Metro
- Tulsa, OK
- State GDP YoY
- ▲ 1.55%
- F500 in state
- 6
Industry mix (Fortune 500 HQ in OK)
| Industry | F500 HQs | Revenue |
|---|---|---|
| Energy | 3 | $48B |
|
||
Price history
+566.7% since first listed16 events — show timeline
- 2026-04-13 Pending — MLS Technology, Inc.
- 2026-04-09 Listed $200,000 MLS Technology, Inc.
- 2017-09-08 Sold (Public Records) $123,000 Public Records
- 2017-09-05 Sold (MLS) $123,000 MLS Technology, Inc.
- 2017-07-17 Pending — MLS Technology, Inc.
- 2017-06-20 Listed $126,995 MLS Technology, Inc.
- 2003-03-21 Sold (Public Records) $69,500 Public Records
- 2003-03-12 Sold (MLS) $69,500 MLS Technology, Inc.
- 2003-02-10 Listing Removed — MLS Technology, Inc.
- 2002-12-31 Listed $69,900 MLS Technology, Inc.
- 2002-12-13 Listing Removed — MLS Technology, Inc.
- 2002-10-07 Listed $69,900 MLS Technology, Inc.
- 1999-08-25 Sold (MLS) $45,000 MLS Technology, Inc.
- 1999-08-08 Listing Removed — MLS Technology, Inc.
- 1999-06-08 Listed $49,900 MLS Technology, Inc.
- 1999-01-29 Sold (Public Records) $30,000 Public Records
Property tax history
+6.6%/yrLatest (2025): $1,879 · -0.5% YoY. Source: county tax records.
Cash-flow waterfall
monthlySold comps — $/sqft
last 12 mo · ≤1 miLoading sold comps…