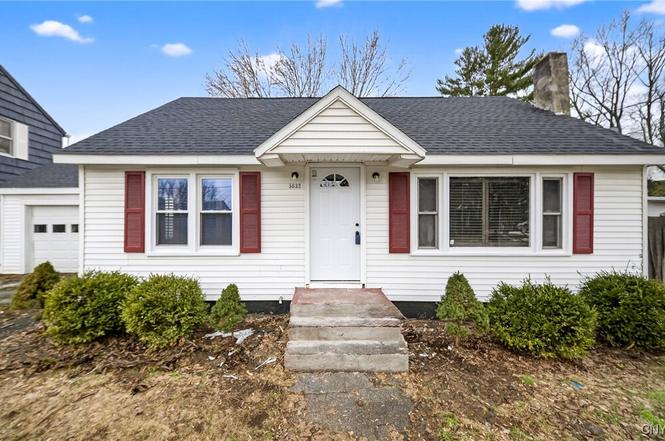
5632 W Circle Dr · North Syracuse, NY
Flood risk 1/10 · Minimal
- FEMA flood zone
- X (unshaded)
- Chance of flooding over 30 yrs
- 0.0%
- Est. flood insurance / yr
- $473 – $860
Fire risk 1/10 · Minimal
- Est. fire insurance / yr
- $691 – $1,283
Heat risk 3/10 · Minor
- Hot days now (above 95°F)
- 7 days/yr
- Hot days in 30 yrs
- 16 days/yr
Wind risk 1/10 · Minimal
- Chance of severe wind over 30 yrs
- 0.0%
Air-quality risk 2/10 · Minimal
- Unhealthy air days now
- 0 days/yr
- Unhealthy air days in 30 yrs
- 1 days/yr
Risk factors via First Street. Map © Google.
Why this score? — see what drove the F grade
The composite is a weighted blend of 9 inputs, each scored 0–100. Each bar is that input's sub-score; the figure is the points it added to the 100-point composite (weight × sub-score).
- Cash flow +8.2/30.0
- Schools +4.2/10.0
- Livability +3.6/5.0
- 1% rule +3.0/10.0
- Rent growth +2.5/5.0
- Condition / age +2.5/5.0
- DSCR +2.2/10.0
- ARV discount +0.0/15.0
- Appreciation +0.0/10.0
$234,900
🖨 Deal sheet (PDF) 📄 Offer letter ✓ Due diligence
Listing remarks
Welcome to this completely updated Cape Cod–style home, perfectly located near shopping, public transportation, and with easy freeway access—yet tucked away on a quiet dead-end street reserved for residents only. This move-in-ready gem features a brand-new roof, windows, doors, flooring, and fresh paint throughout. The remodeled kitchen shines with new cabinets, a breakfast bar, and new appliances, including a refrigerator and standing gas stove, plus a new thermostat for year-round comfort. Offering 4 bedrooms and 1 full bath, the home also includes a full basement with a new sump pump and convenient access from the attached garage, complete with a new garage door opener. Enjoy
Key facts
- Remodeled kitchen
- Brand-new roof
- New cabinets
Tags
Neighborhood map
What this means for you Summary
Snapshot
- This is a 3-bed/1.0-bath single-family listed at $235k.
Deal economics
- At list price, monthly cash flow is $-223 ($-3k/yr) — negative.
- To cash-flow at today's rent, offer at most $195k (16.8% below list).
- To meet the 1% rule (rent ≥ 1% of price), the offer needs to be $187k (20.2% below list).
- Recommended offer: $187k (20.2% below list) — sets the bar for 1% rule.
Location & tenants
- Location reads 72/100 on livability (#379 in NY) — a middle-class / working-renter tenant base. Strengths: housing A+, health & safety A+, cost of living A; Watch: schools C-, crime D, amenities F.
- North Syracuse Central School District (suburban): math 45% / reading 50% proficiency, ranked #402 of 590 in NY (top 68%) — families likely to look elsewhere, expect single-tenant / working-renter base with shorter leases.
- Market conditions: 87 active listings in the ZIP; 3 comparable units currently listed for rent nearby; rentals at typical pace (median 23d on market — plan ~3-4 weeks tenant-placement turnaround); 616 units permitted in Onondaga County in 2024 (256 in 5+ unit buildings).
Forward outlook
- Local home prices are declining (-3.0%/yr); year-one equity from $2k of loan paydown is wiped out by about $7k of value loss. Plan a longer hold.
- Onondaga County population projected to shrink 9% by 2050 — rents likely to lag national; underwrite the cash flow, not the appreciation.
Negotiation context
- It's been on market 118 days — a 9% lower offer ($214k) is reasonable based on typical stale-listing flexibility.
- 2 sale attempts since 2y ago with the ask held roughly flat each time — persistent listings suggest the price (not the market) is what's stuck; bring a comps-based counter.
Risks & watch-outs
- Watch-outs: built in 1950 — expect roof / HVAC / electrical / plumbing capex.
Questions for the listing agent
- What do current leases actually rent for vs. the listed asking? Can we see a recent rent roll and the last 12 months of T-12 income?
- It's been on market 118 days. Have you received any prior offers? Is the seller open to a 20% concession, seller financing, or rate buy-down credit?
- Built in 1950 — when were the roof, HVAC, electrical panel, plumbing, and water heater last replaced?
- Why hasn't it sold? Are there any deal-killer items the seller is aware of (foundation, flood, title, zoning, code violations)?
- Is there a deadline driving the sale (1031 exchange, divorce, estate, relocation)? That informs how much negotiation room exists.
- Crime grade is D in this area — have there been break-ins, vandalism, or insurance claims at this property in the last 3 years? What carrier currently insures it and at what premium?
- The area grade is low — what's the realistic commute time and amenity access for the typical tenant pool here? Any planned neighborhood developments (good or bad) we should know about?
- What's the average days-on-market for RENTAL listings here right now (not sales)? A rising rental-DOM trend means longer vacancies and softer asking-rent achievability than the comps imply.
- What's the recent tenant-quality profile in this submarket — average credit score on applications, eviction rate, late-payment / NSF rate, and stable-employment percentage? A property-management company in the area should have these aggregated.
- How much new for-sale + rental construction is in the pipeline within 1–3 miles? Heavy new supply typically softens prices + rents 12–24 months out; constrained supply supports both.
Investment metrics
- 1% rule
- 0.80% ✗
- Cap rate
- 5.15%
- Cash-on-cash
- -4.08%
- DSCR
- 0.82
- GRM
- 10.4
CMA / ARV
- ARV (on-the-fly)
- $198,720
- Comps found
- 9
Show comp detail 9 sales within ~0.75 mi
| Address | Dist | Beds/Ba | Sqft | Sold | Price | $/sf | Match |
|---|---|---|---|---|---|---|---|
| 5632 W Circle Dr | 0.00mi | 4/1.0 (+1) | 1,104 (0%) | 1mo | $234,900 | $213 | 94 |
| 128 Northfield Dr | 0.68mi | 3/1.0 | 1,104 (0%) | 1mo | $206,500 | $187 | 68 |
| 105 Kopp Ave | 0.26mi | 3/1.5 | 1,099 (-0%) | 23mo | $150,000 | $136 | 66 |
| 104 Lynhurst Ave | 0.72mi | 3/1.5 | 1,128 (+2%) | 8mo | $161,700 | $143 | 55 |
| 5627 Bear Rd | 0.31mi | 3/2.0 | 1,267 (+15%) | 8mo | $227,900 | $180 | 50 |
| 151 Maxwell Ave | 0.70mi | 2/1.0 (-1) | 1,107 (+0%) | 17mo | $142,000 | $128 | 47 |
| 5470 Bear Rd | 0.74mi | 3/1.0 | 1,008 (-9%) | 23mo | $215,000 | $213 | 32 |
| 5552 Bear Rd | 0.51mi | 2/1.5 (-1) | 1,260 (+14%) | 20mo | $215,000 | $171 | 30 |
| 5835 Tuller Rd | 0.71mi | 2/1.5 (-1) | 988 (-10%) | 22mo | $217,000 | $220 | 24 |
Match score weights: distance 35% · size 25% · config 20% · recency 20%. Top-matched comps best support the ARV.
Projected returns pro-forma
-3.0% appreciation · 3.0% rent growth · sell at horizon
- IRR
- -23.1%
- Equity multiple
- 0.21×
- Total profit
- $-52,213
- Equity at exit
- $35,024
- IRR
- -17.6%
- Equity multiple
- 0.03×
- Total profit
- $-63,471
- Equity at exit
- $20,310
Cash invested: $65,772 (down + closing). Projections, not guarantees.
Landlord ↔ Tenant lean methodology
- Overall (STATE)
- 15 Strongly Tenant-Friendly
- State New York
- 15 Strongly Tenant-Friendly · D+10
- County
- — inherits STATE
- City
- — inherits STATE
ZIP-level market 13039
- Home prices YoY
- -28.9%
- Active inventory
- 87
- Price-to-rent
- 10.4×
Monthly cashflow live
- Estimated rent
- $1,874 medium interval (Pro) →
- Mortgage (P&I)
- −$1,232
- Tax from tax record
- −$374 /mo · $4,487/yr
- Insurance
- −$98
- HOA
- −$0
- Vacancy / Maint / Mgmt
- −$393
- Net cashflow
- $-223
Break-even live
Sensitivity live
| Price | -10% $-90 | -5% $-157 | +0% $-223 | +5% $-290 | +10% $-356 |
|---|---|---|---|---|---|
| Rent | -10% $-371 | -5% $-297 | +0% $-223 | +5% $-149 | +10% $-75 |
| Rate | -1.0pp $-105 | -0.5pp $-164 | base $-223 | +0.5pp $-284 | +1.0pp $-346 |
UW: 25.0% down · 7.5% · 30yr · 1.5% tax · 5.0% vac · 8.0% maint · 8.0% mgmt
Financing live
Cash to close
- Down payment
- $58,725
- Closing costs
- $7,047
- Reserves months
- —
- Total cash needed
- —
Loan-product check · same deal, 3 products live
Conventional
25% down · 7.5% · 30yr
- Down + closing
- —
- Monthly P&I
- —
- Monthly cashflow
- —
- DSCR
- —
- Eligible?
- —
Personal DTI + credit; lowest rate.
DSCR
20% down · 8.5% · 30yr
- Down + closing
- —
- Monthly P&I
- —
- Monthly cashflow
- —
- DSCR
- —
- Eligible?
- —
No personal income docs; deal must DSCR.
Hard money
10% down · 12.0% · 12mo
- Down + closing
- —
- Monthly P&I
- —
- Monthly cashflow
- —
- DSCR
- —
- Eligible?
- —
Short-term bridge; refi at stabilization.
Rent comps 3 comps
| Address | Beds | Baths | Sqft | Rent | $/sqft | DOM | Units | Dist |
|---|---|---|---|---|---|---|---|---|
| 5548 Bear Rd Syracuse, NY | 2.0 | 1.0–1.5 | 1100 | $1,560 | $1.42 | 15d | 2 | 0.56mi |
| 8091 Weblank Way Clay, NY | 3.0 | 1.5 | 1150 | $2,200 | $1.91 | 23d | 1 | 1.08mi |
| 107 Stephen Pl Syracuse, NY | 2.0 | 1.0 | 1199 | $2,250 | $1.88 | 45d | 1 | 1.31mi |
Listing history 6 events
-
2026-05-14status Pending
-
2026-04-01historical Active Under Contract
-
2026-01-15$234,900 Active
-
2024-04-03status Pending
-
2024-04-03historical
-
2024-03-30$140,000 Active
ⓘ Source: listings_history table (triggers on properties + properties_extension) + one-shot
backfill from property_details.listing_events for pre-trigger history.
Tax reassessment forecast NY · Partial reset (capped growth)
- Current annual tax
- $4,487 · $374/mo
- Projected year-2 tax
- $4,487 · $374/mo
- Expected delta
- $0/yr ($0/mo · 0.0%)
ⓘ Screening estimate from a state-policy table — verify with the county assessor before closing.
Climate risk First Street
- Flood 1/10 Low FEMA zone X (unshaded) · 0% chance over 30 yrs
- Wildfire 1/10 Low
- Heat 3/10 Moderate 7 d/yr ≥95°F today · 16 d/yr by 30 yrs out
- Wind 1/10 Low 0% chance of damaging wind over 30 yrs
- Air quality 2/10 Low 0 unhealthy d/yr today · 1 by 30 yrs out
Nearby sold comps map
Loading sold comps map…
Walkable amenities ~0.75 mi
Loading nearby amenities…
Taxation est. · year 1
- Rental income
- $22,485
- − Mortgage interest
- −$13,158
- − Property taxes
- −$4,487
- − Insurance
- −$1,174
- − Repairs & maintenance
- −$1,799
- − Management
- −$1,799
- − Depreciation
- −$6,833
- Taxable loss
- −$6,766
- Est. tax savings @ 24.0%
- +$1,624
- After-tax cash flow
- $-1,057/yr
For passive investors: Depreciation is non-cash, so a rental often shows a tax loss while cash-flowing — sheltering income. Rental losses are passive: they offset passive income freely, and up to $25,000/yr can offset ordinary (W-2) income if you actively participate and your MAGI is under $100k (phasing out to $0 by $150k); unused losses carry forward. On sale, claimed depreciation is recaptured at up to 25%, and gains may owe capital-gains tax (a 1031 exchange can defer both). Figures are a year-1 estimate at your 24.0% rate — not tax advice; consult a CPA.
Schools (NCES district)
- District
- North Syracuse Central School District
- NCES district ID
- 3621210
- Math proficiency
- 45% ▼ -9.00%
- Reading proficiency
- 50% ▲ 1.00%
- Median HH income
- $62,904
- Composite
- 41.93/100
- National rank
- #3356
- State rank
- #402 of 590 in NY
Livability — North Syracuse
- Score
- 72/100
- State rank
- #379
- US rank
- #6513
Category grades
Schools grade is shown separately in the Schools card above.
Census & demographics
- City population
- 20,185
- Population (ZIP)
- 17,184
Population outlook (Onondaga County) Hauer SSP2
- Today (2025)
- 467,894 people
- By 2030
- 463,381 · -1.0%
- By 2040
- 447,697 · -4.3%
- By 2050
- 426,399 · -8.9%
- By 2075
- 373,661 · -20.1%
- By 2100
- 307,967 · -34.2%
Race, ethnicity, and origin ACS 2023
- Neighborhood character
- Predominantly White (93%)
- Race & ethnicity
- White 93% Asian 3% Two or more races 2% Black 2%
- Common ancestry
- Romanian 10% Lithuanian 3% Slovak 2%
- Foreign-born
- 4% · China, Canada, Mexico
- Languages at home
- 95% English-only · Spanish 1% Other Indo-European 1% Chinese 1%
Political lean MEDSL · Onondaga
- 2024 margin
- D (+17.3) · D 58.6% · R 41.4%
- 2008→2024 swing
- -3.0pp toward R · 2008: 20.3pp · 2024: 17.3pp
- All cycles
- 2024: D+17.3 2020: D+20.6 2016: D+12.8 2012: D+21.1 2008: D+20.3
Not yet ingested
- Civics
- —
Market trends
- HPI YoY
- ▼ -127.98%
- Current HPI
- 314.7902
- Rent YoY
- —
- Metro
- —
- State GDP YoY
- ▲ 2.60%
- F500 in state
- 92
Industry mix (Fortune 500 HQ in NY)
| Industry | F500 HQs | Revenue |
|---|---|---|
| Financial Services | 10 | $950B |
|
||
| Consumer Goods | 9 | $162B |
|
||
| Insurance | 4 | $225B |
|
||
| Telecommunications | 2 | $144B |
|
||
| Pharmaceuticals | 2 | $112B |
|
||
| Media / Entertainment | 2 | $69B |
|
||
Price history
+67.8% since first listed6 events — show timeline
- 2026-05-14 Pending — CNYIS
- 2026-04-01 Contingent — CNYIS
- 2026-01-15 Listed $234,900 CNYIS
- 2024-04-03 Pending — CNYIS
- 2024-04-03 Listing Removed — CNYIS
- 2024-03-30 Listed $140,000 CNYIS
Property tax history
+8.2%/yrLatest (2025): $4,487 · +2.8% YoY. Source: county tax records.
Cash-flow waterfall
monthlySold comps — $/sqft
last 12 mo · ≤1 miLoading sold comps…