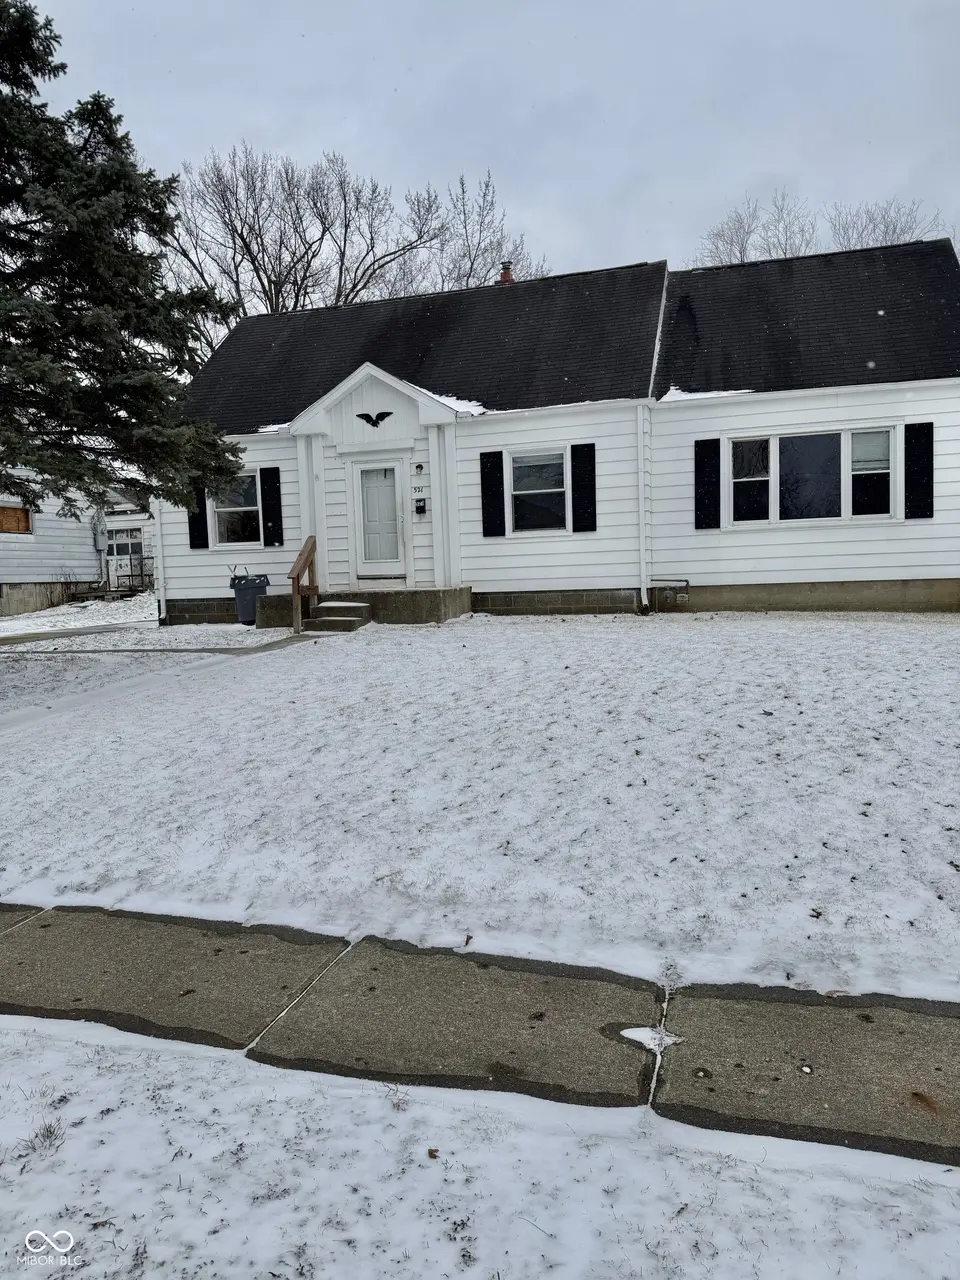
521 W 37th St · Anderson, IN
Flood risk 1/10 · Minimal
- FEMA flood zone
- X (unshaded)
- Chance of flooding over 30 yrs
- 0.0%
- Est. flood insurance / yr
- $473 – $860
Fire risk 1/10 · Minimal
- Est. fire insurance / yr
- $717 – $1,331
Heat risk 3/10 · Minor
- Hot days now (above 100°F)
- 7 days/yr
- Hot days in 30 yrs
- 18 days/yr
Wind risk 2/10 · Minimal
- Chance of severe wind over 30 yrs
- 0.0%
Air-quality risk 3/10 · Minor
- Unhealthy air days now
- 2 days/yr
- Unhealthy air days in 30 yrs
- 3 days/yr
Risk factors via First Street. Map © Google.
Why this score? — see what drove the C- grade
The composite is a weighted blend of 9 inputs, each scored 0–100. Each bar is that input's sub-score; the figure is the points it added to the 100-point composite (weight × sub-score).
- Cash flow +19.4/30.0
- ARV discount +13.0/15.0
- DSCR +6.1/10.0
- 1% rule +5.2/10.0
- Livability +3.0/5.0
- Rent growth +2.5/5.0
- Condition / age +2.2/5.0
- Schools +1.6/10.0
- Appreciation +0.0/10.0
$140,000
🖨 Deal sheet 📄 Offer letter ✓ Due diligence
Listing remarks MLS
Southside Investment Opportunity You Don't Want to Miss! If you've been waiting for the right property to add to your portfolio - this is it. This spacious home offers over 2,000 square feet of living space with 4 bedrooms and room to maximize value. Whether you're looking for your next rental, flip, or long-term hold, the potential here is undeniable. Over 2,000 sq ft, 4 generous bedrooms, Laminate flooring throughout, Large lot with room to grow, Basement with plenty of storage and a Solid space! Strong potential. Prime Southside location. Opportunities like this don't last long - especially with this much square footage at this price point. Message me for details or to schedule a private showing. Let's make your next investment move a smart one!
Key facts
- Laminate flooring
- Large lot
- 0.26 acre lot
Tags
Neighborhood map
What this means for you Summary
Snapshot
- This is a 4-bed/1.0-bath single-family listed at $140k. Condition is rated fair.
Deal economics
- At list price, monthly cash flow is $157 ($2k/yr) — positive.
- The deal already cash-flows at list — no discount required.
- Meets the 1% rule at list price ($1k rent vs $140k).
- Recommended offer: $127k (9.0% below list) — sets the bar for market timing.
Location & tenants
- Location reads 60/100 on livability (#521 in IN) — a middle-class / working-renter tenant base. Strengths: cost of living A+, housing A+; Watch: schools F, crime D-, amenities F.
- Anderson Community School Corporation (urban): math 15% / reading 23% proficiency, ranked #280 of 301 in IN (top 93%) — low school quality limits family demand, transient renter base, plan for 1-2y turnover; 70% free/reduced lunch — lower-income household profile, screen leases tightly.
- Market conditions: 150 active listings in the ZIP; 1 comparable units currently listed for rent nearby; 184 units permitted in Madison County in 2024 (0 in 5+ unit buildings).
- This rent runs 35% of the median local income ($49k/yr) — at the standard rent-burdened threshold; future hikes will face affordability resistance.
Forward outlook
- Local home prices are declining (-3.0%/yr); year-one equity from $968 of loan paydown is wiped out by about $4k of value loss. Plan a longer hold.
- Madison County population projected at -14% by 2050 — secular population decline; favor cash flow + early exit over multi-decade hold.
Negotiation context
- It's been on market 107 days — a 9% lower offer ($127k) is reasonable based on typical stale-listing flexibility.
Risks & watch-outs
- Watch-outs: built in 1944 — expect roof / HVAC / electrical / plumbing capex.
Questions for the listing agent
- It's been on market 107 days. Have you received any prior offers? Is the seller open to a 9% concession, seller financing, or rate buy-down credit?
- Have any recent inspections been done? Can we get a copy of the seller's disclosures and any deferred-maintenance estimates?
- Built in 1944 — when were the roof, HVAC, electrical panel, plumbing, and water heater last replaced?
- Why hasn't it sold? Are there any deal-killer items the seller is aware of (foundation, flood, title, zoning, code violations)?
- Is there a deadline driving the sale (1031 exchange, divorce, estate, relocation)? That informs how much negotiation room exists.
- Schools are F-rated, which usually means shorter tenancies and higher turnover. Who's the typical renter profile here, and what's been the actual vacancy rate?
- Crime grade is D in this area — have there been break-ins, vandalism, or insurance claims at this property in the last 3 years? What carrier currently insures it and at what premium?
- What's the average days-on-market for RENTAL listings here right now (not sales)? A rising rental-DOM trend means longer vacancies and softer asking-rent achievability than the comps imply.
- What's the recent tenant-quality profile in this submarket — average credit score on applications, eviction rate, late-payment / NSF rate, and stable-employment percentage? A property-management company in the area should have these aggregated.
- How much new for-sale + rental construction is in the pipeline within 1–3 miles? Heavy new supply typically softens prices + rents 12–24 months out; constrained supply supports both.
Investment metrics
- 1% rule
- 1.02% ✓
- Cap rate
- 7.64%
- Cash-on-cash
- 4.80%
- DSCR
- 1.21
- GRM
- 8.2
CMA / ARV
- ARV (median comp)
- $159,335
- List price
- $140,000
- Delta
- -12.13%
- Verdict
- UNDERPRICED
- Comps
- 20 within 1.0 mi
Show comp detail 2 sales within ~0.75 mi
| Address | Dist | Beds/Ba | Sqft | Sold | Price | $/sf | Match |
|---|---|---|---|---|---|---|---|
| 139 E 36th St | 0.68mi | 3/1.5 (-1) | 2,919 (-15%) | 9mo | $155,100 | $53 | 29 |
| 1116 Sandra Dr | 0.74mi | 3/2.5 (-1) | 3,822 (+12%) | 7mo | $220,000 | $58 | 29 |
Match score weights: distance 35% · size 25% · config 20% · recency 20%. Top-matched comps best support the ARV.
Projected returns pro-forma
-3.0% appreciation · 3.0% rent growth · sell at horizon
- IRR
- -8.8%
- Equity multiple
- 0.68×
- Total profit
- $-12,685
- Equity at exit
- $20,874
- IRR
- 0.7%
- Equity multiple
- 1.05×
- Total profit
- $1,892
- Equity at exit
- $12,105
Cash invested: $39,200 (down + closing). Projections, not guarantees.
Landlord ↔ Tenant lean methodology
- Overall (STATE)
- 90 Strongly Landlord-Friendly
- State Indiana
- 90 Strongly Landlord-Friendly · R+11
- County
- — inherits STATE
- City
- — inherits STATE
ZIP-level market 46013
- Home prices YoY
- -26.9%
- Active inventory
- 150
- Price-to-rent
- 8.2×
Monthly cashflow live
- Estimated rent
- $1,423 medium interval (Pro) →
- Mortgage (P&I)
- −$734
- Tax est. 1.5%
- −$175 /mo · $2,100/yr
- Insurance
- −$58
- HOA
- −$0
- Vacancy / Maint / Mgmt
- −$299
- Net cashflow
- $157
Break-even live
UW: 25.0% down · 7.5% · 30yr · 1.5% tax · 5.0% vac · 8.0% maint · 8.0% mgmt
Financing live
Cash to close
- Down payment
- $35,000
- Closing costs
- $4,200
- Reserves months
- —
- Total cash needed
- —
Loan-product check · same deal, 3 products live
Conventional
25% down · 7.5% · 30yr
- Down + closing
- —
- Monthly P&I
- —
- Monthly cashflow
- —
- DSCR
- —
- Eligible?
- —
Personal DTI + credit; lowest rate.
DSCR
20% down · 8.5% · 30yr
- Down + closing
- —
- Monthly P&I
- —
- Monthly cashflow
- —
- DSCR
- —
- Eligible?
- —
No personal income docs; deal must DSCR.
Hard money
10% down · 12.0% · 12mo
- Down + closing
- —
- Monthly P&I
- —
- Monthly cashflow
- —
- DSCR
- —
- Eligible?
- —
Short-term bridge; refi at stabilization.
Rent comps 1 comps
| Address | Beds | Baths | Sqft | Rent | $/sqft | DOM | Units | Dist |
|---|---|---|---|---|---|---|---|---|
| 2626 Main St Anderson, IN | 3.0 | 2.0 | 3366 | $1,200 | $0.36 | 23d | 1 | 1.05mi |
Listing history 15 events
-
2026-06-18days on market $140,000 Active 107 DOM
-
2026-06-17days on market $140,000 Active 106 DOM
-
2026-06-16days on market $140,000 Active 105 DOM
-
2026-06-15days on market $140,000 Active 104 DOM
-
2026-06-13days on market $140,000 Active 102 DOM
-
2026-06-09days on market $140,000 Active 98 DOM
-
2026-06-08days on market $140,000 Active 97 DOM
-
2026-06-07days on market $140,000 Active 96 DOM
-
2026-06-05days on market $140,000 Active 93 DOM
-
2026-06-03days on market $140,000 Active 92 DOM
-
2026-06-02days on market $140,000 Active 91 DOM
-
2026-06-01days on market $140,000 Active 90 DOM
-
2026-05-31days on market $140,000 Active 89 DOM
-
2026-03-24price $140,000 758-char remark
Show marketing remark (758 chars)
Southside Investment Opportunity You Don't Want to Miss! If you've been waiting for the right property to add to your portfolio - this is it. This spacious home offers over 2,000 square feet of living space with 4 bedrooms and room to maximize value. Whether you're looking for your next rental, flip, or long-term hold, the potential here is undeniable. Over 2,000 sq ft, 4 generous bedrooms, Laminate flooring throughout, Large lot with room to grow, Basement with plenty of storage and a Solid space! Strong potential. Prime Southside location. Opportunities like this don't last long - especially with this much square footage at this price point. Message me for details or to schedule a private showing. Let's make your next investment move a smart one!
-
2026-03-02$155,000 Active 758-char remark
Show marketing remark (758 chars)
Southside Investment Opportunity You Don't Want to Miss! If you've been waiting for the right property to add to your portfolio - this is it. This spacious home offers over 2,000 square feet of living space with 4 bedrooms and room to maximize value. Whether you're looking for your next rental, flip, or long-term hold, the potential here is undeniable. Over 2,000 sq ft, 4 generous bedrooms, Laminate flooring throughout, Large lot with room to grow, Basement with plenty of storage and a Solid space! Strong potential. Prime Southside location. Opportunities like this don't last long - especially with this much square footage at this price point. Message me for details or to schedule a private showing. Let's make your next investment move a smart one!
ⓘ Source: listings_history table (triggers on properties + properties_extension) + one-shot
backfill from property_details.listing_events for pre-trigger history.
Climate risk First Street
- Flood 1/10 Low FEMA zone X (unshaded) · 0% chance over 30 yrs
- Wildfire 1/10 Low
- Heat 3/10 Moderate 7 d/yr ≥100°F today · 18 d/yr by 30 yrs out
- Wind 2/10 Low 0% chance of damaging wind over 30 yrs
- Air quality 3/10 Moderate 2 unhealthy d/yr today · 3 by 30 yrs out
Nearby sold comps map
Loading sold comps map…
Walkable amenities ~0.75 mi
Loading nearby amenities…
Taxation est. · year 1
- Rental income
- $17,076
- − Mortgage interest
- −$7,842
- − Property taxes
- −$2,100
- − Insurance
- −$700
- − Repairs & maintenance
- −$1,366
- − Management
- −$1,366
- − Depreciation
- −$4,073
- Taxable loss
- −$371
- Est. tax savings @ 24.0%
- +$89
- After-tax cash flow
- $1,969/yr
For passive investors: Depreciation is non-cash, so a rental often shows a tax loss while cash-flowing — sheltering income. Rental losses are passive: they offset passive income freely, and up to $25,000/yr can offset ordinary (W-2) income if you actively participate and your MAGI is under $100k (phasing out to $0 by $150k); unused losses carry forward. On sale, claimed depreciation is recaptured at up to 25%, and gains may owe capital-gains tax (a 1031 exchange can defer both). Figures are a year-1 estimate at your 24.0% rate — not tax advice; consult a CPA.
Condition & rehab AI · 12 photos
This home requires moderate renovations to update the kitchen and bathroom, and paint the exterior. It has potential for significant value increase.
Repairs flagged
- Major kitchen cabinets — severely outdated and worn
- Major kitchen countertops — worn and in need of replacement
- Major kitchen appliances — outdated and in need of replacement
- Major bathroom fixtures — small and outdated
- Major exterior paint — chipped and worn
Value-add opportunities
- Both update kitchen — modern kitchen will attract more buyers and renters
- Both update bathroom — modern bathroom will attract more buyers and renters
- Both paint exterior — fresh paint will improve curb appeal and home value
Renovation cost estimate screening
| Repair item | Severity | Est. cost |
|---|---|---|
| kitchen cabinets · severely outdated and worn | Major | $15,000–50,000 |
| kitchen countertops · worn and in need of replacement | Major | $15,000–50,000 |
| kitchen appliances · outdated and in need of replacement | Major | $15,000–50,000 |
| bathroom fixtures · small and outdated | Major | $15,000–50,000 |
| exterior paint · chipped and worn | Major | $15,000–50,000 |
| Total estimated repair cost · 5 items | $75,000–250,000 |
Value-add ROI direction
- Both update kitchen — modern kitchen will attract more buyers and renters ↑
- Both update bathroom — modern bathroom will attract more buyers and renters ↑
- Both paint exterior — fresh paint will improve curb appeal and home value ↑
ⓘ Cost ranges are severity-bucket heuristics (US national rule-of-thumb). Get contractor quotes + a written scope before underwriting a rehab budget.
Schools (NCES district)
- District
- Anderson Community School Corporation
- NCES district ID
- 1800150
- Math proficiency
- 15% ▼ -14.00%
- Reading proficiency
- 23% ▼ -7.00%
- Median HH income
- $38,208
- Composite
- 15.93/100
- National rank
- #9250
- State rank
- #280 of 301 in IN
Livability — Anderson
- Score
- 60/100
- State rank
- #521
- US rank
- #18709
Category grades
Schools grade is shown separately in the Schools card above.
Census & demographics
- Census place
- Anderson, IN
- County
- Madison County · 69,445 people
- City population
- 57,762
- Metro
- Indianapolis-Carmel-Anderson, IN
- Population (ZIP)
- 19,073
- Household income
- $49,310
- Rent vs Own
- Severe rent burden
- 612.0
Population outlook (Madison County) Hauer SSP2
- Today (2025)
- 125,800 people
- By 2030
- 122,640 · -2.5%
- By 2040
- 115,420 · -8.3%
- By 2050
- 108,148 · -14.0%
- By 2075
- 91,838 · -27.0%
- By 2100
- 75,670 · -39.8%
Race, ethnicity, and origin ACS 2023
- Neighborhood character
- Predominantly White (83%)
- Race & ethnicity
- White 83% Two or more races 8% Black 7% Hispanic / Latino 3%
- Common ancestry
- Lithuanian 2% Slovak 2% Italian 1%
- Foreign-born
- 0% · Canada
- Languages at home
- 97% English-only · Spanish 2%
Political lean MEDSL · Madison
- 2024 margin
- Strong R (+26.9) · D 35.6% · R 62.5% · Other 1.9%
- 2008→2024 swing
- -33.5pp toward R · 2008: 6.5pp · 2024: -26.9pp
- All cycles
- 2024: R+26.9 2020: R+22.6 2016: R+25.7 2012: R+4.5 2008: D+6.5
Not yet ingested
- Civics
- —
Market trends
- HPI YoY
- ▼ -86.70%
- Current HPI
- 235.7485
- Rent YoY
- —
- Metro
- Indianapolis-Carmel-Anderson, IN
- State GDP YoY
- ▲ 2.90%
- F500 in state
- 18
Industry mix (Fortune 500 HQ in IN)
| Industry | F500 HQs | Revenue |
|---|---|---|
| Industrial Machinery | 2 | $37B |
|
||
| Healthcare | 1 | $177B |
|
||
| Pharmaceuticals | 1 | $45B |
|
||
| Metals / Steel | 1 | $18B |
|
||
| Agriculture | 1 | $17B |
|
||
| Packaging | 1 | $12B |
|
||
Price history
-9.7% since first listed2 events — show timeline
- 2026-03-24 Price Changed $140,000 MIBOR as Distributed by MLS Grid
- 2026-03-02 Listed $155,000 MIBOR as Distributed by MLS Grid
Cash-flow waterfall
monthlySold comps — $/sqft
last 12 mo · ≤1 miLoading sold comps…