199 Flamingo Ave · Fort Pierce, FL
Flood risk 1/10 · Minimal
- FEMA flood zone
- X (unshaded)
- Chance of flooding over 30 yrs
- 0.0%
- Est. flood insurance / yr
- $507 – $1,088
Fire risk 3/10 · Minor
- Est. fire insurance / yr
- $947 – $1,759
Heat risk 10/10 · Severe
- Hot days now (above 106°F)
- 7 days/yr
- Hot days in 30 yrs
- 25 days/yr
Wind risk 10/10 · Severe
- Chance of severe wind over 30 yrs
- 99.0%
Air-quality risk 2/10 · Minimal
- Unhealthy air days now
- 1 days/yr
- Unhealthy air days in 30 yrs
- 1 days/yr
Risk factors via First Street. Map © Google.
Why this score? — see what drove the B grade
The composite is a weighted blend of 9 inputs, each scored 0–100. Each bar is that input's sub-score; the figure is the points it added to the 100-point composite (weight × sub-score).
- Cash flow +30.0/30.0
- 1% rule +10.0/10.0
- DSCR +10.0/10.0
- ARV discount +7.5/15.0
- Rent growth +4.4/5.0
- Livability +3.8/5.0
- Condition / age +3.8/5.0
- Schools +3.7/10.0
- Appreciation +0.0/10.0
$55,000
🖨 Deal sheet 📄 Offer letter ✓ Due diligence
Listing remarks
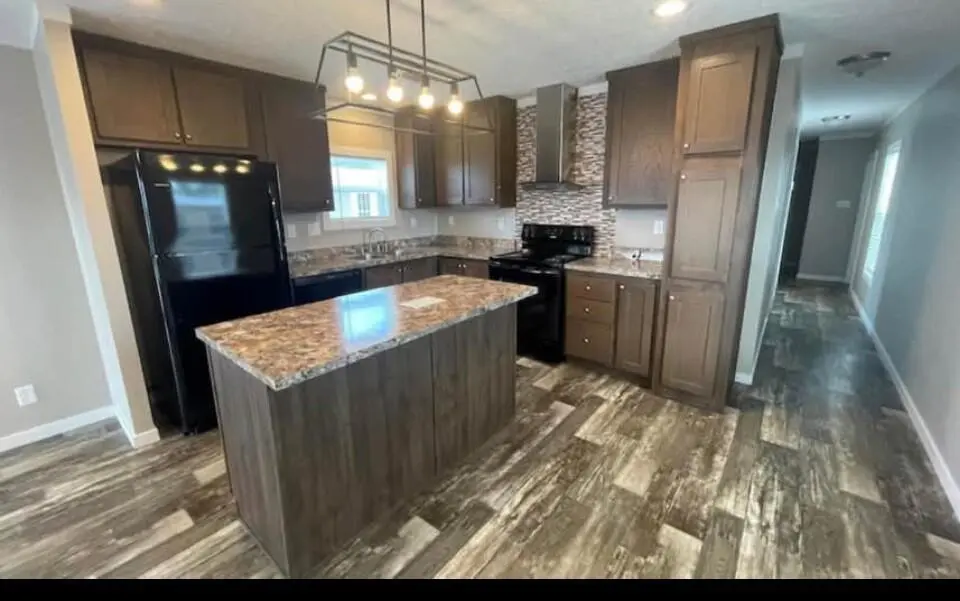
OWNER FINANCING for qualified buyer! CARPORT AND 12X12 SHED INCLUDED! Welcome to Sandhill Shores in Fort Pierce! This well-maintained mobile home on leased land features a bright open floorplan designed for comfortable living and entertaining. The spacious kitchen is the heart of the home, complete with a center island, ample cabinetry, and generous counter space—perfect for cooking, gathering, and everyday convenience. Sandhill Shores offers a vibrant lifestyle with amenities including a clubhouse, heated pool, shuffleboard courts, and a full calendar of social activities. Enjoy a friendly, active community in a peaceful setting. Conveniently located just minutes from shopping, dinin
Key facts
- Ample cabinetry
- Spacious kitchen
- Center island
Tags
Property features AI
Finance
- Financial info: Monthly land lease of $810 (land lease in effect); Land lease expires 2026-04-08
- HOA & community: Located in a senior community; Pets allowed with restrictions and limits
Exterior
- Parking: Attached carport; Covered carport for 2 vehicles; Driveway; Total 2 parking spaces
- Utilities: Public water; Public sewer; Cable available; Electricity available; Sewer connected; Water connected
- Home design: Manufactured home; Resale; One story; Faces south
- Construction: Vinyl siding; Shingle roof; Built as manufactured home construction
- Exterior features: Open patio and open porch; Shed(s); Zero lot line; Not waterfront; East of US-1 road frontage
Interior
- Kitchen: Dishwasher; Microwave; Refrigerator; Freezer
- Bedrooms: 2 bedrooms (main level)
- Flooring: Carpet; Laminate
- Bathrooms: 2 full bathrooms (main level)
- Heating & cooling: Central heating; Central air; Ceiling fans; Electric cooling
- Interior features: Kitchen island
Neighborhood map
What this means for you Summary
Snapshot
- This is a 2-bed/2.0-bath single-family listed at $55k. Condition is rated good.
Deal economics
- At list price, monthly cash flow is $911 ($11k/yr) — positive.
- The deal already cash-flows at list — no discount required.
- Meets the 1% rule at list price ($2k rent vs $55k).
- Recommended offer: $52k (6.0% below list) — sets the bar for market timing.
- Cap rate 26.2% vs local median 3.7% in Fort Pierce — top-decile yield for the area; either an underpriced asset or a hidden risk that comps aren't pricing in. Stress-test before assuming the spread holds.
Location & tenants
- Location reads 76/100 on livability (#226 in FL, #3,360 nationally) — a middle-class / working-renter tenant base. Strengths: commute A+, cost of living A+, housing A+; Watch: crime D+, schools D, amenities F.
- St. Lucie (urban): math 40% / reading 48% proficiency, ranked #51 of 73 in FL (top 70%) — families likely to look elsewhere, expect single-tenant / working-renter base with shorter leases.
- Market conditions: Rents rising fast (+7.4%/yr); 336 active listings in the ZIP; 26 comparable units currently listed for rent nearby; rentals at typical pace (median 24d on market — plan ~3-4 weeks tenant-placement turnaround); 4,868 units permitted in St. Lucie County in 2024 (268 in 5+ unit buildings).
- This rent runs 36% of the median local income ($54k/yr) — at the standard rent-burdened threshold; future hikes will face affordability resistance.
Forward outlook
- Local home prices are declining (-3.0%/yr); year-one equity from $380 of loan paydown is wiped out by about $2k of value loss. Plan a longer hold.
- St. Lucie County population projected at +20% by 2050 — long-run rental-demand tailwind backs the buy-and-hold thesis.
- At projected returns (-3.0% appreciation + 7.4% rent growth), your $15k cash investment doubles in ~2 years — after that, you're playing with house money.
Negotiation context
- It's been on market 70 days — a 6% lower offer ($52k) is reasonable based on typical stale-listing flexibility.
- 3 sale attempts since 3y ago; this cycle's ask has dropped $10k (15%) from the opening price — seller is motivated, your offer sets the floor, not the list.
Risks & watch-outs
- Climate carrying-cost: severe wind risk, 99% chance of damaging wind over 30y; extreme-heat days projected 7→25/yr by 2055 (HVAC capex compounding) — expect insurance premiums to compound above CPI over the hold.
Questions for the listing agent
- It's been on market 70 days. Have you received any prior offers? Is the seller open to a 6% concession, seller financing, or rate buy-down credit?
- Why hasn't it sold? Are there any deal-killer items the seller is aware of (foundation, flood, title, zoning, code violations)?
- Is there a deadline driving the sale (1031 exchange, divorce, estate, relocation)? That informs how much negotiation room exists.
- Schools are D-rated, which usually means shorter tenancies and higher turnover. Who's the typical renter profile here, and what's been the actual vacancy rate?
- Crime grade is D in this area — have there been break-ins, vandalism, or insurance claims at this property in the last 3 years? What carrier currently insures it and at what premium?
- What's the average days-on-market for RENTAL listings here right now (not sales)? A rising rental-DOM trend means longer vacancies and softer asking-rent achievability than the comps imply.
- What's the recent tenant-quality profile in this submarket — average credit score on applications, eviction rate, late-payment / NSF rate, and stable-employment percentage? A property-management company in the area should have these aggregated.
- How much new for-sale + rental construction is in the pipeline within 1–3 miles? Heavy new supply typically softens prices + rents 12–24 months out; constrained supply supports both.
Investment metrics
- 1% rule
- 2.97% ✓
- Cap rate
- 26.18%
- Cash-on-cash
- 71.01%
- DSCR
- 4.16
- GRM
- 2.8
CMA / ARV
- ARV (on-the-fly)
- $246,720
- Comps found
- 1
Show comp detail 1 sale within ~0.75 mi
| Address | Dist | Beds/Ba | Sqft | Sold | Price | $/sf | Match |
|---|---|---|---|---|---|---|---|
| 509 Azalea Ave | 0.58mi | 2/1.0 | 960 (0%) | 21mo | $247,000 | $257 | 51 |
Match score weights: distance 35% · size 25% · config 20% · recency 20%. Top-matched comps best support the ARV.
Projected returns pro-forma
-3.0% appreciation · 7.42% rent growth · sell at horizon
- IRR
- 75.6%
- Equity multiple
- 4.69×
- Total profit
- $56,750
- Equity at exit
- $8,201
- IRR
- 80.5%
- Equity multiple
- 11.29×
- Total profit
- $158,400
- Equity at exit
- $4,755
Cash invested: $15,400 (down + closing). Projections, not guarantees.
Landlord ↔ Tenant lean methodology
- Overall (STATE)
- 87 Strongly Landlord-Friendly
- State Florida
- 87 Strongly Landlord-Friendly · R+3
- County
- — inherits STATE
- City
- — inherits STATE
ZIP-level market 34982
- Home prices YoY
- -33.4%
- Rents YoY
- 7.4%
- Active inventory
- 336
- Price-to-rent
- 2.8×
Monthly cashflow live
- Estimated rent
- $1,635 high interval (Pro) →
- Mortgage (P&I)
- −$288
- Tax est. 1.5%
- −$69 /mo · $825/yr
- Insurance
- −$23
- HOA
- −$0
- Vacancy / Maint / Mgmt
- −$343
- Net cashflow
- $911
Break-even live
UW: 25.0% down · 7.5% · 30yr · 1.5% tax · 5.0% vac · 8.0% maint · 8.0% mgmt
Financing live
Cash to close
- Down payment
- $13,750
- Closing costs
- $1,650
- Reserves months
- —
- Total cash needed
- —
Loan-product check · same deal, 3 products live
Conventional
25% down · 7.5% · 30yr
- Down + closing
- —
- Monthly P&I
- —
- Monthly cashflow
- —
- DSCR
- —
- Eligible?
- —
Personal DTI + credit; lowest rate.
DSCR
20% down · 8.5% · 30yr
- Down + closing
- —
- Monthly P&I
- —
- Monthly cashflow
- —
- DSCR
- —
- Eligible?
- —
No personal income docs; deal must DSCR.
Hard money
10% down · 12.0% · 12mo
- Down + closing
- —
- Monthly P&I
- —
- Monthly cashflow
- —
- DSCR
- —
- Eligible?
- —
Short-term bridge; refi at stabilization.
Rent comps 26 comps
| Address | Beds | Baths | Sqft | Rent | $/sqft | DOM | Units | Dist |
|---|---|---|---|---|---|---|---|---|
| 3200 S US Highway 1 Fort Pierce, FL | 2.0–3.0 | 1.0–2.0 | 1144 | $1,509 | $1.32 | 14d | 1 | 0.14mi |
| 605 Ixoria Ave Fort Pierce, FL | 2.0 | 2.0 | 744 | $1,450 | $1.95 | 14d | 2 | 0.41mi |
| 605 Ixoria Ave #15 Fort Pierce, FL | 2.0 | 2.0 | 744 | $1,500 | $2.02 | 23d | 1 | 0.44mi |
| 3261 S US Highway 1 Unit 1 Fort Pierce, FL | 1.0 | 1.0 | 576 | $1,050 | $1.82 | 23d | 1 | 0.44mi |
| 617 Ixoria Ave Unit 2A Fort Pierce, FL | 2.0 | 2.5 | 764 | $1,500 | $1.96 | 23d | 1 | 0.49mi |
| 410 Palm Ave Apt B Fort Pierce, FL | 2.0 | 1.0 | 800 | $1,400 | $1.75 | 14d | 1 | 0.50mi |
| 3266 S 7th St Fort Pierce, FL | 1.0 | 1.0 | 672 | $1,400 | $2.08 | 23d | 1 | 0.51mi |
| 800 Kanner Dr Unit B Fort Pierce, FL | 2.0 | 1.0 | 900 | $1,550 | $1.72 | 14d | 1 | 0.55mi |
| 802 N Lake Dr Unit B Fort Pierce, FL | 2.0 | 1.0 | 1000 | $1,550 | $1.55 | 23d | 1 | 0.65mi |
| 916 Savannas Point Dr Fort Pierce, FL | 2.0 | 2.0 | 1120 | $2,100 | $1.88 | 14d | 1 | 0.66mi |
| 2625 Heathcote Dr Unit 2631 Fort Pierce, FL | 2.0 | 2.0 | 1000 | $1,700 | $1.70 | 14d | 1 | 0.66mi |
| 2625 Heathcote Dr Unit 2623 Fort Pierce, FL | 2.0 | 2.0 | 1000 | $1,700 | $1.70 | 23d | 1 | 0.66mi |
| 2625 Heathcote Dr Unit 2647 Fort Pierce, FL | 2.0 | 2.0 | 1000 | $1,700 | $1.70 | 21d | 1 | 0.66mi |
| 115 Maple Ave Fort Pierce, FL | 3.0 | 1.0 | 1008 | $1,999 | $1.98 | 23d | 1 | 0.69mi |
| 3300 S 7th St Unit B Fort Pierce, FL | 2.0 | 1.0 | 800 | $1,595 | $1.99 | 23d | 1 | 0.71mi |
| 322 Colony Ln Unit C Fort Pierce, FL | 1.0 | 1.5 | 816 | $1,375 | $1.69 | 23d | 1 | 0.77mi |
| 947 Fra Mar Pl Fort Pierce, FL | 2.0 | 1.0 | 768 | $1,700 | $2.21 | 23d | 1 | 0.96mi |
| 2050 Oleander Blvd Unit 703 Fort Pierce, FL | 2.0 | 2.0 | 1014 | $1,800 | $1.78 | 23d | 1 | 1.13mi |
| 2302 Sunrise Blvd #201 Fort Pierce, FL | 2.0 | 1.0 | 966 | $1,500 | $1.55 | 23d | 1 | 1.23mi |
| 2016 Golfview Ct Fort Pierce, FL | 2.0 | 1.0 | 1055 | $1,750 | $1.66 | 23d | 1 | 1.24mi |
| 2015 Oleander Blvd Unit D Fort Pierce, FL | 1.0 | 1.5 | 660 | $1,475 | $2.23 | 23d | 1 | 1.29mi |
| 2016 S 10th St Unit A Fort Pierce, FL | 2.0 | 2.5 | 1120 | $1,595 | $1.42 | 23d | 1 | 1.30mi |
| 1717 Linwood Ave Fort Pierce, FL | 2.0 | 1.0 | 712 | $1,800 | $2.53 | 23d | 1 | 1.30mi |
| 2050 Oleander Blvd Fort Pierce, FL | 1.0–2.0 | 1.0–2.0 | 833 | $2,350 | $2.82 | 23d | 4 | 1.32mi |
| 2011 Oleander Blvd Unit C Fort Pierce, FL | 1.0 | 1.5 | 660 | $1,450 | $2.20 | 23d | 1 | 1.32mi |
| 2517 S 17th St Fort Pierce, FL | 1.0 | 1.0 | 1007 | $1,795 | $1.78 | 14d | 1 | 1.44mi |
Listing history 23 events
-
2026-06-18days on market $55,000 Active 70 DOM
-
2026-06-17days on market $55,000 Active 69 DOM
-
2026-06-16days on market $55,000 Active 68 DOM
-
2026-06-15days on market $55,000 Active 67 DOM
-
2026-06-14days on market $55,000 Active 65 DOM
-
2026-06-13days on market $55,000 Active 64 DOM
-
2026-06-10days on market $55,000 Active 62 DOM
-
2026-06-09days on market $55,000 Active 61 DOM
-
2026-06-08days on market $55,000 Active 60 DOM
-
2026-06-07days on market $55,000 Active 59 DOM
-
2026-06-05days on market $55,000 Active 56 DOM
-
2026-06-03days on market $55,000 Active 55 DOM
-
2026-06-02days on market $55,000 Active 54 DOM
-
2026-06-01days on market $55,000 Active 53 DOM
-
2026-05-31days on market $55,000 Active 52 DOM
-
2026-05-30days on market $55,000 Active 51 DOM
-
2026-04-23price $60,000
-
2026-04-08$65,000 Active
-
2024-08-07historical $1,600
-
2024-07-07price $1,600
-
2024-06-26$1,700
-
2023-12-22historical $1,400
-
2023-12-19$1,400
ⓘ Source: listings_history table (triggers on properties + properties_extension) + one-shot
backfill from property_details.listing_events for pre-trigger history.
Climate risk First Street
- Flood 1/10 Low FEMA zone X (unshaded) · 0% chance over 30 yrs
- Wildfire 3/10 Moderate
- Heat 10/10 Extreme 7 d/yr ≥106°F today · 25 d/yr by 30 yrs out
- Wind 10/10 Extreme 99% chance of damaging wind over 30 yrs
- Air quality 2/10 Low 1 unhealthy d/yr today · 1 by 30 yrs out
Nearby sold comps map
Loading sold comps map…
Walkable amenities ~0.75 mi
Loading nearby amenities…
Taxation est. · year 1
- Rental income
- $19,617
- − Mortgage interest
- −$3,081
- − Property taxes
- −$825
- − Insurance
- −$275
- − Repairs & maintenance
- −$1,569
- − Management
- −$1,569
- − Depreciation
- −$1,600
- Taxable income
- $10,697
- Est. tax owed @ 24.0%
- −$2,567
- After-tax cash flow
- $8,369/yr
For passive investors: Depreciation is non-cash, so a rental often shows a tax loss while cash-flowing — sheltering income. Rental losses are passive: they offset passive income freely, and up to $25,000/yr can offset ordinary (W-2) income if you actively participate and your MAGI is under $100k (phasing out to $0 by $150k); unused losses carry forward. On sale, claimed depreciation is recaptured at up to 25%, and gains may owe capital-gains tax (a 1031 exchange can defer both). Figures are a year-1 estimate at your 24.0% rate — not tax advice; consult a CPA.
Condition & rehab AI · 6 photos
This well-maintained mobile home on leased land features a bright open floorplan with a modern kitchen and updated bathrooms. It is in good condition and ready for a new owner to move in and enjoy the community amenities.
Value-add opportunities
- Both Painting the interior walls — Fresh paint can enhance the home's curb appeal and interior aesthetics.
- Both Landscaping and curb appeal improvements — A well-maintained exterior can attract more buyers and renters.
- Both Upgrading the HVAC system — A newer, more efficient HVAC system can improve comfort and energy efficiency, attracting more buyers and renters.
- Both Adding smart home features — Smart home features can increase the home's appeal and value, especially for tech-savvy buyers and renters.
Renovation cost estimate screening
Value-add ROI direction
- Both Painting the interior walls — Fresh paint can enhance the home's curb appeal and interior aesthetics. ↑
- Both Landscaping and curb appeal improvements — A well-maintained exterior can attract more buyers and renters. ↑
- Both Upgrading the HVAC system — A newer, more efficient HVAC system can improve comfort and energy efficiency, attracting more buyers and renters. ↑
- Both Adding smart home features — Smart home features can increase the home's appeal and value, especially for tech-savvy buyers and renters. ↑
ⓘ Cost ranges are severity-bucket heuristics (US national rule-of-thumb). Get contractor quotes + a written scope before underwriting a rehab budget.
Schools (NCES district)
- District
- St. Lucie
- NCES district ID
- 1201770
- Math proficiency
- 40% ▼ -11.00%
- Reading proficiency
- 48% ▼ -4.00%
- Median HH income
- $44,737
- Composite
- 37.28/100
- National rank
- #4449
- State rank
- #51 of 73 in FL
Livability — Fort Pierce
- Score
- 76/100
- State rank
- #226
- US rank
- #3360
Category grades
Schools grade is shown separately in the Schools card above.
Census & demographics
- Census place
- Fort Pierce, FL
- County
- Saint Lucie County · 337,150 people
- City population
- 78,556
- Metro
- Port St. Lucie, FL
- Population (ZIP)
- 31,143
- Household income
- $54,082
- Rent vs Own
- Severe rent burden
- 1086.0
Population outlook (St. Lucie County) Hauer SSP2
- Today (2025)
- 338,016 people
- By 2030
- 355,687 · +5.2%
- By 2040
- 385,521 · +14.1%
- By 2050
- 406,106 · +20.1%
- By 2075
- 441,054 · +30.5%
- By 2100
- 436,885 · +29.2%
Race, ethnicity, and origin ACS 2023
- Neighborhood character
- Majority White (62%)
- Race & ethnicity
- White 62% Hispanic / Latino 22% Two or more races 12% Black 12%
- Hispanic origin (detail)
- Mexican 10% Puerto Rican 3% Cuban 3%
- Common ancestry
- Italian 7% Hispanic 2% Lithuanian 1%
- Foreign-born
- 12% · Canada
- Languages at home
- 80% English-only · Spanish 16% French/Haitian/Cajun 3%
Political lean MEDSL · St. Lucie
- 2024 margin
- Lean R (+9.1) · D 45.1% · R 54.2%
- 2008→2024 swing
- -21.2pp toward R · 2008: 12.1pp · 2024: -9.1pp
- All cycles
- 2024: R+9.1 2020: R+1.6 2016: R+2.5 2012: D+7.9 2008: D+12.1
Not yet ingested
- Civics
- —
Market trends
- HPI YoY
- ▼ -199.47%
- Current HPI
- 397.2649
- Rent YoY
- ▲ 7.42%
- Metro
- Port St. Lucie, FL
- State GDP YoY
- ▲ 3.28%
- F500 in state
- 36
Industry mix (Fortune 500 HQ in FL)
| Industry | F500 HQs | Revenue |
|---|---|---|
| Industrial Technology | 2 | $29B |
|
||
| Insurance | 2 | $17B |
|
||
| Retail | 1 | $60B |
|
||
| Technology Distribution | 1 | $58B |
|
||
| Homebuilding | 1 | $35B |
|
||
| Technology Manufacturing | 1 | $35B |
|
||
Price history
+4185.7% since first listed7 events — show timeline
- 2026-04-23 Price Changed $60,000 Beaches MLS
- 2026-04-08 Listed $65,000 Beaches MLS
- 2024-08-07 Rental Removed $1,600 GFLMLS
- 2024-07-07 Price Changed $1,600 GFLMLS
- 2024-06-26 Listed for Rent $1,700 GFLMLS
- 2023-12-22 Rental Removed $1,400 RMLSFL
- 2023-12-19 Listed for Rent $1,400 RMLSFL
Cash-flow waterfall
monthlySold comps — $/sqft
last 12 mo · ≤1 miLoading sold comps…