 Fourplex
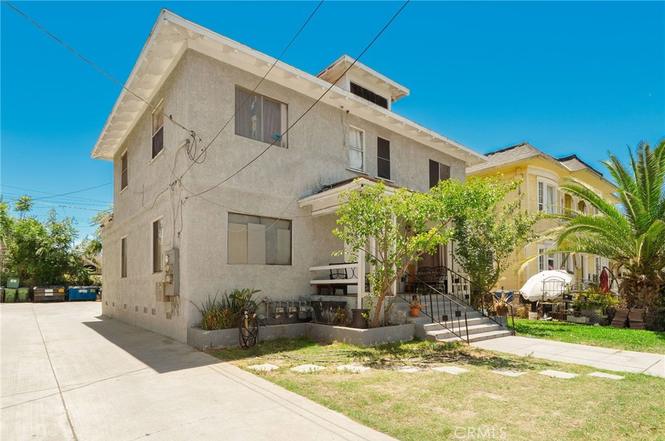
1256 W 22nd · Los Angeles, CA
Flood risk 1/10 · Minimal
- FEMA flood zone
- X (unshaded)
- Chance of flooding over 30 yrs
- 0.0%
- Est. flood insurance / yr
- $507 – $1,088
Fire risk 1/10 · Minimal
- Est. fire insurance / yr
- $659 – $1,223
Heat risk 6/10 · Moderate
- Hot days now (above 90°F)
- 7 days/yr
- Hot days in 30 yrs
- 22 days/yr
Wind risk 1/10 · Minimal
- Chance of severe wind over 30 yrs
- —
Air-quality risk 5/10 · Moderate
- Unhealthy air days now
- 7 days/yr
- Unhealthy air days in 30 yrs
- 7 days/yr
Risk factors via First Street. Map © Google.
Why this score? — see what drove the C+ grade
The composite is a weighted blend of 9 inputs, each scored 0–100. Each bar is that input's sub-score; the figure is the points it added to the 100-point composite (weight × sub-score).
- Cash flow +24.9/30.0
- ARV discount +8.9/15.0
- DSCR +8.1/10.0
- 1% rule +5.6/10.0
- Rent growth +4.0/5.0
- Schools +3.6/10.0
- Livability +3.4/5.0
- Condition / age +2.5/5.0
- Appreciation +0.0/10.0
$875,000
🖨 Deal sheet 📄 Offer letter ✓ Due diligence
Multi-family units
County records classify this as Multi-Family (2-4 Unit). Listing-text estimate: 4 units. confirmed
Listing remarks
Prime 4-unit investment opportunity just steps from USC and located within the USC Security Patrol Zone. This beautifully restored apartment building offers an exceptional location near USC, the LA Memorial Coliseum, BMO Stadium, the Natural History Museum, and Downtown Los Angeles. Subject to LA City RSO rent control, the property presents significant upside potential with one unit currently eligible for eviction due to non-payment. Based on comparable rentals in the area, a renovated unit may support substantially higher rental income. Ideal for investors or owner-occupants seeking a value-add opportunity with strong long-term cash flow potential in one of Los Angeles' most well-priced re
Key facts
- Renovated unit
- 5,859 sq ft lot
- Garage
Tags
Property features AI
Finance
- Other: Total building area: 2,436; Total number of units: 10; Number of buildings: 1; Number of leased units: 4; Tenant pays gas and electricity
- Financial info: Total actual rent: $3,244; Gross scheduled income: $38,928; Operating/other expenses listed (insurance and trash included)
- HOA & community: Rent control
Exterior
- Parking: Paved on-site parking; Driveway parking; Parking spaces available; Each unit has one garage space (per unit type listings)
- Utilities: Public sewer; Natural gas connected; Electricity connected; Water connected; Four separate water meters; Four separate gas meters; Four separate electric meters
- Home design: Attached property; Two-story building; Entry level: 1
- Construction: Asphalt roof; Built (year per public records)
- Exterior features: No pool; Street lighting in the neighborhood
Interior
- Kitchen: Gas range
- Bedrooms: One-bedroom units (multiple units)
- Bathrooms: One full bathroom in each unit
- Heating & cooling: Wall/window cooling
- Interior features: Two levels; Entry on level 1
- Laundry & utility: On-site laundry (see remarks)
Neighborhood map
What this means for you Summary
Snapshot
- This is a 4 × 2-bed/2.5-bath units multifamily listed at $875k.
Deal economics
- At list price, monthly cash flow is $2k ($23k/yr) — positive. Per door: $470/mo.
- The deal already cash-flows at list — no discount required.
- Meets the 1% rule at list price ($9k rent vs $875k).
- Cap rate 8.9% vs local median 2.1% in Los Angeles — top-decile yield for the area; either an underpriced asset or a hidden risk that comps aren't pricing in. Stress-test before assuming the spread holds.
Location & tenants
- Location reads 68/100 on livability (#273 in CA) — a middle-class / working-renter tenant base. Strengths: amenities A+, commute A+, employment B; Watch: health & safety C-, schools D+, crime F.
- Los Angeles Unified (urban): math 29% / reading 54% proficiency, ranked #223 of 517 in CA (top 43%) — families likely to look elsewhere, expect single-tenant / working-renter base with shorter leases; 67% free/reduced lunch — lower-income household profile, screen leases tightly.
- Market conditions: Rents rising fast (+5.9%/yr); 82 active listings in the ZIP; 40 comparable units currently listed for rent nearby; rentals lingering (median 44d on market — plan ~5-8 weeks vacancy on turnover, expect pricing pressure); 55% of comp listings sitting > 30 days — soft ceiling on asking rent; lower-income renter base — watch delinquency; 19,697 units permitted in Los Angeles County in 2024 (9,426 in 5+ unit buildings).
- At $9,291/mo this rent would consume 315% of the median local household income ($35k/yr) (locally 4179% of renters already pay >50% of income on rent) — very limited rent-growth headroom before tenants either downsize or default.
Forward outlook
- Local home prices are declining (-3.0%/yr); year-one equity from $6k of loan paydown is wiped out by about $26k of value loss. Plan a longer hold.
- Los Angeles County population projected at +9% by 2050 — modest demand growth; plan on rents tracking national, not racing it.
- At projected returns (-3.0% appreciation + 5.9% rent growth), your $245k cash investment doubles in ~9 years — after that, you're playing with house money.
Negotiation context
- Only 7 days on market — expect competitive offers; lowballing is unlikely to land.
- 5 sale attempts since 24y ago with the ask held roughly flat each time — persistent listings suggest the price (not the market) is what's stuck; bring a comps-based counter.
- Current owner paid $200k; list at $875k implies a 338% gain — meaningful room to come down on a strong offer.
Risks & watch-outs
- Watch-outs: built in 1901 — expect roof / HVAC / electrical / plumbing capex.
- Climate carrying-cost: extreme-heat days projected 7→22/yr by 2055 (HVAC capex compounding) — expect insurance premiums to compound above CPI over the hold.
Questions for the listing agent
- Can we see the unit-by-unit rent roll, current vacancy, and any below-market leases? What's the average tenancy length?
- What capital expenditures (roof, boiler, parking lot, exteriors) have been made in the last 5 years, and what's planned in the next 2?
- Built in 1901 — when were the roof, HVAC, electrical panel, plumbing, and water heater last replaced?
- Is there a deadline driving the sale (1031 exchange, divorce, estate, relocation)? That informs how much negotiation room exists.
- Schools are D-rated, which usually means shorter tenancies and higher turnover. Who's the typical renter profile here, and what's been the actual vacancy rate?
- Crime grade is F in this area — have there been break-ins, vandalism, or insurance claims at this property in the last 3 years? What carrier currently insures it and at what premium?
- What's the average days-on-market for RENTAL listings here right now (not sales)? A rising rental-DOM trend means longer vacancies and softer asking-rent achievability than the comps imply.
- What's the recent tenant-quality profile in this submarket — average credit score on applications, eviction rate, late-payment / NSF rate, and stable-employment percentage? A property-management company in the area should have these aggregated.
- How much new apartment / multifamily construction is in the pipeline within 1–3 miles? Heavy new supply (>2% of stock underway) typically softens rents 12–24 months out; light construction supports rent growth.
Investment metrics
- 1% rule
- 1.06% ✓
- Cap rate
- 8.87%
- Cash-on-cash
- 9.21%
- DSCR
- 1.41
- GRM
- 7.8
CMA / ARV
- ARV (on-the-fly)
- $903,756
- Comps found
- 4
Show comp detail 4 sales within ~0.75 mi
| Address | Dist | Beds/Ba | Sqft | Sold | Price | $/sf | Match |
|---|---|---|---|---|---|---|---|
| 1716 Magnolia Ave | 0.48mi | 4/4.0 | 2,492 (+2%) | 3mo | $680,000 | $273 | 71 |
| 2324 Portland St | 0.32mi | 5/4.0 (+1) | 2,301 (-6%) | 13mo | $1,175,000 | $511 | 60 |
| 1275 W 25th St | 0.22mi | 5/3.5 (+1) | 2,800 (+15%) | 22mo | $900,000 | $321 | 40 |
| 1734 Magnolia Ave | 0.44mi | 5/3.0 (+1) | 2,125 (-13%) | 19mo | $789,000 | $371 | 33 |
Match score weights: distance 35% · size 25% · config 20% · recency 20%. Top-matched comps best support the ARV.
Projected returns pro-forma
-3.0% appreciation · 5.88% rent growth · sell at horizon
- IRR
- 0.6%
- Equity multiple
- 1.02×
- Total profit
- $5,404
- Equity at exit
- $130,465
- IRR
- 12.7%
- Equity multiple
- 2.14×
- Total profit
- $278,545
- Equity at exit
- $75,654
Cash invested: $245,000 (down + closing). Projections, not guarantees.
Landlord ↔ Tenant lean methodology
- Overall (CITY)
- 0 Strongly Tenant-Friendly
- State California
- 18 Strongly Tenant-Friendly · D+13
- County
- — inherits STATE
- City Los Angeles
- 0 Strongly Tenant-Friendly · D+22
ZIP-level market 90007
- Home prices YoY
- -32.8%
- Rents YoY
- 5.9%
- Active inventory
- 82
- Price-to-rent
- 31.4×
Monthly cashflow live
- Estimated rent
- $9,291 high interval (Pro) →
- Mortgage (P&I)
- −$4,589
- Tax from tax record
- −$507 /mo · $6,085/yr
- Insurance
- −$365
- HOA
- −$0
- Vacancy / Maint / Mgmt
- −$1,951
- Net cashflow
- $1,880
Break-even live
4-unit breakdown (identical units grouped — click to expand)
| Units | Beds | Baths | Est. rent |
|---|---|---|---|
| 4× units | 2 | 2.5 | $9,292 |
| #1 | 2 | 2.5 | $2,323 |
| #2 | 2 | 2.5 | $2,323 |
| #3 | 2 | 2.5 | $2,323 |
| #4 | 2 | 2.5 | $2,323 |
| Total (4 units) | $9,291 | ||
UW: 25.0% down · 7.5% · 30yr · 1.5% tax · 5.0% vac · 8.0% maint · 8.0% mgmt
Financing live
Cash to close
- Down payment
- $218,750
- Closing costs
- $26,250
- Reserves months
- —
- Total cash needed
- —
Loan-product check · same deal, 3 products live
Conventional
25% down · 7.5% · 30yr
- Down + closing
- —
- Monthly P&I
- —
- Monthly cashflow
- —
- DSCR
- —
- Eligible?
- —
Personal DTI + credit; lowest rate.
DSCR
20% down · 8.5% · 30yr
- Down + closing
- —
- Monthly P&I
- —
- Monthly cashflow
- —
- DSCR
- —
- Eligible?
- —
No personal income docs; deal must DSCR.
Hard money
10% down · 12.0% · 12mo
- Down + closing
- —
- Monthly P&I
- —
- Monthly cashflow
- —
- DSCR
- —
- Eligible?
- —
Short-term bridge; refi at stabilization.
Rent comps 40 comps
| Address | Beds | Baths | Sqft | Rent | $/sqft | DOM | Units | Dist |
|---|---|---|---|---|---|---|---|---|
| 2601 S Hoover St Los Angeles, CA | 8.0 | 1.0–8.0 | 1477 | $7,850 | $5.31 | 1d | 1 | 0.33mi |
| 922 W 23rd St Unit 103 Los Angeles, CA | 4.0 | 2.0 | 1925 | $3,700 | $1.92 | 7d | 1 | 0.34mi |
| 922 W 23rd St Unit 101 Los Angeles, CA | 3.0 | 2.0 | 1723 | $2,990 | $1.74 | 7d | 1 | 0.35mi |
| 2652 Ellendale Pl Los Angeles, CA | 2.0–5.0 | 2.0–3.0 | 1200 | $1,517 | $1.26 | 43d | 1 | 0.36mi |
| 1822 Orchard Ave #1822 Los Angeles, CA | 5.0 | 5.0 | 1943 | $4,125 | $2.12 | 22d | 1 | 0.36mi |
| 1820 Orchard Ave Los Angeles, CA | 4.0 | 4.0 | 1642 | $4,000 | $2.44 | 43d | 1 | 0.36mi |
| 1820 Orchard Ave Unit 1822 Los Angeles, CA | 5.0 | 5.0 | 1943 | $4,125 | $2.12 | 2d | 1 | 0.36mi |
| 2317 Scarff St Unit B Los Angeles, CA | 5.0 | 3.5 | 3000 | $5,995 | $2.00 | 43d | 1 | 0.38mi |
| 2640 Menlo Ave Los Angeles, CA | 2.0–9.0 | 2.0–7.5 | 2185 | $5,629 | $2.58 | 1d | 2 | 0.39mi |
| 1645 1/2 S New Hampshire Ave Los Angeles, CA | 5.0 | 5.0 | 1837 | $4,125 | $2.25 | 22d | 1 | 0.62mi |
| 1645 1/2 S New Hampshire Ave Los Angeles, CA | 5.0 | 5.0 | 1837 | $4,125 | $2.25 | 43d | 1 | 0.62mi |
| 1631 S New Hampshire Ave Unit 1/2 Los Angeles, CA | 5.0 | 5.0 | 2007 | $3,895 | $1.94 | 43d | 1 | 0.63mi |
| 1408 S Burlington Ave Los Angeles, CA | 3.0 | 2.0 | 1800 | $3,200 | $1.78 | 43d | 1 | 0.63mi |
| 1631 S New Hampshire Ave Unit 2 Los Angeles, CA | 4.0 | 5.0 | 2007 | $3,895 | $1.94 | 43d | 1 | 0.63mi |
| 1629 S New Hampshire Ave Unit 1631 Los Angeles, CA | 5.0 | 5.0 | 2050 | $3,895 | $1.90 | 43d | 1 | 0.64mi |
| 2250 W 14th St Los Angeles, CA | 4.0 | 4.0 | 1905 | $4,300 | $2.26 | 43d | 1 | 0.70mi |
| 1429 S New Hampshire Ave Los Angeles, CA | 5.0 | 5.0 | 1837 | $4,125 | $2.25 | 43d | 1 | 0.75mi |
| 1427 S New Hampshire Ave Los Angeles, CA | 5.0 | 4.0 | 1800 | $4,217 | $2.34 | 43d | 1 | 0.75mi |
| 1423 1/2 S New Hampshire Ave Los Angeles, CA | 5.0 | 5.0 | 1837 | $4,125 | $2.25 | 43d | 1 | 0.76mi |
| 1419 1/2 S New Hampshire Ave Los Angeles, CA | 5.0 | 5.0 | 1837 | $4,125 | $2.25 | 43d | 1 | 0.77mi |
| 1821 W 12th Pl Apt 2 Los Angeles, CA | 4.0 | 4.5 | 1700 | $4,500 | $2.65 | 43d | 1 | 0.85mi |
| 1153 Magnolia Ave Los Angeles, CA | 4.0 | 2.5 | 2400 | $5,499 | $2.29 | 43d | 1 | 0.92mi |
| 1766 W 25th St Unit 2 Los Angeles, CA | 3.0 | 2.0 | 1900 | $4,500 | $2.37 | 43d | 1 | 0.95mi |
| 1766 W 25th St Los Angeles, CA | 3.0 | 2.0 | 1900 | $4,500 | $2.37 | 43d | 1 | 0.95mi |
| 1224 W 35th St Los Angeles, CA | 4.0 | 4.0 | 1600 | $1,240 | $0.78 | 7d | 1 | 0.99mi |
| 2017 S La Salle Ave Los Angeles, CA | 5.0 | 3.0 | 2408 | $5,495 | $2.28 | 24d | 1 | 1.03mi |
| 1228 Fedora St Los Angeles, CA | 5.0 | 3.0 | 1740 | $5,495 | $3.16 | 2d | 1 | 1.07mi |
| 991 Arapahoe St Unit 402A Los Angeles, CA | 3.0 | 3.0 | 1700 | $3,880 | $2.28 | 24d | 1 | 1.16mi |
| 2716 S La Salle Ave Los Angeles, CA | 3.0 | 3.0 | 2499 | $5,400 | $2.16 | 2d | 1 | 1.16mi |
| 1200 S Figueroa St Los Angeles, CA | 1.0–3.0 | 1.0–4.0 | 2305 | $23,215 | $10.07 | 1d | 32 | 1.18mi |
| 2713 S La Salle Ave Los Angeles, CA | 4.0 | 2.5 | 1800 | $4,500 | $2.50 | 24d | 1 | 1.19mi |
| 1118 S Mariposa Ave Unit 1116 A Los Angeles, CA | 3.0 | 3.5 | 1750 | $4,150 | $2.37 | 43d | 1 | 1.22mi |
| 2954 1/2 S La Salle Ave Unit 1 Los Angeles, CA | 5.0 | 3.0 | 1870 | $4,999 | $2.67 | 24d | 1 | 1.23mi |
| 900 W Olympic Blvd Los Angeles, CA | 1.0–3.0 | 2.0–4.0 | 2620 | $25,000 | $9.54 | 5d | 9 | 1.28mi |
| 900 W Olympic Blvd Los Angeles, CA | 1.0–3.0 | 2.0–4.0 | 2625 | $25,000 | $9.52 | 24d | 7 | 1.28mi |
| 1141 Irolo St Los Angeles, CA | 3.0 | 3.0 | 1649 | $4,000 | $2.43 | 43d | 1 | 1.28mi |
| 122 E 24th St Los Angeles, CA | 5.0 | 3.0 | 1819 | $4,200 | $2.31 | 43d | 1 | 1.29mi |
| 1133 S Hope St Los Angeles, CA | 4.0 | 1.0–3.0 | 1287 | $7,815 | $6.07 | 1d | 17 | 1.31mi |
| 1299 W 37th Dr Unit 1 Los Angeles, CA | 5.0 | 3.0 | 1800 | $5,600 | $3.11 | 43d | 1 | 1.33mi |
| 1206 S Harvard Blvd Los Angeles, CA | 3.0 | 3.0 | 1950 | $7,000 | $3.59 | 43d | 1 | 1.35mi |
Listing history 6 events
-
2026-06-18days on market $875,000 Active 7 DOM
-
2026-06-17days on market $875,000 Active 6 DOM
-
2026-06-16days on market $875,000 Active 5 DOM
-
2026-06-15days on market $875,000 Active 4 DOM
-
2026-06-13remarks 699-char remark
-
2026-06-13$875,000 Active 2 DOM
ⓘ Source: listings_history table (triggers on properties + properties_extension) + one-shot
backfill from property_details.listing_events for pre-trigger history.
Tax reassessment forecast CA · Resets to sale price
- Current annual tax
- $6,085 · $507/mo
- Projected year-2 tax
- $6,650 · $554/mo
- Expected delta
- +$565/yr (+$47/mo · 9.3%)
ⓘ Screening estimate from a state-policy table — verify with the county assessor before closing.
Climate risk First Street
- Flood 1/10 Low FEMA zone X (unshaded) · 0% chance over 30 yrs
- Wildfire 1/10 Low
- Heat 6/10 Major 7 d/yr ≥90°F today · 22 d/yr by 30 yrs out
- Wind 1/10 Low
- Air quality 5/10 Major 7 unhealthy d/yr today · 7 by 30 yrs out
Nearby sold comps map
Loading sold comps map…
Walkable amenities ~0.75 mi
Loading nearby amenities…
Taxation est. · year 1
- Rental income
- $111,492
- − Mortgage interest
- −$49,014
- − Property taxes
- −$6,085
- − Insurance
- −$4,375
- − Repairs & maintenance
- −$8,919
- − Management
- −$8,919
- − Depreciation
- −$25,455
- Taxable income
- $8,725
- Est. tax owed @ 24.0%
- −$2,094
- After-tax cash flow
- $20,461/yr
For passive investors: Depreciation is non-cash, so a rental often shows a tax loss while cash-flowing — sheltering income. Rental losses are passive: they offset passive income freely, and up to $25,000/yr can offset ordinary (W-2) income if you actively participate and your MAGI is under $100k (phasing out to $0 by $150k); unused losses carry forward. On sale, claimed depreciation is recaptured at up to 25%, and gains may owe capital-gains tax (a 1031 exchange can defer both). Figures are a year-1 estimate at your 24.0% rate — not tax advice; consult a CPA.
Schools (NCES district)
- District
- Los Angeles Unified
- NCES district ID
- 0622710
- Math proficiency
- 29% ▼ -4.00%
- Reading proficiency
- 54% ▲ 10.00%
- Median HH income
- $50,403
- Composite
- 35.67/100
- National rank
- #4875
- State rank
- #223 of 517 in CA
Livability — Los Angeles
- Score
- 68/100
- State rank
- #273
- US rank
- #9237
Category grades
Schools grade is shown separately in the Schools card above.
Census & demographics
- Census place
- Los Angeles, CA
- County
- Los Angeles County · 9,444,647 people
- City population
- 3,838,149
- Metro
- Los Angeles-Long Beach-Anaheim, CA
- Population (ZIP)
- 38,715
- Household income
- $35,378
- Rent vs Own
- Severe rent burden
- 4179.0
Population outlook (Los Angeles County) Hauer SSP2
- Today (2025)
- 10,940,515 people
- By 2030
- 11,256,481 · +2.9%
- By 2040
- 11,729,929 · +7.2%
- By 2050
- 11,948,407 · +9.2%
- By 2075
- 11,818,114 · +8.0%
- By 2100
- 10,842,928 · -0.9%
Race, ethnicity, and origin ACS 2023
- Neighborhood character
- Diverse neighborhood (Simpson 0.66)
- Race & ethnicity
- Hispanic / Latino 53% Asian 18% White 17% Two or more races 14% Black 8% Native American 1%
- Hispanic origin (detail)
- Mexican 29%
- Common ancestry
- Romanian 1% Scotch-Irish 1% Iranian 1%
- Foreign-born
- 41% · Canada, China, South Korea
- Languages at home
- 37% English-only · Spanish 45% Chinese 7% Other Indo-European 5%
Political lean MEDSL · Los Angeles
- 2024 margin
- Solid D (+32.9) · D 64.8% · R 31.9% · Other 3.3%
- 2008→2024 swing
- -7.4pp toward R · 2008: 40.4pp · 2024: 32.9pp
- All cycles
- 2024: D+32.9 2020: D+44.2 2016: D+48.0 2012: D+40.0 2008: D+40.4
Not yet ingested
- Civics
- —
Market trends
- HPI YoY
- ▼ -225.40%
- Current HPI
- 460.9539
- Rent YoY
- ▲ 5.88%
- Metro
- Los Angeles-Long Beach-Anaheim, CA
- State GDP YoY
- ▲ 3.21%
- F500 in state
- 116
Industry mix (Fortune 500 HQ in CA)
| Industry | F500 HQs | Revenue |
|---|---|---|
| Technology | 27 | $1,492B |
|
||
| Financial Services | 3 | $174B |
|
||
| Retail | 3 | $44B |
|
||
| Insurance | 3 | $26B |
|
||
| Media / Entertainment | 2 | $115B |
|
||
| Pharmaceuticals / Biotech | 2 | $62B |
|
||
Price history
+2087.5% since first listed11 events — show timeline
- 2026-06-11 Listed $875,000 CRMLS
- 2026-05-19 Sold (Public Records) $200,000 Public Records
- 2025-08-19 Listing Removed — CRMLS
- 2025-05-13 Price Changed $879,900 CRMLS
- 2025-03-17 Listed $939,900 CRMLS
- 2024-05-02 Relisted — TheMLS
- 2023-11-07 Listed — TheMLS
- 2003-11-25 Sold (Public Records) $330,000 Public Records
- 2003-11-25 Sold (MLS) $330,000 CRMLS
- 2002-11-03 Listed $324,500 CRMLS
- 1975-09-25 Sold (Public Records) $40,000 Public Records
Property tax history
+1.7%/yrLatest (2025): $6,085 · +1.4% YoY. Source: county tax records.
Cash-flow waterfall
monthlySold comps — $/sqft
last 12 mo · ≤1 miLoading sold comps…