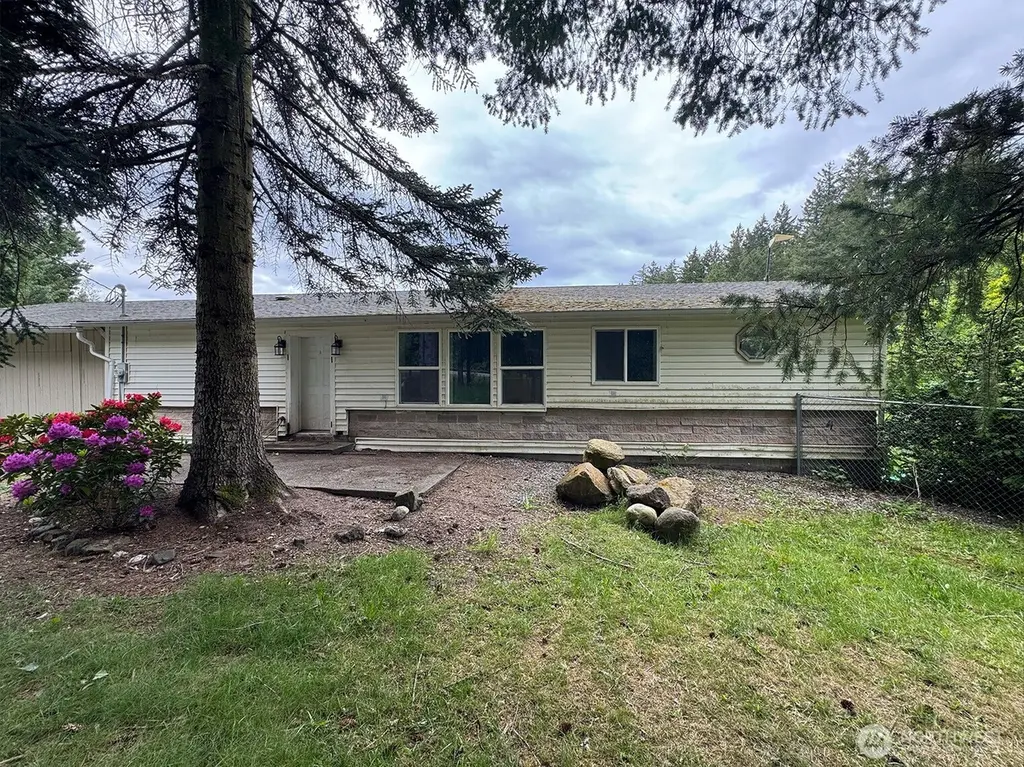
16491 E State Route 3 · Grapeview, WA
Flood risk 1/10 · Minimal
- FEMA flood zone
- X (unshaded)
- Chance of flooding over 30 yrs
- 0.0%
- Est. flood insurance / yr
- $473 – $860
Fire risk 3/10 · Minor
- Est. fire insurance / yr
- $604 – $1,122
Heat risk 3/10 · Minor
- Hot days now (above 87°F)
- 7 days/yr
- Hot days in 30 yrs
- 14 days/yr
Wind risk 1/10 · Minimal
- Chance of severe wind over 30 yrs
- —
Air-quality risk 6/10 · Moderate
- Unhealthy air days now
- 7 days/yr
- Unhealthy air days in 30 yrs
- 8 days/yr
Risk factors via First Street. Map © Google.
Why this score? — see what drove the D grade
The composite is a weighted blend of 9 inputs, each scored 0–100. Each bar is that input's sub-score; the figure is the points it added to the 100-point composite (weight × sub-score).
- ARV discount +15.0/15.0
- Cash flow +8.9/30.0
- Schools +5.0/10.0
- Livability +3.6/5.0
- DSCR +2.5/10.0
- Rent growth +2.5/5.0
- Condition / age +2.5/5.0
- 1% rule +1.7/10.0
- Appreciation +0.0/10.0
$355,000
🖨 Deal sheet 📄 Offer letter ✓ Due diligence
Listing remarks
5 acres, endless upside, priced to move. This 1,479 sq ft home is sold as-is. Bring your vision and your contractors. Finish the basement and you're looking at close to 3,000 sq ft of living space. The land has fruit trees, garden space, outbuildings, and room for an RV, boat, or equipment storage. Investors, builders, and owner-occupants with a vision, this is for you. Properties with this much land and this much upside don't sit long.
Key facts
- Outbuildings
- 5 acres
- Room for rv
Tags
Property features AI
Finance
- Financial info: Accepts Cash, Conventional, and Rehab Loan terms
Exterior
- Parking: Attached carport; Detached carport; Driveway; 2 covered parking spaces
- Utilities: Individual well water; Septic tank sewer; Electric power
- Home design: Single-family house; One level (1 story) with basement
- Construction: Metal/vinyl and wood construction
- Exterior features: Metal/vinyl and wood exterior; Wood products; Composition roof
Interior
- Bedrooms: 2 bedrooms (both on the main level)
- Bathrooms: 1 full bath and 1 three-quarter bath (both on the main level); 1 bathtub, 2 showers
- Heating & cooling: Baseboard heating; Forced air cooling; Electric energy source
- Interior features: Built on lot; Baseboard heating and forced air cooling
Neighborhood map
What this means for you Summary
Snapshot
- This is a 2-bed/2.0-bath single-family listed at $355k.
Deal economics
- At list price, monthly cash flow is $-288 ($-3k/yr) — negative.
- To cash-flow at today's rent, offer at most $304k (14.3% below list).
- To meet the 1% rule (rent ≥ 1% of price), the offer needs to be $239k (32.6% below list).
- Recommended offer: $239k (32.6% below list) — sets the bar for 1% rule.
- Cap rate 5.3% vs local median 1.9% in Grapeview — top-decile yield for the area; either an underpriced asset or a hidden risk that comps aren't pricing in. Stress-test before assuming the spread holds.
Location & tenants
- Location reads 71/100 on livability (#235 in WA) — a middle-class / working-renter tenant base. Strengths: employment A+, housing A+, health & safety A+; Watch: cost of living D+, amenities F, commute F.
- Grapeview School District (rural): math 50% / reading 60% proficiency, ranked #90 of 291 in WA (top 31%) — acceptable for families but not a draw, mixed tenant base, ~2y average lease.
- Market conditions: 91 active listings in the ZIP; 299 units permitted in Mason County in 2024 (0 in 5+ unit buildings).
Forward outlook
- Local home prices are declining (-3.0%/yr); year-one equity from $2k of loan paydown is wiped out by about $11k of value loss. Plan a longer hold.
- Mason County population projected at -14% by 2050 — secular population decline; favor cash flow + early exit over multi-decade hold.
Negotiation context
- It's been on market 34 days — a 3% lower offer ($344k) is reasonable based on typical stale-listing flexibility.
- 4 sale attempts since 19y ago with the ask held roughly flat each time — persistent listings suggest the price (not the market) is what's stuck; bring a comps-based counter.
- Current owner paid $300k; 18% above their basis — modest negotiation headroom, anchor on the comps not their cost.
Questions for the listing agent
- What do current leases actually rent for vs. the listed asking? Can we see a recent rent roll and the last 12 months of T-12 income?
- It's been on market 34 days. Have you received any prior offers? Is the seller open to a 33% concession, seller financing, or rate buy-down credit?
- Built in 1961 — when were the roof, HVAC, electrical panel, plumbing, and water heater last replaced?
- Is there a deadline driving the sale (1031 exchange, divorce, estate, relocation)? That informs how much negotiation room exists.
- The area grade is low — what's the realistic commute time and amenity access for the typical tenant pool here? Any planned neighborhood developments (good or bad) we should know about?
- What's the average days-on-market for RENTAL listings here right now (not sales)? A rising rental-DOM trend means longer vacancies and softer asking-rent achievability than the comps imply.
- What's the recent tenant-quality profile in this submarket — average credit score on applications, eviction rate, late-payment / NSF rate, and stable-employment percentage? A property-management company in the area should have these aggregated.
- How much new for-sale + rental construction is in the pipeline within 1–3 miles? Heavy new supply typically softens prices + rents 12–24 months out; constrained supply supports both.
Investment metrics
- 1% rule
- 0.67% ✗
- Cap rate
- 5.32%
- Cash-on-cash
- -3.48%
- DSCR
- 0.85
- GRM
- 12.4
CMA / ARV
- ARV (median comp)
- $569,418
- List price
- $355,000
- Delta
- -37.66%
- Verdict
- UNDERPRICED
- Comps
- 5 within 1.0 mi
Projected returns pro-forma
-3.0% appreciation · 3.0% rent growth · sell at horizon
- IRR
- -22.2%
- Equity multiple
- 0.24×
- Total profit
- $-76,008
- Equity at exit
- $52,932
- IRR
- -16.3%
- Equity multiple
- 0.09×
- Total profit
- $-90,352
- Equity at exit
- $30,694
Cash invested: $99,400 (down + closing). Projections, not guarantees.
Landlord ↔ Tenant lean methodology
- Overall (STATE)
- 28 Tenant-Leaning
- State Washington
- 28 Tenant-Leaning · D+8
- County
- — inherits STATE
- City
- — inherits STATE
ZIP-level market 98524
- Active inventory
- 91
- Price-to-rent
- 12.4×
Monthly cashflow live
- Estimated rent
- $2,394 medium interval (Pro) →
- Mortgage (P&I)
- −$1,862
- Tax from tax record
- −$170 /mo · $2,037/yr
- Insurance
- −$148
- HOA
- −$0
- Vacancy / Maint / Mgmt
- −$503
- Net cashflow
- $-288
Break-even live
UW: 25.0% down · 7.5% · 30yr · 1.5% tax · 5.0% vac · 8.0% maint · 8.0% mgmt
Financing live
Cash to close
- Down payment
- $88,750
- Closing costs
- $10,650
- Reserves months
- —
- Total cash needed
- —
Loan-product check · same deal, 3 products live
Conventional
25% down · 7.5% · 30yr
- Down + closing
- —
- Monthly P&I
- —
- Monthly cashflow
- —
- DSCR
- —
- Eligible?
- —
Personal DTI + credit; lowest rate.
DSCR
20% down · 8.5% · 30yr
- Down + closing
- —
- Monthly P&I
- —
- Monthly cashflow
- —
- DSCR
- —
- Eligible?
- —
No personal income docs; deal must DSCR.
Hard money
10% down · 12.0% · 12mo
- Down + closing
- —
- Monthly P&I
- —
- Monthly cashflow
- —
- DSCR
- —
- Eligible?
- —
Short-term bridge; refi at stabilization.
Listing history 28 events
-
2026-06-17status $355,000 Pending 34 DOM
-
2026-06-17days on market $355,000 Active 34 DOM
-
2026-06-16days on market $355,000 Active 33 DOM
-
2026-06-15days on market $355,000 Active 32 DOM
-
2026-06-14days on market $355,000 Active 30 DOM
-
2026-06-12days on market $355,000 Active 29 DOM
-
2026-06-09days on market $355,000 Active 26 DOM
-
2026-06-09price $355,000 Active 25 DOM
-
2026-06-08days on market $365,000 Active 25 DOM
-
2026-06-07days on market $365,000 Active 24 DOM
-
2026-06-05days on market $365,000 Active 21 DOM
-
2026-06-03days on market $365,000 Active 20 DOM
-
2026-06-02days on market $365,000 Active 19 DOM
-
2026-06-01days on market $365,000 Active 18 DOM
-
2026-05-31days on market $365,000 Active 17 DOM
-
2026-05-30days on market $365,000 Active 16 DOM
-
2026-05-14$365,000 Active
-
2021-01-08soldstatus $300,000 Sold
-
2021-01-08soldstatus $4,800
-
2020-12-03status Pending
-
2020-11-25price $300,000
-
2020-11-16status Active
-
2020-11-09status Pending Inspection
-
2020-11-04$349,000 Active
-
2007-11-19soldstatus $143,300
-
2007-11-19soldstatus $143,300
-
2007-09-20historical
-
2007-08-16$139,000
ⓘ Source: listings_history table (triggers on properties + properties_extension) + one-shot
backfill from property_details.listing_events for pre-trigger history.
Tax reassessment forecast WA · Resets to sale price
- Current annual tax
- $2,037 · $170/mo
- Projected year-2 tax
- $3,479 · $290/mo
- Expected delta
- +$1,442/yr (+$120/mo · 70.8%)
ⓘ Screening estimate from a state-policy table — verify with the county assessor before closing.
Climate risk First Street
- Flood 1/10 Low FEMA zone X (unshaded) · 0% chance over 30 yrs
- Wildfire 3/10 Moderate
- Heat 3/10 Moderate 7 d/yr ≥87°F today · 14 d/yr by 30 yrs out
- Wind 1/10 Low
- Air quality 6/10 Major 7 unhealthy d/yr today · 8 by 30 yrs out
Nearby sold comps map
Loading sold comps map…
Walkable amenities ~0.75 mi
Loading nearby amenities…
Taxation est. · year 1
- Rental income
- $28,728
- − Mortgage interest
- −$19,886
- − Property taxes
- −$2,037
- − Insurance
- −$1,775
- − Repairs & maintenance
- −$2,298
- − Management
- −$2,298
- − Depreciation
- −$10,327
- Taxable loss
- −$9,894
- Est. tax savings @ 24.0%
- +$2,375
- After-tax cash flow
- $-1,083/yr
For passive investors: Depreciation is non-cash, so a rental often shows a tax loss while cash-flowing — sheltering income. Rental losses are passive: they offset passive income freely, and up to $25,000/yr can offset ordinary (W-2) income if you actively participate and your MAGI is under $100k (phasing out to $0 by $150k); unused losses carry forward. On sale, claimed depreciation is recaptured at up to 25%, and gains may owe capital-gains tax (a 1031 exchange can defer both). Figures are a year-1 estimate at your 24.0% rate — not tax advice; consult a CPA.
Schools (NCES district)
- District
- Grapeview School District
- NCES district ID
- 5303240
- Math proficiency
- 50% ▬ 0.00%
- Reading proficiency
- 60% ▼ -10.00%
- Median HH income
- $63,697
- Composite
- 50.03/100
- National rank
- #4132
- State rank
- #90 of 291 in WA
Livability — Grapeview
- Score
- 71/100
- State rank
- #235
- US rank
- #7201
Category grades
Schools grade is shown separately in the Schools card above.
Census & demographics
- Population (ZIP)
- 4,585
Population outlook (Mason County) Hauer SSP2
- Today (2025)
- 60,005 people
- By 2030
- 58,567 · -2.4%
- By 2040
- 54,735 · -8.8%
- By 2050
- 51,470 · -14.2%
- By 2075
- 46,276 · -22.9%
- By 2100
- 39,883 · -33.5%
Race, ethnicity, and origin ACS 2023
- Neighborhood character
- Predominantly White (84%)
- Race & ethnicity
- White 84% Two or more races 11% Hispanic / Latino 10% Asian 1%
- Hispanic origin (detail)
- Mexican 3% Puerto Rican 1%
- Common ancestry
- Italian 10% Slovak 9% Portuguese 4%
- Foreign-born
- 5% · Canada, Jamaica
- Languages at home
- 93% English-only · Spanish 4% German/W. Germanic 1% Tagalog/Filipino 1%
Political lean MEDSL · Mason
- 2024 margin
- Toss-up / Even · D 47.2% · R 49.7% · Other 3.2%
- 2008→2024 swing
- -11.2pp toward R · 2008: 8.7pp · 2024: -2.5pp
- All cycles
- 2024: R+2.5 2020: R+3.9 2016: R+6.0 2012: D+6.9 2008: D+8.7
Not yet ingested
- Civics
- —
Market trends
- HPI YoY
- ▼ -154.76%
- Current HPI
- 183.7245
- Rent YoY
- —
- Metro
- —
- State GDP YoY
- ▲ 4.65%
- F500 in state
- 22
Industry mix (Fortune 500 HQ in WA)
| Industry | F500 HQs | Revenue |
|---|---|---|
| Retail | 2 | $269B |
|
||
| Technology / Retail | 1 | $638B |
|
||
| Technology | 1 | $245B |
|
||
| Telecommunications | 1 | $38B |
|
||
| Food / Beverage | 1 | $36B |
|
||
| Automotive / Trucks | 1 | $34B |
|
||
Price history
+155.4% since first listed14 events — show timeline
- 2026-06-17 Pending — NWMLS as Distributed by MLS Grid
- 2026-06-08 Price Changed $355,000 NWMLS as Distributed by MLS Grid
- 2026-05-14 Listed $365,000 NWMLS as Distributed by MLS Grid
- 2021-01-08 Sold (Public Records) $4,800 Public Records
- 2021-01-08 Sold (MLS) $300,000 NWMLS as Distributed by MLS Grid
- 2020-12-03 Pending — NWMLS as Distributed by MLS Grid
- 2020-11-25 Price Changed $300,000 NWMLS as Distributed by MLS Grid
- 2020-11-16 Relisted — NWMLS as Distributed by MLS Grid
- 2020-11-09 Pending — NWMLS as Distributed by MLS Grid
- 2020-11-04 Listed $349,000 NWMLS as Distributed by MLS Grid
- 2007-11-19 Sold (Public Records) $143,300 Public Records
- 2007-11-19 Sold (MLS) $143,300 NWMLS as Distributed by MLS Grid
- 2007-09-20 Delisted — NWMLS as Distributed by MLS Grid
- 2007-08-16 Listed $139,000 NWMLS as Distributed by MLS Grid
Property tax history
+2.3%/yrLatest (2026): $2,037 · -1.7% YoY. Source: county tax records.
Cash-flow waterfall
monthlySold comps — $/sqft
last 12 mo · ≤1 miLoading sold comps…