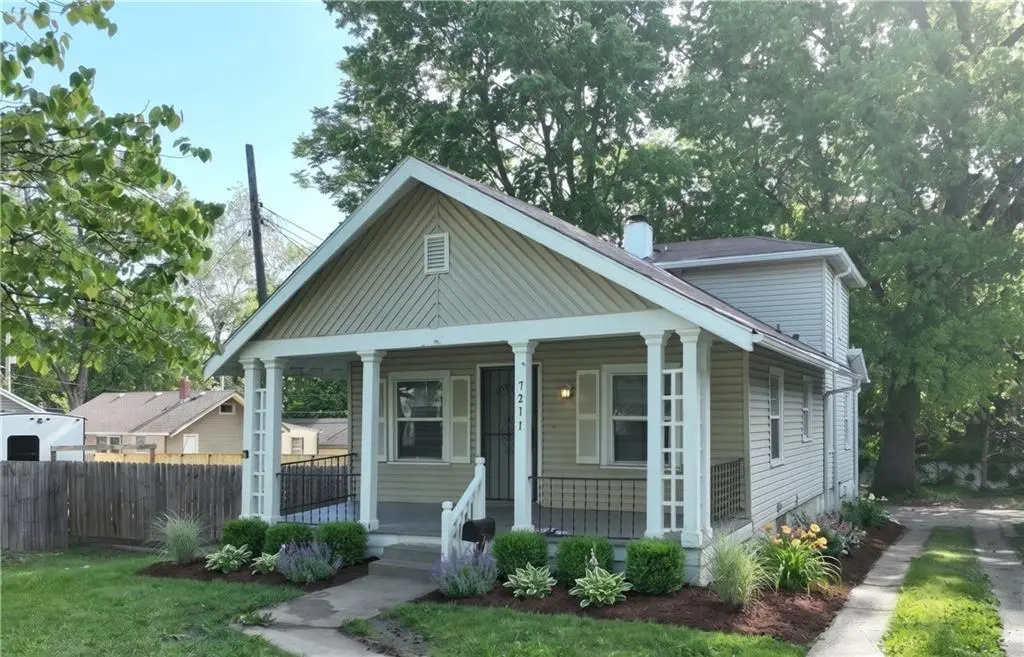
7211 Lydia Ave · Kansas City, MO
Flood risk 1/10 · Minimal
- FEMA flood zone
- X (unshaded)
- Chance of flooding over 30 yrs
- 0.0%
- Est. flood insurance / yr
- $473 – $860
Fire risk 1/10 · Minimal
- Est. fire insurance / yr
- $1,054 – $1,958
Heat risk 4/10 · Minor
- Hot days now (above 106°F)
- 7 days/yr
- Hot days in 30 yrs
- 17 days/yr
Wind risk 2/10 · Minimal
- Chance of severe wind over 30 yrs
- —
Air-quality risk 3/10 · Minor
- Unhealthy air days now
- 2 days/yr
- Unhealthy air days in 30 yrs
- 4 days/yr
Risk factors via First Street. Map © Google.
Why this score? — see what drove the D grade
The composite is a weighted blend of 9 inputs, each scored 0–100. Each bar is that input's sub-score; the figure is the points it added to the 100-point composite (weight × sub-score).
- Cash flow +18.4/30.0
- DSCR +5.8/10.0
- ARV discount +5.5/15.0
- Livability +3.9/5.0
- 1% rule +3.7/10.0
- Rent growth +3.5/5.0
- Condition / age +2.5/5.0
- Schools +1.5/10.0
- Appreciation +0.0/10.0
$160,000
🖨 Deal sheet (PDF) 📄 Offer letter ✓ Due diligence
Listing remarks MLS
Charming bungalow under $200K—perfect starter home or investment opportunity - Charming, updated, and priced to move! This 1.5-story bungalow features 3 bedrooms, fresh interior paint, and a bright, welcoming feel from the moment you walk in. With approximately 1,300 square feet, the home offers a functional layout and comfortable living spaces, plus an unfinished basement ready for storage or future possibilities. Perfect for first-time buyers or investors, this home delivers affordability and value in a convenient Kansas City location close to shopping, dining, and easy highway access. Opportunities like this don’t last—schedule your showing today!
Key facts
- 6,098 sq ft lot
- Garage
- Built 1923
Neighborhood map
What this means for you Summary
Snapshot
- This is a 3-bed/1.0-bath single-family listed at $160k.
Deal economics
- At list price, monthly cash flow is $149 ($2k/yr) — positive.
- The deal already cash-flows at list — no discount required.
- To meet the 1% rule (rent ≥ 1% of price), the offer needs to be $139k (12.8% below list).
- Recommended offer: $139k (12.8% below list) — sets the bar for 1% rule.
- Cap rate 7.4% vs local median 3.9% in Kansas City — top-decile yield for the area; either an underpriced asset or a hidden risk that comps aren't pricing in. Stress-test before assuming the spread holds.
Location & tenants
- Location reads 78/100 on livability (#28 in MO, #2,671 nationally) — a middle-class / working-renter tenant base. Strengths: amenities A+, commute A+, cost of living A+; Watch: crime F.
- Kansas City 33 (urban): math 12% / reading 24% proficiency, ranked #308 of 324 in MO (top 95%) — low school quality limits family demand, transient renter base, plan for 1-2y turnover; 75% free/reduced lunch — lower-income household profile, screen leases tightly.
- Zoned schools: Ac Prep Elementary (math 12% / reading 27%, grade F, #941 of 1,115 statewide, top 86%, 341 students, 99% FRL); Central Middle School (math 0% / reading 9%, grade F, #388 of 391 statewide, top 99%, 428 students, 99% FRL); Southeast High School (math 2% / reading 12%, grade F, #512 of 521 statewide, top 99%, 487 students, 99% FRL) — zoned schools average 99% FRL vs 75% district-wide (24 pts higher); higher-poverty schools than district average — tighter screening recommended.
- Market conditions: Rents rising (+4.0%/yr); 133 active listings in the ZIP; 40 comparable units currently listed for rent nearby; rentals at typical pace (median 18d on market — plan ~3-4 weeks tenant-placement turnaround); 4,002 units permitted in Jackson County in 2024 (2,271 in 5+ unit buildings).
Forward outlook
- Local home prices are declining (-3.0%/yr); year-one equity from $1k of loan paydown is wiped out by about $5k of value loss. Plan a longer hold.
- Jackson County population projected at +4% by 2050 — modest demand growth; plan on rents tracking national, not racing it.
Negotiation context
- It's been on market 105 days — a 9% lower offer ($146k) is reasonable based on typical stale-listing flexibility.
- 7 sale attempts since 27y ago; this cycle's ask has dropped $10k (6%) from the opening price — seller is motivated, your offer sets the floor, not the list.
Risks & watch-outs
- Watch-outs: built in 1923 — expect roof / HVAC / electrical / plumbing capex.
Questions for the listing agent
- It's been on market 105 days. Have you received any prior offers? Is the seller open to a 13% concession, seller financing, or rate buy-down credit?
- Built in 1923 — when were the roof, HVAC, electrical panel, plumbing, and water heater last replaced?
- Why hasn't it sold? Are there any deal-killer items the seller is aware of (foundation, flood, title, zoning, code violations)?
- Is there a deadline driving the sale (1031 exchange, divorce, estate, relocation)? That informs how much negotiation room exists.
- Crime grade is F in this area — have there been break-ins, vandalism, or insurance claims at this property in the last 3 years? What carrier currently insures it and at what premium?
- The area grade is low — what's the realistic commute time and amenity access for the typical tenant pool here? Any planned neighborhood developments (good or bad) we should know about?
- What's the average days-on-market for RENTAL listings here right now (not sales)? A rising rental-DOM trend means longer vacancies and softer asking-rent achievability than the comps imply.
- What's the recent tenant-quality profile in this submarket — average credit score on applications, eviction rate, late-payment / NSF rate, and stable-employment percentage? A property-management company in the area should have these aggregated.
- How much new for-sale + rental construction is in the pipeline within 1–3 miles? Heavy new supply typically softens prices + rents 12–24 months out; constrained supply supports both.
Investment metrics
- 1% rule
- 0.87% ✗
- Cap rate
- 7.41%
- Cash-on-cash
- 3.98%
- DSCR
- 1.18
- GRM
- 9.6
CMA / ARV
- ARV (median comp)
- $153,118
- List price
- $160,000
- Delta
- 4.49%
- Verdict
- FAIR
- Comps
- 20 within 1.0 mi
Show comp detail 12 sales within ~0.75 mi
| Address | Dist | Beds/Ba | Sqft | Sold | Price | $/sf | Match |
|---|---|---|---|---|---|---|---|
| 7300 Tracy Ave | 0.19mi | 3/1.0 | 1,186 (+1%) | 3mo | $175,000 | $148 | 88 |
| 7104 Tracy Ave | 0.21mi | 4/1.0 (+1) | 1,188 (+1%) | 3mo | $115,000 | $97 | 82 |
| 7121 Woodland Ave | 0.27mi | 4/1.0 (+1) | 1,181 (+0%) | 3mo | $129,000 | $109 | 80 |
| 1321 E 76th St | 0.51mi | 3/1.0 | 1,192 (+1%) | 1mo | $210,000 | $176 | 74 |
| 936 E Gregory Blvd | 0.35mi | 2/1.5 (-1) | 1,184 (+0%) | 5mo | $189,900 | $160 | 72 |
| 7620 Paseo Blvd | 0.58mi | 3/2.0 | 1,196 (+2%) | 3mo | $130,000 | $109 | 64 |
| 7336 Olive St | 0.62mi | 3/1.0 | 1,232 (+5%) | 3mo | $77,000 | $63 | 61 |
| 710 E 73rd St | 0.48mi | 3/2.0 | 1,258 (+7%) | 6mo | $308,900 | $246 | 58 |
| 1421 E 77th St | 0.65mi | 3/1.5 | 1,087 (-8%) | 2mo | $205,000 | $189 | 53 |
| 1518 E 76th St | 0.48mi | 2/1.0 (-1) | 1,039 (-12%) | 2mo | $185,000 | $178 | 52 |
| 1137 E 76th Ter | 0.59mi | 3/1.5 | 1,334 (+13%) | 3mo | $170,000 | $127 | 46 |
| 1187 E 77th Ter E | 0.72mi | 3/1.0 | 1,337 (+14%) | 6mo | $135,000 | $101 | 39 |
Match score weights: distance 35% · size 25% · config 20% · recency 20%. Top-matched comps best support the ARV.
Projected returns pro-forma
-3.0% appreciation · 3.97% rent growth · sell at horizon
- IRR
- -9.2%
- Equity multiple
- 0.66×
- Total profit
- $-15,166
- Equity at exit
- $23,857
- IRR
- 1.3%
- Equity multiple
- 1.10×
- Total profit
- $4,430
- Equity at exit
- $13,834
Cash invested: $44,800 (down + closing). Projections, not guarantees.
Landlord ↔ Tenant lean methodology
- Overall (STATE)
- 81 Strongly Landlord-Friendly
- State Missouri
- 81 Strongly Landlord-Friendly · R+10
- County
- — inherits STATE
- City
- — inherits STATE
ZIP-level market 64131
- Rents YoY
- 4.0%
- Active inventory
- 133
- Price-to-rent
- 9.6×
Monthly cashflow live
- Estimated rent
- $1,395 high interval (Pro) →
- Mortgage (P&I)
- −$839
- Tax from tax record
- −$47 /mo · $569/yr
- Insurance
- −$67
- HOA
- −$0
- Vacancy / Maint / Mgmt
- −$293
- Net cashflow
- $149
Break-even live
Sensitivity live
| Price | -10% $239 | -5% $194 | +0% $149 | +5% $103 | +10% $58 |
|---|---|---|---|---|---|
| Rent | -10% $38 | -5% $93 | +0% $149 | +5% $204 | +10% $259 |
| Rate | -1.0pp $229 | -0.5pp $189 | base $149 | +0.5pp $107 | +1.0pp $65 |
UW: 25.0% down · 7.5% · 30yr · 1.5% tax · 5.0% vac · 8.0% maint · 8.0% mgmt
Financing live
Cash to close
- Down payment
- $40,000
- Closing costs
- $4,800
- Reserves months
- —
- Total cash needed
- —
Loan-product check · same deal, 3 products live
Conventional
25% down · 7.5% · 30yr
- Down + closing
- —
- Monthly P&I
- —
- Monthly cashflow
- —
- DSCR
- —
- Eligible?
- —
Personal DTI + credit; lowest rate.
DSCR
20% down · 8.5% · 30yr
- Down + closing
- —
- Monthly P&I
- —
- Monthly cashflow
- —
- DSCR
- —
- Eligible?
- —
No personal income docs; deal must DSCR.
Hard money
10% down · 12.0% · 12mo
- Down + closing
- —
- Monthly P&I
- —
- Monthly cashflow
- —
- DSCR
- —
- Eligible?
- —
Short-term bridge; refi at stabilization.
Rent comps 40 comps
| Address | Beds | Baths | Sqft | Rent | $/sqft | DOM | Units | Dist |
|---|---|---|---|---|---|---|---|---|
| 7427 Arleta Blvd Kansas City, MO | 2.0 | 1.0 | 805 | $1,150 | $1.43 | 45d | 1 | 0.46mi |
| 1850 E 68th Ter Kansas City, MO | 4.0 | 2.0 | 1400 | $1,600 | $1.14 | 18d | 1 | 0.63mi |
| 1831 E 68th St Kansas City, MO | 3.0 | 1.0 | 1043 | $1,250 | $1.20 | 18d | 1 | 0.63mi |
| 6653 Lydia Ave Kansas City, MO | 3.0 | 1.0 | 962 | $1,500 | $1.56 | 18d | 1 | 0.69mi |
| 1836 E 77th St Kansas City, MO | 2.0 | 1.0 | 1200 | $1,150 | $0.96 | 23d | 1 | 0.71mi |
| 2120 E 68th Ter Kansas City, MO | 2.0 | 1.0 | 930 | $1,200 | $1.29 | 25d | 1 | 0.71mi |
| 1805 E 67th St Kansas City, MO | 2.0 | 1.0 | 1064 | $1,200 | $1.13 | 18d | 1 | 0.72mi |
| 1435 E 66th Ter Kansas City, MO | 3.0 | 1.0 | 988 | $1,335 | $1.35 | 0d | 1 | 0.73mi |
| 2422 E 70th Ter Kansas City, MO | 2.0 | 1.0 | 748 | $1,356 | $1.81 | 14d | 1 | 0.76mi |
| 2607 E 73rd St Kansas City, MO | 2.0 | 1.0 | 1212 | $1,050 | $0.87 | 25d | 1 | 0.78mi |
| 7605 Locust St Kansas City, MO | 2.0 | 1.0 | 744 | $1,325 | $1.78 | 9d | 1 | 0.80mi |
| 1830 E 78th St Kansas City, MO | 3.0 | 1.0 | 1000 | $1,350 | $1.35 | 14d | 1 | 0.81mi |
| 7411 Montgall Ave Kansas City, MO | 3.0 | 1.0 | 840 | $1,200 | $1.43 | 45d | 1 | 0.87mi |
| 1861 E 78th St Kansas City, MO | 3.0 | 1.0 | 864 | $1,095 | $1.27 | 18d | 1 | 0.88mi |
| 2237 E 67th St Kansas City, MO | 4.0 | 1.0 | 1300 | $1,500 | $1.15 | 18d | 1 | 0.89mi |
| 2421 E 67th Ter Kansas City, MO | 2.0 | 1.0 | 816 | $1,125 | $1.38 | 18d | 1 | 0.91mi |
| 2430 E 67th Ter Kansas City, MO | 3.0 | 2.0 | 960 | $1,195 | $1.24 | 45d | 1 | 0.94mi |
| 6551 Rockhill Rd Kansas City, MO | 1.0–2.0 | 1.0–2.0 | 888 | $1,978 | $2.23 | 0d | 9 | 0.94mi |
| 7022 S Benton Ave Kansas City, MO | 3.0 | 1.5 | 1100 | $1,095 | $1.00 | 16d | 1 | 0.96mi |
| 6518 Rockhill Rd Kansas City, MO | 2.0 | 1.0 | 900 | $2,090 | $2.32 | 45d | 1 | 0.96mi |
| 6512 Rockhill Rd Kansas City, MO | 2.0 | 1.0 | 900 | $1,990 | $2.21 | 0d | 1 | 0.98mi |
| 7240 Agnes Ave Kansas City, MO | 3.0 | 1.0 | 1140 | $1,350 | $1.18 | 4d | 1 | 0.99mi |
| 7133 Agnes Ave Kansas City, MO | 3.0 | 2.0 | 1100 | $1,590 | $1.45 | 0d | 1 | 1.02mi |
| 6404 The Paseo Kansas City, MO | 1.0–2.0 | 1.0–2.0 | 942 | $1,600 | $1.70 | 4d | 6 | 1.02mi |
| 7317 Agnes Ave Kansas City, MO | 2.0 | 1.0 | 767 | $895 | $1.17 | 25d | 1 | 1.03mi |
| 7036 Bellefontaine Ave Unit A Kansas City, MO | 2.0 | 1.0 | 810 | $1,200 | $1.48 | 4d | 1 | 1.07mi |
| 8101 Campbell St Kansas City, MO | 2.0 | 1.0 | 820 | $888 | $1.08 | 3d | 1 | 1.08mi |
| 7412 Bellefontaine Ave Unit A Kansas City, MO | 2.0 | 1.0 | 780 | $1,200 | $1.54 | 4d | 1 | 1.08mi |
| 7524 Baltimore Ave Kansas City, MO | 2.0 | 1.0 | 1000 | $1,300 | $1.30 | 18d | 1 | 1.13mi |
| 320 E 79th Ter Kansas City, MO | 3.0 | 1.0 | 1100 | $1,700 | $1.55 | 45d | 1 | 1.14mi |
| 3106 E 75th St Kansas City, MO | 3.0 | 1.5 | 985 | $1,225 | $1.24 | 23d | 1 | 1.14mi |
| 8150 Troost Ave Unit 53 Kansas City, MO | 2.0 | 1.0 | 900 | $1,200 | $1.33 | 45d | 1 | 1.15mi |
| 8222 Troost Ave Unit 8222-1 Kansas City, MO | 2.0 | 1.0 | 825 | $1,400 | $1.70 | 16d | 1 | 1.19mi |
| 8208 Troost Ave Unit 8218-3 Kansas City, MO | 2.0 | 1.0 | 750 | $1,345 | $1.79 | 45d | 1 | 1.19mi |
| 8208 Troost Ave Kansas City, MO | 1.0–2.0 | 1.0 | 761 | $1,395 | $1.83 | 9d | 2 | 1.20mi |
| 8226 Flora Ave Kansas City, MO | 2.0 | 1.0 | 862 | $1,200 | $1.39 | 5d | 1 | 1.22mi |
| 7426 Indiana Ave Kansas City, MO | 3.0 | 1.0 | 1100 | $1,400 | $1.27 | 45d | 1 | 1.27mi |
| 6812 College Ave Kansas City, MO | 4.0 | 2.0 | 1152 | $1,795 | $1.56 | 25d | 1 | 1.28mi |
| 662 E 63rd St Kansas City, MO | 2.0 | 2.0 | 951 | $1,655 | $1.74 | 46d | 1 | 1.29mi |
| 6703 Walrond Ave Kansas City, MO | 2.0 | 1.0 | 912 | $1,200 | $1.32 | 4d | 1 | 1.31mi |
Listing history 33 events
-
2026-06-21days on market $160,000 Active 105 DOM
-
2026-06-18days on market $160,000 Active 102 DOM
-
2026-06-17days on market $160,000 Active 101 DOM
-
2026-06-16days on market $160,000 Active 100 DOM
-
2026-06-15days on market $160,000 Active 99 DOM
-
2026-06-13days on market $160,000 Active 97 DOM
-
2026-06-09days on market $160,000 Active 93 DOM
-
2026-06-08days on market $160,000 Active 92 DOM
-
2026-06-07days on market $160,000 Active 91 DOM
-
2026-06-05days on market $160,000 Active 88 DOM
-
2026-06-03days on market $160,000 Active 87 DOM
-
2026-06-02days on market $160,000 Active 86 DOM
-
2026-06-01days on market $160,000 Active 85 DOM
-
2026-05-31days on market $160,000 Active 84 DOM
-
2026-03-02$170,000 Active 676-char remark
Show marketing remark (676 chars)
Charming bungalow under $200K—perfect starter home or investment opportunity - Charming, updated, and priced to move! This 1.5-story bungalow features 3 bedrooms, fresh interior paint, and a bright, welcoming feel from the moment you walk in. With approximately 1,300 square feet, the home offers a functional layout and comfortable living spaces, plus an unfinished basement ready for storage or future possibilities. Perfect for first-time buyers or investors, this home delivers affordability and value in a convenient Kansas City location close to shopping, dining, and easy highway access. Opportunities like this don’t last—schedule your showing today!
-
2022-05-17soldstatus
-
2021-10-01soldstatus
-
2016-10-18soldstatus
-
2016-10-14soldstatus Sold 341-char remark
Show marketing remark (341 chars)
Wonderful investment opportunity for someone seeking residual income!!! 1.5 story 3 Bedroom 1 bath bungalow that is very well kept. House is currently renting for $650.00 a month and the tenant would like to stay. This house is in a package of 6 or can be sold as a single as well. Check out MLS # 2011214, 2011369, 2011377, 2011866, 2011873
-
2016-09-22historical Contingent - Accepting Backup Offers 341-char remark
Show marketing remark (341 chars)
Wonderful investment opportunity for someone seeking residual income!!! 1.5 story 3 Bedroom 1 bath bungalow that is very well kept. House is currently renting for $650.00 a month and the tenant would like to stay. This house is in a package of 6 or can be sold as a single as well. Check out MLS # 2011214, 2011369, 2011377, 2011866, 2011873
-
2016-09-16$36,999 Active 341-char remark
Show marketing remark (341 chars)
Wonderful investment opportunity for someone seeking residual income!!! 1.5 story 3 Bedroom 1 bath bungalow that is very well kept. House is currently renting for $650.00 a month and the tenant would like to stay. This house is in a package of 6 or can be sold as a single as well. Check out MLS # 2011214, 2011369, 2011377, 2011866, 2011873
-
2011-06-08historical
-
2010-01-08$25,000
-
2009-12-30historical
-
2009-01-09historical
-
2009-01-09$25,000
-
2008-09-24historical
-
2008-09-17$68,000
-
2008-09-17$68,000
-
2005-12-27soldstatus
-
2000-03-28soldstatus
-
2000-03-22soldstatus
-
1999-12-21$31,900
ⓘ Source: listings_history table (triggers on properties + properties_extension) + one-shot
backfill from property_details.listing_events for pre-trigger history.
Tax reassessment forecast MO · Resets to sale price
- Current annual tax
- $569 · $47/mo
- Projected year-2 tax
- $1,552 · $129/mo
- Expected delta
- +$983/yr (+$82/mo · 172.8%)
ⓘ Screening estimate from a state-policy table — verify with the county assessor before closing.
Climate risk First Street
- Flood 1/10 Low FEMA zone X (unshaded) · 0% chance over 30 yrs
- Wildfire 1/10 Low
- Heat 4/10 Moderate 7 d/yr ≥106°F today · 17 d/yr by 30 yrs out
- Wind 2/10 Low
- Air quality 3/10 Moderate 2 unhealthy d/yr today · 4 by 30 yrs out
Nearby sold comps map
Loading sold comps map…
Walkable amenities ~0.75 mi
Loading nearby amenities…
Taxation est. · year 1
- Rental income
- $16,734
- − Mortgage interest
- −$8,962
- − Property taxes
- −$569
- − Insurance
- −$800
- − Repairs & maintenance
- −$1,339
- − Management
- −$1,339
- − Depreciation
- −$4,655
- Taxable loss
- −$929
- Est. tax savings @ 24.0%
- +$223
- After-tax cash flow
- $2,005/yr
For passive investors: Depreciation is non-cash, so a rental often shows a tax loss while cash-flowing — sheltering income. Rental losses are passive: they offset passive income freely, and up to $25,000/yr can offset ordinary (W-2) income if you actively participate and your MAGI is under $100k (phasing out to $0 by $150k); unused losses carry forward. On sale, claimed depreciation is recaptured at up to 25%, and gains may owe capital-gains tax (a 1031 exchange can defer both). Figures are a year-1 estimate at your 24.0% rate — not tax advice; consult a CPA.
Schools (NCES district)
- District
- Kansas City 33
- NCES district ID
- 2916400
- Math proficiency
- 12% ▼ -8.00%
- Reading proficiency
- 24% ▬ 0.00%
- Median HH income
- $35,227
- Composite
- 14.8/100
- National rank
- #9387
- State rank
- #308 of 324 in MO
Livability — Kansas City
- Score
- 78/100
- State rank
- #28
- US rank
- #2671
Category grades
Schools grade is shown separately in the Schools card above.
Census & demographics
- Census place
- Kansas City, MO
- County
- Jackson County · 687,798 people
- City population
- 439,467
- Metro
- Kansas City, MO-KS
- Population (ZIP)
- 21,942
- Household income
- $64,201
- Rent vs Own
- Severe rent burden
- 1249.0
Population outlook (Jackson County) Hauer SSP2
- Today (2025)
- 719,589 people
- By 2030
- 731,456 · +1.6%
- By 2040
- 746,689 · +3.8%
- By 2050
- 749,289 · +4.1%
- By 2075
- 736,227 · +2.3%
- By 2100
- 668,210 · -7.1%
Race, ethnicity, and origin ACS 2023
- Neighborhood character
- Diverse neighborhood (Simpson 0.61)
- Race & ethnicity
- White 48% Black 39% Hispanic / Latino 7% Two or more races 7% Asian 1%
- Hispanic origin (detail)
- Mexican 3%
- Common ancestry
- Italian 5% Slovak 1% Lithuanian 1%
- Foreign-born
- 5% · Canada, Vietnam
- Languages at home
- 93% English-only · Spanish 3% French/Haitian/Cajun 1%
Political lean MEDSL · Jackson
- 2024 margin
- D (+19.3) · D 58.9% · R 39.5% · Other 1.6%
- 2008→2024 swing
- -6.1pp toward R · 2008: 25.4pp · 2024: 19.3pp
- All cycles
- 2024: D+19.3 2020: D+22.0 2016: D+16.6 2012: D+19.0 2008: D+25.4
Not yet ingested
- Civics
- —
Market trends
- HPI YoY
- ▼ -253.25%
- Current HPI
- 340.8202
- Rent YoY
- ▲ 3.97%
- Metro
- Kansas City, MO-KS
- State GDP YoY
- ▲ 1.84%
- F500 in state
- 20
Industry mix (Fortune 500 HQ in MO)
| Industry | F500 HQs | Revenue |
|---|---|---|
| Healthcare | 1 | $163B |
|
||
| Insurance | 1 | $21B |
|
||
| Industrial Technology | 1 | $17B |
|
||
| Retail | 1 | $16B |
|
||
| Industrial Distribution | 1 | $10B |
|
||
| Utilities | 1 | $9B |
|
||
Price history
+432.9% since first listed19 events — show timeline
- 2026-03-02 Listed $170,000 Heartland MLS as Distributed by MLS Grid
- 2022-05-17 Sold (Public Records) — Public Records
- 2021-10-01 Sold (Public Records) — Public Records
- 2016-10-18 Sold (Public Records) — Public Records
- 2016-10-14 Sold (MLS) — Heartland MLS as Distributed by MLS Grid
- 2016-09-22 Contingent — Heartland MLS as Distributed by MLS Grid
- 2016-09-16 Listed $36,999 Heartland MLS as Distributed by MLS Grid
- 2011-06-08 Listing Removed — Heartland MLS as Distributed by MLS Grid
- 2010-01-08 Listed $25,000 Heartland MLS as Distributed by MLS Grid
- 2009-12-30 Listing Removed — Heartland MLS as Distributed by MLS Grid
- 2009-01-09 Listed $25,000 Heartland MLS as Distributed by MLS Grid
- 2009-01-09 Listing Removed — Heartland MLS as Distributed by MLS Grid
- 2008-09-24 Listing Removed — Heartland MLS as Distributed by MLS Grid
- 2008-09-17 Listed $68,000 Heartland MLS as Distributed by MLS Grid
- 2008-09-17 Listed $68,000 Heartland MLS as Distributed by MLS Grid
- 2005-12-27 Sold (Public Records) — Public Records
- 2000-03-28 Sold (MLS) — Heartland MLS as Distributed by MLS Grid
- 2000-03-22 Sold (Public Records) — Public Records
- 1999-12-21 Listed $31,900 Heartland MLS as Distributed by MLS Grid
Property tax history
+5.6%/yrLatest (2025): $569 · -38.4% YoY. Source: county tax records.
Cash-flow waterfall
monthlySold comps — $/sqft
last 12 mo · ≤1 miLoading sold comps…