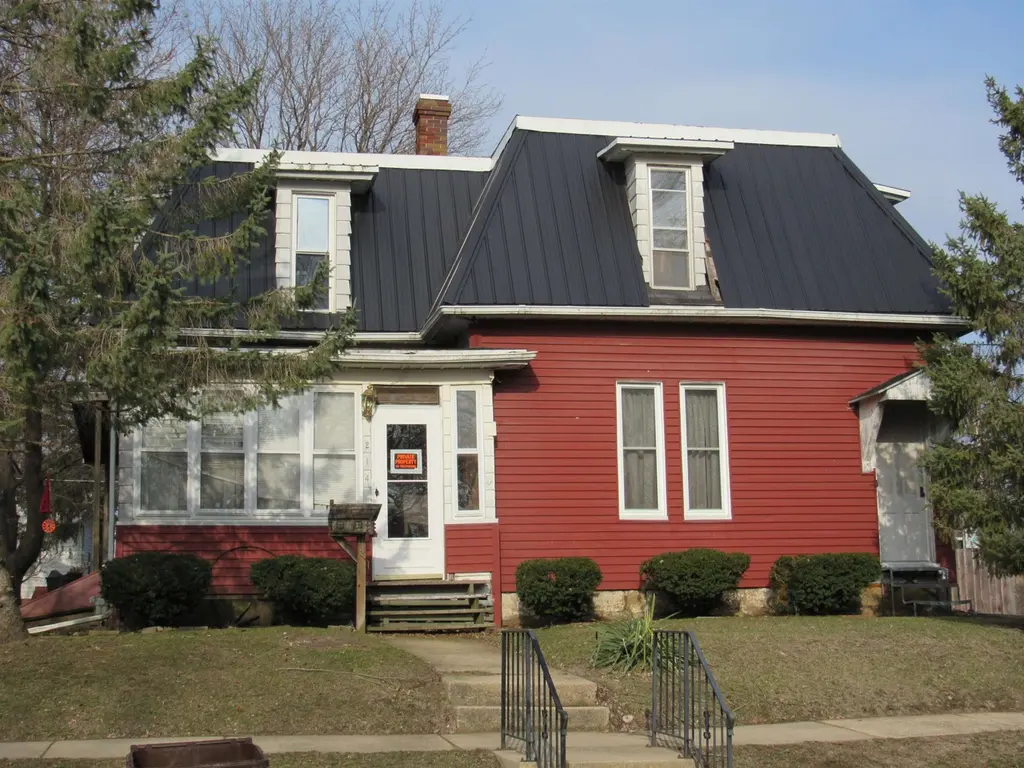
214 N Matteson St · Maquoketa, IA
Flood risk 1/10 · Minimal
- FEMA flood zone
- X (unshaded)
- Chance of flooding over 30 yrs
- 0.0%
- Est. flood insurance / yr
- $473 – $860
Fire risk 4/10 · Minor
- Est. fire insurance / yr
- $902 – $1,676
Heat risk 3/10 · Minor
- Hot days now (above 103°F)
- 7 days/yr
- Hot days in 30 yrs
- 15 days/yr
Wind risk 2/10 · Minimal
- Chance of severe wind over 30 yrs
- —
Air-quality risk 2/10 · Minimal
- Unhealthy air days now
- 2 days/yr
- Unhealthy air days in 30 yrs
- 2 days/yr
Risk factors via First Street. Map © Google.
Why this score? — see what drove the B grade
The composite is a weighted blend of 9 inputs, each scored 0–100. Each bar is that input's sub-score; the figure is the points it added to the 100-point composite (weight × sub-score).
- Cash flow +30.0/30.0
- 1% rule +10.0/10.0
- DSCR +10.0/10.0
- ARV discount +7.5/15.0
- Schools +4.6/10.0
- Livability +3.5/5.0
- Rent growth +2.5/5.0
- Condition / age +2.5/5.0
- Appreciation +0.0/10.0
$55,000
🖨 Deal sheet 📄 Offer letter ✓ Due diligence
Listing remarks MLS
3 bedroom, 2 bath home on double corner lot. Has newer furnace and water heater and many windows replaced . Has alley access and a one car garage and another storage building. Home does need TLC and is being sold in as-is condition.
Key facts
- Garage
- Built 1880
Property features AI
Exterior
- Parking: Detached parking
- Utilities: Public water; Public sewer
- Home design: Single-family detached residence; One and one-half stories; Stone foundation
- Construction: Stone foundation; Shingle roof
- Exterior features: Shingle roof; Lot roughly 109 x 125
Interior
- Kitchen: Other appliances
- Bedrooms: One main-level bedroom
- Bathrooms: Two full bathrooms; One main-level bathroom
- Heating & cooling: Forced air heating (natural gas); No central cooling
- Interior features: Window treatments; No fireplace; Partial basement
- Laundry & utility: Laundry on main level
Neighborhood map
What this means for you Summary
Snapshot
- This is a 3-bed/2.0-bath single-family listed at $55k.
Deal economics
- At list price, monthly cash flow is $456 ($5k/yr) — positive.
- The deal already cash-flows at list — no discount required.
- Meets the 1% rule at list price ($1k rent vs $55k).
Location & tenants
- Location reads 70/100 on livability (#362 in IA) — a middle-class / working-renter tenant base. Strengths: cost of living A+, housing A+, health & safety A+; Watch: amenities F, commute F, employment D-.
- Maquoketa Community School District (town): math 52% / reading 57% proficiency, ranked #270 of 289 in IA (top 93%) — acceptable for families but not a draw, mixed tenant base, ~2y average lease.
- Zoned schools: Maquoketa Community High School (math 63% / reading 68%, grade B, #204 of 336 statewide, top 61%, 498 students, 48% FRL) — zoned schools at 48% FRL track the district average.
- Market conditions: 35 active listings in the ZIP; 20 units permitted in Jackson County in 2024 (0 in 5+ unit buildings).
Forward outlook
- Local home prices are declining (-3.0%/yr); year-one equity from $380 of loan paydown is wiped out by about $2k of value loss. Plan a longer hold.
- Jackson County population projected at -15% by 2050 — secular population decline; favor cash flow + early exit over multi-decade hold.
- At projected returns (-3.0% appreciation + 3.0% rent growth), your $15k cash investment doubles in ~4 years — after that, you're playing with house money.
Negotiation context
- Only 1 days on market — expect competitive offers; lowballing is unlikely to land.
- 3 sale attempts since 3y ago with the ask held roughly flat each time — persistent listings suggest the price (not the market) is what's stuck; bring a comps-based counter.
- Current owner paid $32k; list at $55k implies a 69% gain — meaningful room to come down on a strong offer.
Risks & watch-outs
- Watch-outs: built in 1880 — expect roof / HVAC / electrical / plumbing capex.
Questions for the listing agent
- Built in 1880 — when were the roof, HVAC, electrical panel, plumbing, and water heater last replaced?
- Is there a deadline driving the sale (1031 exchange, divorce, estate, relocation)? That informs how much negotiation room exists.
- Schools are B-rated — typically a magnet for longer-tenancy family renters. What's the average tenant stay here, and is there a school-zone premium baked into asking?
- What's the average days-on-market for RENTAL listings here right now (not sales)? A rising rental-DOM trend means longer vacancies and softer asking-rent achievability than the comps imply.
- What's the recent tenant-quality profile in this submarket — average credit score on applications, eviction rate, late-payment / NSF rate, and stable-employment percentage? A property-management company in the area should have these aggregated.
- How much new for-sale + rental construction is in the pipeline within 1–3 miles? Heavy new supply typically softens prices + rents 12–24 months out; constrained supply supports both.
Investment metrics
- 1% rule
- 1.93% ✓
- Cap rate
- 16.25%
- Cash-on-cash
- 35.55%
- DSCR
- 2.58
- GRM
- 4.3
CMA / ARV
- ARV (on-the-fly)
- $160,375
- Comps found
- 12
Show comp detail 12 sales within ~0.75 mi
| Address | Dist | Beds/Ba | Sqft | Sold | Price | $/sf | Match |
|---|---|---|---|---|---|---|---|
| 510 Butternut St | 0.35mi | 3/2.0 | 1,295 (+1%) | 6mo | $120,000 | $93 | 76 |
| 411 Butternut St | 0.32mi | 2/1.5 (-1) | 1,279 (-0%) | 13mo | $179,000 | $140 | 67 |
| 317 W Pleasant St | 0.54mi | 2/1.0 (-1) | 1,279 (-0%) | 1mo | $155,000 | $121 | 64 |
| 507 W Quarry St | 0.53mi | 3/2.0 | 1,234 (-4%) | 9mo | $151,500 | $123 | 61 |
| 105 S Vermont St | 0.67mi | 3/1.0 | 1,298 (+1%) | 3mo | $139,900 | $108 | 61 |
| 309 N Olive St | 0.18mi | 2/1.0 (-1) | 1,200 (-6%) | 17mo | $15,000 | $13 | 58 |
| 1010 Kathey Dr | 0.36mi | 3/1.0 | 1,150 (-10%) | 8mo | $165,000 | $143 | 55 |
| 316 N Decker St | 0.43mi | 3/1.5 | 1,104 (-14%) | 3mo | $139,000 | $126 | 52 |
| 306 S Otto St | 0.44mi | 3/1.5 | 1,394 (+9%) | 15mo | $138,000 | $99 | 51 |
| 306 S Eliza St | 0.44mi | 3/1.0 | 1,120 (-13%) | 7mo | $140,000 | $125 | 48 |
| 505 Shoreline Dr | 0.55mi | 3/2.5 | 1,385 (+8%) | 17mo | $235,000 | $170 | 45 |
| 205 S Vermont St | 0.72mi | 3/1.5 | 1,128 (-12%) | 17mo | $185,000 | $164 | 30 |
Match score weights: distance 35% · size 25% · config 20% · recency 20%. Top-matched comps best support the ARV.
Projected returns pro-forma
-3.0% appreciation · 3.0% rent growth · sell at horizon
- IRR
- 31.2%
- Equity multiple
- 2.31×
- Total profit
- $20,161
- Equity at exit
- $8,201
- IRR
- 38.4%
- Equity multiple
- 4.57×
- Total profit
- $55,041
- Equity at exit
- $4,755
Cash invested: $15,400 (down + closing). Projections, not guarantees.
Landlord ↔ Tenant lean methodology
- Overall (STATE)
- 83 Strongly Landlord-Friendly
- State Iowa
- 83 Strongly Landlord-Friendly · R+6
- County
- — inherits STATE
- City
- — inherits STATE
ZIP-level market 52060
- Home prices YoY
- -21.2%
- Active inventory
- 35
- Price-to-rent
- 4.3×
Monthly cashflow live
- Estimated rent
- $1,062 medium interval (Pro) →
- Mortgage (P&I)
- −$288
- Tax from tax record
- −$72 /mo · $862/yr
- Insurance
- −$23
- HOA
- −$0
- Vacancy / Maint / Mgmt
- −$223
- Net cashflow
- $456
Break-even live
UW: 25.0% down · 7.5% · 30yr · 1.5% tax · 5.0% vac · 8.0% maint · 8.0% mgmt
Financing live
Cash to close
- Down payment
- $13,750
- Closing costs
- $1,650
- Reserves months
- —
- Total cash needed
- —
Loan-product check · same deal, 3 products live
Conventional
25% down · 7.5% · 30yr
- Down + closing
- —
- Monthly P&I
- —
- Monthly cashflow
- —
- DSCR
- —
- Eligible?
- —
Personal DTI + credit; lowest rate.
DSCR
20% down · 8.5% · 30yr
- Down + closing
- —
- Monthly P&I
- —
- Monthly cashflow
- —
- DSCR
- —
- Eligible?
- —
No personal income docs; deal must DSCR.
Hard money
10% down · 12.0% · 12mo
- Down + closing
- —
- Monthly P&I
- —
- Monthly cashflow
- —
- DSCR
- —
- Eligible?
- —
Short-term bridge; refi at stabilization.
Listing history 2 events
-
2026-06-07remarks 231-char remark
-
2026-06-07$55,000 Pending 1 DOM
ⓘ Source: listings_history table (triggers on properties + properties_extension) + one-shot
backfill from property_details.listing_events for pre-trigger history.
Tax reassessment forecast IA · Partial reset (capped growth)
- Current annual tax
- $862 · $72/mo
- Projected year-2 tax
- $863 · $72/mo
- Expected delta
- +$1/yr ($0/mo · 0.1%)
ⓘ Screening estimate from a state-policy table — verify with the county assessor before closing.
Climate risk First Street
- Flood 1/10 Low FEMA zone X (unshaded) · 0% chance over 30 yrs
- Wildfire 4/10 Moderate
- Heat 3/10 Moderate 7 d/yr ≥103°F today · 15 d/yr by 30 yrs out
- Wind 2/10 Low
- Air quality 2/10 Low 2 unhealthy d/yr today · 2 by 30 yrs out
Nearby sold comps map
Loading sold comps map…
Walkable amenities ~0.75 mi
Loading nearby amenities…
Taxation est. · year 1
- Rental income
- $12,750
- − Mortgage interest
- −$3,081
- − Property taxes
- −$862
- − Insurance
- −$275
- − Repairs & maintenance
- −$1,020
- − Management
- −$1,020
- − Depreciation
- −$1,600
- Taxable income
- $4,892
- Est. tax owed @ 24.0%
- −$1,174
- After-tax cash flow
- $4,300/yr
For passive investors: Depreciation is non-cash, so a rental often shows a tax loss while cash-flowing — sheltering income. Rental losses are passive: they offset passive income freely, and up to $25,000/yr can offset ordinary (W-2) income if you actively participate and your MAGI is under $100k (phasing out to $0 by $150k); unused losses carry forward. On sale, claimed depreciation is recaptured at up to 25%, and gains may owe capital-gains tax (a 1031 exchange can defer both). Figures are a year-1 estimate at your 24.0% rate — not tax advice; consult a CPA.
Schools (NCES district)
- District
- Maquoketa Community School District
- NCES district ID
- 1918510
- Math proficiency
- 52% ▼ -9.00%
- Reading proficiency
- 57% ▼ -5.00%
- Median HH income
- $39,880
- Composite
- 45.54/100
- National rank
- #2602
- State rank
- #270 of 289 in IA
Livability — Maquoketa
- Score
- 70/100
- State rank
- #362
- US rank
- #7540
Category grades
Schools grade is shown separately in the Schools card above.
Census & demographics
- Census place
- Maquoketa, IA
- Population (ZIP)
- 8,139
Population outlook (Jackson County) Hauer SSP2
- Today (2025)
- 18,736 people
- By 2030
- 18,227 · -2.7%
- By 2040
- 17,049 · -9.0%
- By 2050
- 15,848 · -15.4%
- By 2075
- 13,660 · -27.1%
- By 2100
- 11,167 · -40.4%
Race, ethnicity, and origin ACS 2023
- Neighborhood character
- Predominantly White (95%)
- Race & ethnicity
- White 95% Two or more races 2% Black 2%
- Common ancestry
- Romanian 2% Slovak 2% Portuguese 2%
- Foreign-born
- 1%
- Languages at home
- 97% English-only · German/W. Germanic 1% Spanish 1%
Political lean MEDSL · Jackson
- 2024 margin
- Solid R (+32.5) · D 33.1% · R 65.6% · Other 1.3%
- 2008→2024 swing
- -56.9pp toward R · 2008: 24.4pp · 2024: -32.5pp
- All cycles
- 2024: R+32.5 2020: R+26.1 2016: R+19.4 2012: D+16.8 2008: D+24.4
Not yet ingested
- Civics
- —
Market trends
- HPI YoY
- ▼ -57.28%
- Current HPI
- 213.2315
- Rent YoY
- —
- Metro
- —
- State GDP YoY
- ▲ 2.48%
- F500 in state
- 4
Industry mix (Fortune 500 HQ in IA)
| Industry | F500 HQs | Revenue |
|---|---|---|
| Financial Services | 1 | $16B |
|
||
| Retail / Convenience | 1 | $15B |
|
||
Price history
-14.7% since first listed8 events — show timeline
- 2026-06-06 Pending — ECIMLS
- 2026-06-04 Listed $55,000 ECIMLS
- 2023-05-01 Sold (MLS) $32,500 ECIMLS
- 2023-04-05 Pending — ECIMLS
- 2023-03-31 Listed $39,900 ECIMLS
- 2023-02-09 Price Changed $50,000 ECIMLS
- 2023-01-26 Price Changed $54,500 ECIMLS
- 2023-01-11 Listed $64,500 ECIMLS
Property tax history
+13.3%/yrLatest (2025): $862 · +2.1% YoY. Source: county tax records.
Cash-flow waterfall
monthlySold comps — $/sqft
last 12 mo · ≤1 miLoading sold comps…