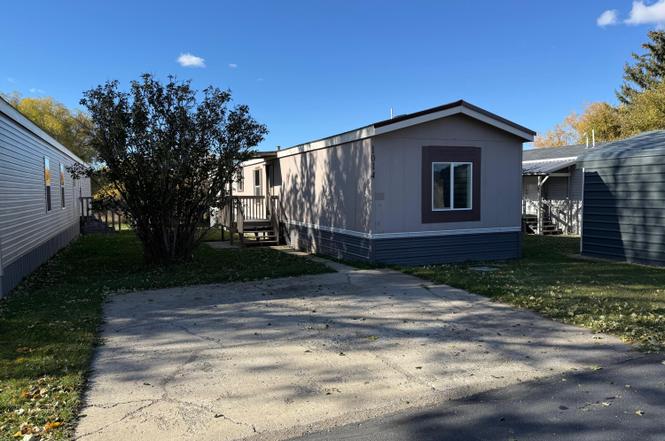
1014 Mountain View Dr · Lewistown, MT
Flood risk 5/10 · Moderate
- FEMA flood zone
- X (unshaded)
- Chance of flooding over 30 yrs
- 0.24%
- Est. flood insurance / yr
- $507 – $1,088
Fire risk 3/10 · Minor
- Est. fire insurance / yr
- $918 – $1,706
Heat risk 2/10 · Minimal
- Hot days now (above 90°F)
- 7 days/yr
- Hot days in 30 yrs
- 16 days/yr
Wind risk 1/10 · Minimal
- Chance of severe wind over 30 yrs
- —
Air-quality risk 5/10 · Moderate
- Unhealthy air days now
- 6 days/yr
- Unhealthy air days in 30 yrs
- 7 days/yr
Risk factors via First Street. Map © Google.
Why this score? — see what drove the B+ grade
The composite is a weighted blend of 9 inputs, each scored 0–100. Each bar is that input's sub-score; the figure is the points it added to the 100-point composite (weight × sub-score).
- Cash flow +30.0/30.0
- ARV discount +15.0/15.0
- 1% rule +10.0/10.0
- DSCR +10.0/10.0
- Schools +4.1/10.0
- Livability +3.4/5.0
- Rent growth +2.5/5.0
- Condition / age +2.5/5.0
- Appreciation +0.0/10.0
$69,900
🖨 Deal sheet 📄 Offer letter ✓ Due diligence
Key facts
- Storage shed
- Open-concept layout
- Built 2006
Tags
Property features AI
Exterior
- Security: Smoke detector(s)
- Utilities: Public water service; Public sewer service; Natural gas available
- Home design: Single-story manufactured home; Residential property
- Exterior features: Public water; Public sewer; Natural gas available; Shed(s)
Interior
- Kitchen: Dishwasher; Microwave; Refrigerator
- Bathrooms: 2 full bathrooms
- Heating & cooling: Forced air heating
- Interior features: Smoke detectors
Neighborhood map
What this means for you Summary
Snapshot
- This is a 3-bed/2.0-bath manufactured listed at $70k.
Deal economics
- At list price, monthly cash flow is $527 ($6k/yr) — positive.
- The deal already cash-flows at list — no discount required.
- Meets the 1% rule at list price ($1k rent vs $70k).
- Recommended offer: $62k (12.0% below list) — sets the bar for market timing.
Location & tenants
- Location reads 67/100 on livability (#111 in MT) — a middle-class / working-renter tenant base. Strengths: cost of living A+, health & safety A+, housing A; Watch: schools D+, crime F, amenities F.
- Lewistown Elementary (town): math 44% / reading 54% proficiency, ranked #37 of 116 in MT (top 32%) — families likely to look elsewhere, expect single-tenant / working-renter base with shorter leases.
- Market conditions: 135 active listings in the ZIP; 4 units permitted in Fergus County in 2024 (0 in 5+ unit buildings).
Forward outlook
- Local home prices are declining (-3.0%/yr); year-one equity from $483 of loan paydown is wiped out by about $2k of value loss. Plan a longer hold.
- Fergus County population projected to shrink 9% by 2050 — rents likely to lag national; underwrite the cash flow, not the appreciation.
- At projected returns (-3.0% appreciation + 3.0% rent growth), your $20k cash investment doubles in ~4 years — after that, you're playing with house money.
Negotiation context
- It's been on market 232 days — a 12% lower offer ($62k) is reasonable based on typical stale-listing flexibility.
Risks & watch-outs
- Climate carrying-cost: moderate flood risk — expect insurance premiums to compound above CPI over the hold.
Questions for the listing agent
- It's been on market 232 days. Have you received any prior offers? Is the seller open to a 12% concession, seller financing, or rate buy-down credit?
- Why hasn't it sold? Are there any deal-killer items the seller is aware of (foundation, flood, title, zoning, code violations)?
- Is there a deadline driving the sale (1031 exchange, divorce, estate, relocation)? That informs how much negotiation room exists.
- Schools are D-rated, which usually means shorter tenancies and higher turnover. Who's the typical renter profile here, and what's been the actual vacancy rate?
- Crime grade is F in this area — have there been break-ins, vandalism, or insurance claims at this property in the last 3 years? What carrier currently insures it and at what premium?
- What's the average days-on-market for RENTAL listings here right now (not sales)? A rising rental-DOM trend means longer vacancies and softer asking-rent achievability than the comps imply.
- What's the recent tenant-quality profile in this submarket — average credit score on applications, eviction rate, late-payment / NSF rate, and stable-employment percentage? A property-management company in the area should have these aggregated.
- How much new for-sale + rental construction is in the pipeline within 1–3 miles? Heavy new supply typically softens prices + rents 12–24 months out; constrained supply supports both.
Investment metrics
- 1% rule
- 1.83% ✓
- Cap rate
- 15.35%
- Cash-on-cash
- 32.34%
- DSCR
- 2.44
- GRM
- 4.6
CMA / ARV
- ARV (on-the-fly)
- $112,860
- Comps found
- 1
Show comp detail 1 sale within ~0.75 mi
| Address | Dist | Beds/Ba | Sqft | Sold | Price | $/sf | Match |
|---|---|---|---|---|---|---|---|
| 830 N Miller St | 0.43mi | 2/2.0 (-1) | 1,216 (+7%) | 4mo | $120,000 | $99 | 60 |
Match score weights: distance 35% · size 25% · config 20% · recency 20%. Top-matched comps best support the ARV.
Projected returns pro-forma
-3.0% appreciation · 3.0% rent growth · sell at horizon
- IRR
- 27.4%
- Equity multiple
- 2.14×
- Total profit
- $22,283
- Equity at exit
- $10,422
- IRR
- 34.9%
- Equity multiple
- 4.21×
- Total profit
- $62,734
- Equity at exit
- $6,044
Cash invested: $19,572 (down + closing). Projections, not guarantees.
Landlord ↔ Tenant lean methodology
- Overall (STATE)
- 82 Strongly Landlord-Friendly
- State Montana
- 82 Strongly Landlord-Friendly · R+11
- County
- — inherits STATE
- City
- — inherits STATE
ZIP-level market 59457
- Active inventory
- 135
- Price-to-rent
- 4.6×
Monthly cashflow live
- Estimated rent
- $1,279 medium interval (Pro) →
- Mortgage (P&I)
- −$367
- Tax est. 1.5%
- −$87 /mo · $1,048/yr
- Insurance
- −$29
- HOA
- −$0
- Vacancy / Maint / Mgmt
- −$269
- Net cashflow
- $527
Break-even live
UW: 25.0% down · 7.5% · 30yr · 1.5% tax · 5.0% vac · 8.0% maint · 8.0% mgmt
Financing live
Cash to close
- Down payment
- $17,475
- Closing costs
- $2,097
- Reserves months
- —
- Total cash needed
- —
Loan-product check · same deal, 3 products live
Conventional
25% down · 7.5% · 30yr
- Down + closing
- —
- Monthly P&I
- —
- Monthly cashflow
- —
- DSCR
- —
- Eligible?
- —
Personal DTI + credit; lowest rate.
DSCR
20% down · 8.5% · 30yr
- Down + closing
- —
- Monthly P&I
- —
- Monthly cashflow
- —
- DSCR
- —
- Eligible?
- —
No personal income docs; deal must DSCR.
Hard money
10% down · 12.0% · 12mo
- Down + closing
- —
- Monthly P&I
- —
- Monthly cashflow
- —
- DSCR
- —
- Eligible?
- —
Short-term bridge; refi at stabilization.
Listing history 17 events
-
2026-06-18days on market $69,900 Active 232 DOM
-
2026-06-17days on market $69,900 Active 231 DOM
-
2026-06-16days on market $69,900 Active 230 DOM
-
2026-06-15days on market $69,900 Active 229 DOM
-
2026-06-13days on market $69,900 Active 227 DOM
-
2026-06-12days on market $69,900 Active 226 DOM
-
2026-06-09days on market $69,900 Active 223 DOM
-
2026-06-08days on market $69,900 Active 222 DOM
-
2026-06-07days on market $69,900 Active 221 DOM
-
2026-06-05days on market $69,900 Active 219 DOM
-
2026-06-04days on market $69,900 Active 217 DOM
-
2026-06-02days on market $69,900 Active 216 DOM
-
2026-06-01days on market $69,900 Active 215 DOM
-
2026-05-31days on market $69,900 Active 214 DOM
-
2026-04-29price $69,900
-
2026-01-05price $76,000
-
2025-10-29$82,500 Active
ⓘ Source: listings_history table (triggers on properties + properties_extension) + one-shot
backfill from property_details.listing_events for pre-trigger history.
Climate risk First Street
- Flood 5/10 Major FEMA zone X (unshaded) · 24% chance over 30 yrs
- Wildfire 3/10 Moderate
- Heat 2/10 Low 7 d/yr ≥90°F today · 16 d/yr by 30 yrs out
- Wind 1/10 Low
- Air quality 5/10 Major 6 unhealthy d/yr today · 7 by 30 yrs out
Nearby sold comps map
Loading sold comps map…
Walkable amenities ~0.75 mi
Loading nearby amenities…
Taxation est. · year 1
- Rental income
- $15,349
- − Mortgage interest
- −$3,915
- − Property taxes
- −$1,048
- − Insurance
- −$350
- − Repairs & maintenance
- −$1,228
- − Management
- −$1,228
- − Depreciation
- −$2,033
- Taxable income
- $5,546
- Est. tax owed @ 24.0%
- −$1,331
- After-tax cash flow
- $4,998/yr
For passive investors: Depreciation is non-cash, so a rental often shows a tax loss while cash-flowing — sheltering income. Rental losses are passive: they offset passive income freely, and up to $25,000/yr can offset ordinary (W-2) income if you actively participate and your MAGI is under $100k (phasing out to $0 by $150k); unused losses carry forward. On sale, claimed depreciation is recaptured at up to 25%, and gains may owe capital-gains tax (a 1031 exchange can defer both). Figures are a year-1 estimate at your 24.0% rate — not tax advice; consult a CPA.
Schools (NCES district)
- District
- Lewistown Elementary
- NCES district ID
- 3016490
- Math proficiency
- 44% ▼ -4.00%
- Reading proficiency
- 54% ▼ -4.00%
- Median HH income
- $40,237
- Composite
- 40.99/100
- National rank
- #3593
- State rank
- #37 of 116 in MT
Livability — Lewistown
- Score
- 67/100
- State rank
- #111
- US rank
- #11132
Category grades
Schools grade is shown separately in the Schools card above.
Census & demographics
- Census place
- Lewistown, MT
- Population (ZIP)
- 9,215
Population outlook (Fergus County) Hauer SSP2
- Today (2025)
- 10,955 people
- By 2030
- 10,722 · -2.1%
- By 2040
- 10,274 · -6.2%
- By 2050
- 9,993 · -8.8%
- By 2075
- 10,766 · -1.7%
- By 2100
- 10,922 · -0.3%
Race, ethnicity, and origin ACS 2023
- Neighborhood character
- Predominantly White (92%)
- Race & ethnicity
- White 92% Hispanic / Latino 3% Two or more races 2% Native American 2% Asian 1%
- Common ancestry
- Portuguese 8% Slovak 6% Lithuanian 2%
- Foreign-born
- 2% · Canada, South Korea
- Languages at home
- 96% English-only · Spanish 3% German/W. Germanic 1%
Political lean MEDSL · Fergus
- 2024 margin
- Solid R (+51.3) · D 22.7% · R 74.0% · Other 3.4%
- 2008→2024 swing
- -16.4pp toward R · 2008: -34.9pp · 2024: -51.3pp
- All cycles
- 2024: R+51.3 2020: R+51.6 2016: R+52.6 2012: R+43.3 2008: R+34.9
Not yet ingested
- Civics
- —
Market trends
- HPI YoY
- ▼ -137.83%
- Current HPI
- 210.4278
- Rent YoY
- —
- Metro
- —
- State GDP YoY
- ▲ 3.41%
- F500 in state
- 2
Industry mix (Fortune 500 HQ in MT)
| Industry | F500 HQs | Revenue |
|---|---|---|
| Technology / Analytics | 1 | $2B |
|
||
Price history
-15.3% since first listed3 events — show timeline
- 2026-04-29 Price Changed $69,900 HHLMLS
- 2026-01-05 Price Changed $76,000 HHLMLS
- 2025-10-29 Listed $82,500 HHLMLS
Cash-flow waterfall
monthlySold comps — $/sqft
last 12 mo · ≤1 miLoading sold comps…