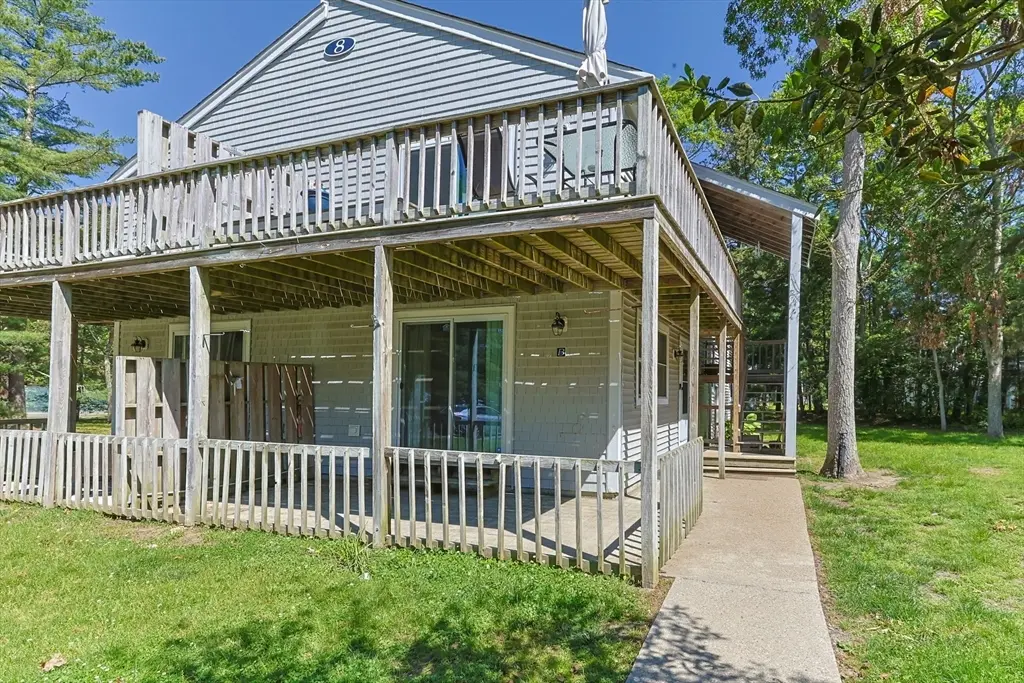
70 Cape Dr Unit 8B · Mashpee, MA
Flood risk 1/10 · Minimal
- FEMA flood zone
- X (unshaded)
- Chance of flooding over 30 yrs
- 0.0%
- Est. flood insurance / yr
- $507 – $1,088
Fire risk 1/10 · Minimal
- Est. fire insurance / yr
- $915 – $1,699
Heat risk 4/10 · Minor
- Hot days now (above 88°F)
- 7 days/yr
- Hot days in 30 yrs
- 17 days/yr
Wind risk 8/10 · Major
- Chance of severe wind over 30 yrs
- 80.0%
Air-quality risk 3/10 · Minor
- Unhealthy air days now
- 3 days/yr
- Unhealthy air days in 30 yrs
- 4 days/yr
Risk factors via First Street. Map © Google.
Why this score? — see what drove the C grade
The composite is a weighted blend of 9 inputs, each scored 0–100. Each bar is that input's sub-score; the figure is the points it added to the 100-point composite (weight × sub-score).
- Cash flow +25.0/30.0
- DSCR +8.1/10.0
- ARV discount +7.5/15.0
- 1% rule +7.3/10.0
- Schools +3.8/10.0
- Rent growth +2.5/5.0
- Livability +2.5/5.0
- Condition / age +2.5/5.0
- Appreciation +0.0/10.0
$325,000
🖨 Deal sheet (PDF) 📄 Offer letter ✓ Due diligence
Listing remarks MLS
Welcome home to this cute 2 bedroom 1 bath ground level condo located minutes from Mashpee Commons in Pheasant Run. Newer windows and slider. Custom poplar wood counter top and breakfast bar. Complex has a basement (exterior access) with a private storage area for the unit along with washing machine and dryer hookup. Close to shopping, mini golf, and more! Association amenities offesr tennis courts and a pool.
Key facts
- Community pool
- Near beaches
- Tennis courts
Tags
Property features AI
Finance
- Other: Address: 70 Cape Dr Unit 8B, Mashpee, MA 02649; Directions: Route 28 to Cape Dr., second entrance on the left, Building 8 on the left
- HOA & community: Association fee of $497; Association covers road maintenance and snow removal; Community amenities include pool and tennis courts; Pets allowed; Not a senior community
Exterior
- Parking: 2 assigned parking spaces plus guest parking
- Utilities: Public water; Private sewer
- Home design: Condominium garden-style unit; Single-story (1 story); Entry on level 1; No unit below
- Construction: Located in the Pheasant Run building; Built (year from public records)
- Exterior features: Patio; Association-maintained in-ground pool; Tennis courts
Interior
- Bathrooms: 1 full bathroom
- Heating & cooling: Electric heating; Heating present
- Interior features: Total of 4 rooms; Basement present
Neighborhood map
What this means for you Summary
Snapshot
- This is a 2-bed/1.0-bath condo listed at $325k.
Deal economics
- At list price, monthly cash flow is $705 ($8k/yr) — positive.
- The deal already cash-flows at list — no discount required.
- Meets the 1% rule at list price ($4k rent vs $325k).
Location & tenants
- Location reads: area grade C — affects rentability + tenant quality, not the cash-flow math above.
- Mashpee (suburban): math 34% / reading 51% proficiency, ranked #183 of 302 in MA (top 61%) — families likely to look elsewhere, expect single-tenant / working-renter base with shorter leases.
- Market conditions: 140 active listings in the ZIP; 1 comparable units currently listed for rent nearby; 657 units permitted in Barnstable County in 2024 (178 in 5+ unit buildings).
Forward outlook
- Local home prices are declining (-3.0%/yr); year-one equity from $2k of loan paydown is wiped out by about $10k of value loss. Plan a longer hold.
- Barnstable County population projected at -20% by 2050 — secular population decline; favor cash flow + early exit over multi-decade hold.
Negotiation context
- Only 14 days on market — expect competitive offers; lowballing is unlikely to land.
- 6 sale attempts since 26y ago with the ask held roughly flat each time — persistent listings suggest the price (not the market) is what's stuck; bring a comps-based counter.
- Current owner paid $210k; list at $325k implies a 55% gain — meaningful room to come down on a strong offer.
Risks & watch-outs
- Climate carrying-cost: severe wind risk, 80% chance of damaging wind over 30y — expect insurance premiums to compound above CPI over the hold.
Questions for the listing agent
- What does the HOA fee cover, when was the last increase, and are there any pending special assessments or reserve-fund shortfalls?
- Any open or pending special assessments — roof, HVAC, plumbing, elevator, façade? What's the per-unit balance and payoff schedule, and is the seller paying it off at close or rolling it to the buyer?
- Is there a deadline driving the sale (1031 exchange, divorce, estate, relocation)? That informs how much negotiation room exists.
- What's the average days-on-market for RENTAL listings here right now (not sales)? A rising rental-DOM trend means longer vacancies and softer asking-rent achievability than the comps imply.
- What's the recent tenant-quality profile in this submarket — average credit score on applications, eviction rate, late-payment / NSF rate, and stable-employment percentage? A property-management company in the area should have these aggregated.
- How much new apartment / multifamily construction is in the pipeline within 1–3 miles? Heavy new supply (>2% of stock underway) typically softens rents 12–24 months out; light construction supports rent growth.
Investment metrics
- 1% rule
- 1.23% ✓
- Cap rate
- 8.90%
- Cash-on-cash
- 9.30%
- DSCR
- 1.41
- GRM
- 6.8
CMA / ARV
No comps found within radius.
Projected returns pro-forma
-3.0% appreciation · 3.0% rent growth · sell at horizon
- IRR
- -2.2%
- Equity multiple
- 0.92×
- Total profit
- $-7,579
- Equity at exit
- $48,459
- IRR
- 7.5%
- Equity multiple
- 1.57×
- Total profit
- $51,979
- Equity at exit
- $28,100
Cash invested: $91,000 (down + closing). Projections, not guarantees.
Landlord ↔ Tenant lean methodology
- Overall (STATE)
- 20 Strongly Tenant-Friendly
- State Massachusetts
- 20 Strongly Tenant-Friendly · D+15
- County
- — inherits STATE
- City
- — inherits STATE
ZIP-level market 02649
- Home prices YoY
- -32.6%
- Active inventory
- 140
- Price-to-rent
- 6.8×
Monthly cashflow live
- Estimated rent
- $4,000 medium interval (Pro) →
- Mortgage (P&I)
- −$1,704
- Tax from tax record
- −$118 /mo · $1,420/yr
- Insurance
- −$135
- HOA
- −$497
- Vacancy / Maint / Mgmt
- −$840
- Net cashflow
- $705
Break-even live
Sensitivity live
| Price | -10% $889 | -5% $797 | +0% $705 | +5% $613 | +10% $521 |
|---|---|---|---|---|---|
| Rent | -10% $389 | -5% $547 | +0% $705 | +5% $863 | +10% $1,021 |
| Rate | -1.0pp $869 | -0.5pp $788 | base $705 | +0.5pp $621 | +1.0pp $535 |
UW: 25.0% down · 7.5% · 30yr · 1.5% tax · 5.0% vac · 8.0% maint · 8.0% mgmt
Financing live
Cash to close
- Down payment
- $81,250
- Closing costs
- $9,750
- Reserves months
- —
- Total cash needed
- —
Loan-product check · same deal, 3 products live
Conventional
25% down · 7.5% · 30yr
- Down + closing
- —
- Monthly P&I
- —
- Monthly cashflow
- —
- DSCR
- —
- Eligible?
- —
Personal DTI + credit; lowest rate.
DSCR
20% down · 8.5% · 30yr
- Down + closing
- —
- Monthly P&I
- —
- Monthly cashflow
- —
- DSCR
- —
- Eligible?
- —
No personal income docs; deal must DSCR.
Hard money
10% down · 12.0% · 12mo
- Down + closing
- —
- Monthly P&I
- —
- Monthly cashflow
- —
- DSCR
- —
- Eligible?
- —
Short-term bridge; refi at stabilization.
Rent comps 1 comps
| Address | Beds | Baths | Sqft | Rent | $/sqft | DOM | Units | Dist |
|---|---|---|---|---|---|---|---|---|
| 87 Park Place Way Mashpee, MA | 3.0 | 2.0 | 1056 | $4,000 | $3.79 | 44d | 1 | 1.20mi |
HOA detail condo
- Monthly dues
- $497 · $5,964/yr
- Likely covers
- pool
- Assessments
- None detected in remarks — confirm with the listing agent.
Listing history 11 events
-
2026-06-21days on market $325,000 Active 14 DOM
-
2026-06-18days on market $325,000 Active 12 DOM
-
2026-06-17days on market $325,000 Active 11 DOM
-
2026-06-16days on market $325,000 Active 10 DOM
-
2026-06-15days on market $325,000 Active 9 DOM
-
2026-06-13days on market $325,000 Active 7 DOM
-
2026-06-12statusdays on market $325,000 Active 6 DOM
-
2026-06-09days on market $325,000 New 3 DOM
-
2026-06-08days on market $325,000 New 2 DOM
-
2026-06-07remarks 430-char remark
-
2026-06-07$325,000 New 1 DOM
ⓘ Source: listings_history table (triggers on properties + properties_extension) + one-shot
backfill from property_details.listing_events for pre-trigger history.
Tax reassessment forecast MA · Partial reset (capped growth)
- Current annual tax
- $1,420 · $118/mo
- Projected year-2 tax
- $2,709 · $226/mo
- Expected delta
- +$1,289/yr (+$107/mo · 90.8%)
ⓘ Screening estimate from a state-policy table — verify with the county assessor before closing.
Climate risk First Street
- Flood 1/10 Low FEMA zone X (unshaded) · 0% chance over 30 yrs
- Wildfire 1/10 Low
- Heat 4/10 Moderate 7 d/yr ≥88°F today · 17 d/yr by 30 yrs out
- Wind 8/10 Severe 80% chance of damaging wind over 30 yrs
- Air quality 3/10 Moderate 3 unhealthy d/yr today · 4 by 30 yrs out
Nearby sold comps map
Loading sold comps map…
Walkable amenities ~0.75 mi
Loading nearby amenities…
Taxation est. · year 1
- Rental income
- $48,000
- − Mortgage interest
- −$18,205
- − Property taxes
- −$1,420
- − Insurance
- −$1,625
- − Repairs & maintenance
- −$3,840
- − Management
- −$3,840
- − HOA
- −$5,964
- − Depreciation
- −$9,455
- Taxable income
- $3,651
- Est. tax owed @ 24.0%
- −$876
- After-tax cash flow
- $7,583/yr
For passive investors: Depreciation is non-cash, so a rental often shows a tax loss while cash-flowing — sheltering income. Rental losses are passive: they offset passive income freely, and up to $25,000/yr can offset ordinary (W-2) income if you actively participate and your MAGI is under $100k (phasing out to $0 by $150k); unused losses carry forward. On sale, claimed depreciation is recaptured at up to 25%, and gains may owe capital-gains tax (a 1031 exchange can defer both). Figures are a year-1 estimate at your 24.0% rate — not tax advice; consult a CPA.
Schools (NCES district)
- District
- Mashpee
- NCES district ID
- 2507440
- Math proficiency
- 34% ▼ -16.00%
- Reading proficiency
- 51% ▼ -2.00%
- Median HH income
- $65,376
- Composite
- 37.97/100
- National rank
- #4299
- State rank
- #183 of 302 in MA
Livability — Mashpee
No livability data for this city. (Only ~50 U.S. cities are tracked.)
Census & demographics
- Population (ZIP)
- 15,234
Population outlook (Barnstable County) Hauer SSP2
- Today (2025)
- 208,497 people
- By 2030
- 202,530 · -2.9%
- By 2040
- 184,936 · -11.3%
- By 2050
- 167,489 · -19.7%
- By 2075
- 144,938 · -30.5%
- By 2100
- 117,312 · -43.7%
Race, ethnicity, and origin ACS 2023
- Neighborhood character
- Predominantly White (88%)
- Race & ethnicity
- White 88% Two or more races 5% Black 2% Hispanic / Latino 2% Native American 2%
- Common ancestry
- Lithuanian 5% Russian 5% Romanian 4%
- Foreign-born
- 5% · Canada
- Languages at home
- 95% English-only · Spanish 2% Other Indo-European 1% Russian/Polish/Slavic 1%
Political lean MEDSL · Barnstable
- 2024 margin
- Strong D (+20.8) · D 59.6% · R 38.9% · Other 1.5%
- 2008→2024 swing
- +6.7pp toward D · 2008: 14.0pp · 2024: 20.8pp
- All cycles
- 2024: D+20.8 2020: D+24.4 2016: D+13.4 2012: D+7.6 2008: D+14.0
Not yet ingested
- Civics
- —
Market trends
- HPI YoY
- ▼ -159.04%
- Current HPI
- 328.8662
- Rent YoY
- —
- Metro
- —
- State GDP YoY
- ▲ 2.28%
- F500 in state
- 38
Industry mix (Fortune 500 HQ in MA)
| Industry | F500 HQs | Revenue |
|---|---|---|
| Technology | 3 | $17B |
|
||
| Insurance | 2 | $84B |
|
||
| Retail | 2 | $76B |
|
||
| Life Sciences | 1 | $43B |
|
||
| Energy Technology | 1 | $31B |
|
||
| Aerospace / Defense | 1 | $18B |
|
||
Price history
+291.6% since first listed18 events — show timeline
- 2026-06-06 Listed $325,000 MLS PIN
- 2021-08-06 Sold (Public Records) $210,000 Public Records
- 2021-08-06 Sold (MLS) $210,000 CCIMLS
- 2021-06-23 Pending — CCIMLS
- 2021-06-22 Listed $205,000 CCIMLS
- 2019-12-13 Sold (Public Records) $178,500 Public Records
- 2019-12-13 Sold (MLS) $178,500 CCIMLS
- 2019-12-13 Sold (MLS) $178,500 MLS PIN
- 2019-10-31 Pending — MLS PIN
- 2019-10-31 Pending — CCIMLS
- 2019-10-30 Listed $178,500 MLS PIN
- 2019-10-28 Listed $178,500 CCIMLS
- 2004-02-17 Sold (MLS) $158,000 CCIMLS
- 2003-10-12 Listed $164,900 CCIMLS
- 2001-04-19 Sold (Public Records) $95,000 Public Records
- 2001-04-19 Sold (MLS) $95,000 CCIMLS
- 2000-10-03 Listed $99,900 CCIMLS
- 1987-06-09 Sold (Public Records) $83,000 Public Records
Property tax history
+7.4%/yrLatest (2023): $1,420 · +4.0% YoY. Source: county tax records.
Cash-flow waterfall
monthlySold comps — $/sqft
last 12 mo · ≤1 miLoading sold comps…