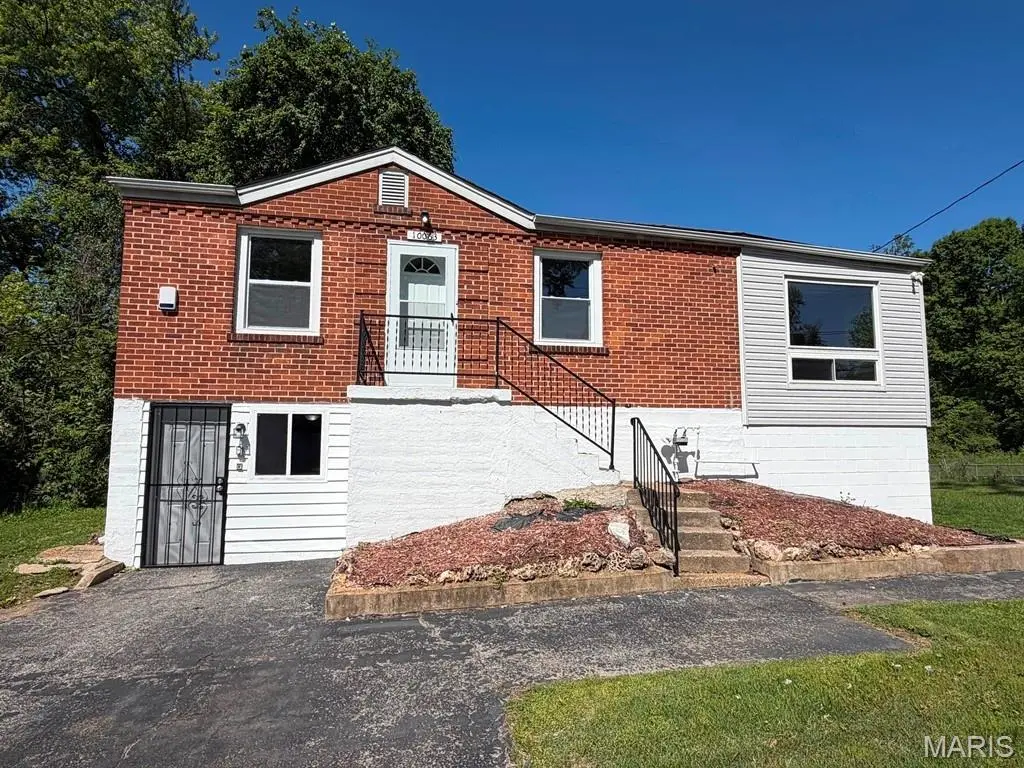
10063 Green Valley Dr · Dellwood, MO
Flood risk 1/10 · Minimal
- FEMA flood zone
- AE
- Chance of flooding over 30 yrs
- 0.0%
- Est. flood insurance / yr
- $2,026 – $9,024
Fire risk 1/10 · Minimal
- Est. fire insurance / yr
- $1,054 – $1,958
Heat risk 5/10 · Moderate
- Hot days now (above 107°F)
- 7 days/yr
- Hot days in 30 yrs
- 20 days/yr
Wind risk 2/10 · Minimal
- Chance of severe wind over 30 yrs
- 1.0%
Air-quality risk 3/10 · Minor
- Unhealthy air days now
- 3 days/yr
- Unhealthy air days in 30 yrs
- 5 days/yr
Risk factors via First Street. Map © Google.
Why this score? — see what drove the B+ grade
The composite is a weighted blend of 9 inputs, each scored 0–100. Each bar is that input's sub-score; the figure is the points it added to the 100-point composite (weight × sub-score).
- Cash flow +30.0/30.0
- ARV discount +15.0/15.0
- DSCR +10.0/10.0
- 1% rule +8.0/10.0
- Appreciation +6.9/10.0
- Rent growth +3.7/5.0
- Livability +3.3/5.0
- Condition / age +2.5/5.0
- Schools +0.4/10.0
$92,700
🖨 Deal sheet (PDF) 📄 Offer letter ✓ Due diligence
Listing remarks
This bungalow style home delivers practical living space with updated interior finishes and a finished lower level that expands usable square footage. The property contains 2 bedrooms and 1 bathroom on the main floor. The kitchen features stainless steel appliances, while fresh neutral paint throughout the home provides a clean, move-in-ready interior. The finished lower level adds functional space for recreation, storage, or additional living area, making this home adaptable to various occupant needs. This is a Fannie Mae HomePath property.
Key facts
- Fresh neutral paint
- Bungalow style home
- Finished lower level
Tags
Property features AI
Finance
- Other: Living area reported as 946 above grade with an additional 500 below grade finished area; No pool
- Financial info: Lease not considered; No second mortgage indicated; Seller may consider concessions
Exterior
- Parking: No listed parking spaces
- Utilities: Public water; Public sewer; Electric service by Ameren
- Home design: Single-family residence; One level
- Construction: Brick construction
- Exterior features: Lot dimensions approximately 55 x 140; Lot features: Other; Cable available
Interior
- Bedrooms: 2 bedrooms on the main level
- Bathrooms: 1 full bathroom on the main level
- Heating & cooling: Forced air heating; Central air conditioning
- Interior features: Basement is full and partially finished; Fireplace located in the basement; Central air conditioning; Forced air heating
Neighborhood map
What this means for you Summary
Snapshot
- This is a 2-bed/1.0-bath single-family listed at $93k.
Deal economics
- At list price, monthly cash flow is $-106 ($-1k/yr) — negative.
- To cash-flow at today's rent, offer at most $74k (20.2% below list).
- Meets the 1% rule at list price ($1k rent vs $93k).
- Recommended offer: $74k (20.2% below list) — sets the bar for cash-flow.
Location & tenants
- Location reads 66/100 on livability (#239 in MO) — a middle-class / working-renter tenant base. Strengths: cost of living A+, housing A+; Watch: health & safety C-, crime D-, amenities F.
- Riverview Gardens (suburban): math 2% / reading 9% proficiency, ranked #324 of 324 in MO (top 100%) — low school quality limits family demand, transient renter base, plan for 1-2y turnover; 90% free/reduced lunch — lower-income household profile, screen leases tightly.
- Zoned schools: Moline Elem. (math 2% / reading 12%, grade F, #1,058 of 1,115 statewide, top 96%, 295 students, 99% FRL); Riverview Gardens Sr. High (math 2% / reading 18%, grade F, #501 of 521 statewide, top 97%, 1,331 students, 100% FRL).
- Market conditions: Rents rising fast (+5.0%/yr); 376 active listings in the ZIP; 40 comparable units currently listed for rent nearby; rentals at typical pace (median 26d on market — plan ~3-4 weeks tenant-placement turnaround); 40% of comp listings sitting > 30 days — soft ceiling on asking rent; lower-income renter base — watch delinquency; 920 units permitted in St. Louis County in 2024 (250 in 5+ unit buildings).
- This rent runs 35% of the median local income ($41k/yr) — at the standard rent-burdened threshold; future hikes will face affordability resistance.
Forward outlook
- In year one you build about $4k of equity ($641 loan paydown + $4k appreciation (3.8% local appreciation)).
- By year 8, paydown + projected appreciation supports a ~$31k cash-out refi (75% LTV) — recoverable capital for the next deal without selling this one.
Negotiation context
- It's been on market 18 days — a 2% lower offer ($91k) is reasonable based on typical stale-listing flexibility.
- Current owner paid $57k; list at $93k implies a 63% gain — meaningful room to come down on a strong offer.
Risks & watch-outs
- Watch-outs: flood insurance adds $460/mo; built in 1947 — expect roof / HVAC / electrical / plumbing capex.
- Climate carrying-cost: in FEMA flood zone AE (mandatory federal flood insurance); extreme-heat days projected 7→20/yr by 2055 (HVAC capex compounding) — expect insurance premiums to compound above CPI over the hold.
Questions for the listing agent
- What do current leases actually rent for vs. the listed asking? Can we see a recent rent roll and the last 12 months of T-12 income?
- Built in 1947 — when were the roof, HVAC, electrical panel, plumbing, and water heater last replaced?
- What's the actual annual flood-insurance premium (NFIP or private), and is the property in a SFHA with mandatory coverage?
- Is there a deadline driving the sale (1031 exchange, divorce, estate, relocation)? That informs how much negotiation room exists.
- Schools are D-rated, which usually means shorter tenancies and higher turnover. Who's the typical renter profile here, and what's been the actual vacancy rate?
- Crime grade is D in this area — have there been break-ins, vandalism, or insurance claims at this property in the last 3 years? What carrier currently insures it and at what premium?
- What's the average days-on-market for RENTAL listings here right now (not sales)? A rising rental-DOM trend means longer vacancies and softer asking-rent achievability than the comps imply.
- What's the recent tenant-quality profile in this submarket — average credit score on applications, eviction rate, late-payment / NSF rate, and stable-employment percentage? A property-management company in the area should have these aggregated.
- How much new for-sale + rental construction is in the pipeline within 1–3 miles? Heavy new supply typically softens prices + rents 12–24 months out; constrained supply supports both.
Investment metrics
- 1% rule
- 1.30% ✓
- Cap rate
- 10.88%
- Cash-on-cash
- 16.39%
- DSCR
- 1.73
- GRM
- 6.4
CMA / ARV
- ARV (on-the-fly)
- $116,358
- Comps found
- 12
Show comp detail 12 sales within ~0.75 mi
| Address | Dist | Beds/Ba | Sqft | Sold | Price | $/sf | Match |
|---|---|---|---|---|---|---|---|
| 10038 Balboa Dr | 0.13mi | 3/1.0 (+1) | 864 (-9%) | 2mo | $49,900 | $58 | 73 |
| 2014 Kappel Dr | 0.50mi | 2/1.0 | 989 (+4%) | 2mo | $19,000 | $19 | 68 |
| 9871 Medford Dr | 0.59mi | 3/1.0 (+1) | 950 (+0%) | 2mo | $124,900 | $131 | 66 |
| 1719 Newhall Ct | 0.53mi | 3/1.0 (+1) | 975 (+3%) | 0mo | $120,000 | $123 | 65 |
| 1829 Chambers Rd | 0.30mi | 2/1.0 | 816 (-14%) | 2mo | $34,900 | $43 | 62 |
| 9739 Balboa Dr | 0.50mi | 3/1.0 (+1) | 999 (+6%) | 1mo | $76,900 | $77 | 61 |
| 2042 Kappel Dr | 0.52mi | 2/1.0 | 828 (-12%) | 1mo | $49,900 | $60 | 54 |
| 9614 Winkler Dr | 0.59mi | 3/1.0 (+1) | 1,020 (+8%) | 1mo | $125,000 | $123 | 53 |
| 1923 Nashua Dr | 0.62mi | 3/1.0 (+1) | 1,014 (+7%) | 1mo | $149,900 | $148 | 53 |
| 10127 Monarch Dr | 0.69mi | 3/1.5 (+1) | 1,015 (+7%) | 1mo | $155,000 | $153 | 48 |
| 10020 Dellridge Ln | 0.73mi | 2/1.0 | 816 (-14%) | 2mo | $49,900 | $61 | 42 |
| 10231 Monarch Dr | 0.74mi | 3/2.0 (+1) | 1,073 (+13%) | 1mo | $189,999 | $177 | 33 |
Match score weights: distance 35% · size 25% · config 20% · recency 20%. Top-matched comps best support the ARV.
Projected returns pro-forma
3.79% appreciation · 4.97% rent growth · sell at horizon
- IRR
- 7.0%
- Equity multiple
- 1.43×
- Total profit
- $11,056
- Equity at exit
- $45,867
- IRR
- 10.9%
- Equity multiple
- 2.86×
- Total profit
- $48,344
- Equity at exit
- $74,129
Cash invested: $25,956 (down + closing). Projections, not guarantees.
Landlord ↔ Tenant lean methodology
- Overall (STATE)
- 81 Strongly Landlord-Friendly
- State Missouri
- 81 Strongly Landlord-Friendly · R+10
- County
- — inherits STATE
- City
- — inherits STATE
ZIP-level market 63136
- Home prices YoY
- 0.9%
- Rents YoY
- 5.0%
- Active inventory
- 376
- Price-to-rent
- 6.4×
Monthly cashflow live
- Estimated rent
- $1,202 high interval (Pro) →
- Mortgage (P&I)
- −$486
- Tax from tax record
- −$70 /mo · $846/yr
- Insurance
- −$39
- Flood insurance flood zone
- −$460 /mo · $5,525/yr
- HOA
- −$0
- Vacancy / Maint / Mgmt
- −$252
- Net cashflow
- $-106
Break-even live
Sensitivity live
| Price | -10% $-53 | -5% $-80 | +0% $-106 | +5% $-132 | +10% $-158 |
|---|---|---|---|---|---|
| Rent | -10% $-201 | -5% $-153 | +0% $-106 | +5% $-58 | +10% $-11 |
| Rate | -1.0pp $-59 | -0.5pp $-82 | base $-106 | +0.5pp $-130 | +1.0pp $-154 |
UW: 25.0% down · 7.5% · 30yr · 1.5% tax · 5.0% vac · 8.0% maint · 8.0% mgmt
Financing live
Cash to close
- Down payment
- $23,175
- Closing costs
- $2,781
- Reserves months
- —
- Total cash needed
- —
Loan-product check · same deal, 3 products live
Conventional
25% down · 7.5% · 30yr
- Down + closing
- —
- Monthly P&I
- —
- Monthly cashflow
- —
- DSCR
- —
- Eligible?
- —
Personal DTI + credit; lowest rate.
DSCR
20% down · 8.5% · 30yr
- Down + closing
- —
- Monthly P&I
- —
- Monthly cashflow
- —
- DSCR
- —
- Eligible?
- —
No personal income docs; deal must DSCR.
Hard money
10% down · 12.0% · 12mo
- Down + closing
- —
- Monthly P&I
- —
- Monthly cashflow
- —
- DSCR
- —
- Eligible?
- —
Short-term bridge; refi at stabilization.
Rent comps 40 comps
| Address | Beds | Baths | Sqft | Rent | $/sqft | DOM | Units | Dist |
|---|---|---|---|---|---|---|---|---|
| 10078 Green Valley Dr Saint Louis, MO | 3.0 | 1.0 | 900 | $1,325 | $1.47 | 9d | 1 | 0.04mi |
| 10124 Winkler Dr Saint Louis, MO | 2.0 | 1.0 | 792 | $1,400 | $1.77 | 5d | 1 | 0.13mi |
| 10128 Cloverdale Dr Saint Louis, MO | 2.0 | 1.0 | 792 | $1,000 | $1.26 | 45d | 1 | 0.15mi |
| 10128 Cloverdale Dr Saint Louis, MO | 2.0 | 1.0 | 792 | $1,000 | $1.26 | 25d | 1 | 0.15mi |
| 10128 Cloverdale Dr Saint Louis, MO | 2.0 | 1.0 | 792 | $1,000 | $1.26 | 0d | 1 | 0.15mi |
| 10129 Cavalier Ct Saint Louis, MO | 3.0 | 1.5 | 912 | $1,250 | $1.37 | 25d | 1 | 0.25mi |
| 9827 Winkler Dr Saint Louis, MO | 3.0 | 1.0 | 864 | $1,450 | $1.68 | 9d | 1 | 0.38mi |
| 9823 Winkler Dr Saint Louis, MO | 2.0 | 1.0 | 788 | $900 | $1.14 | 0d | 1 | 0.39mi |
| 9823 Winkler Dr Saint Louis, MO | 2.0 | 1.0 | 788 | $900 | $1.14 | 45d | 1 | 0.39mi |
| 10239 Green Valley Dr Saint Louis, MO | 3.0 | 1.0 | 1014 | $1,395 | $1.38 | 25d | 1 | 0.41mi |
| 10032 Neville Walk Unit 10016C St. Louis, MO | 1.0 | 1.0 | 720 | $855 | $1.19 | 0d | 1 | 0.45mi |
| 2008 Kappel Dr Saint Louis, MO | 3.0 | 1.0 | 858 | $1,175 | $1.37 | 25d | 1 | 0.49mi |
| 2155 Hecht Ave St. Louis, MO | 1.0–2.0 | 1.0 | 673 | $1,157 | $1.72 | 0d | 23 | 0.53mi |
| 9709 Balboa Dr Saint Louis, MO | 3.0 | 1.0 | 1000 | $1,600 | $1.60 | 45d | 1 | 0.54mi |
| 1733 Kappel Ave Saint Louis, MO | 3.0 | 1.0 | 912 | $1,250 | $1.37 | 25d | 1 | 0.56mi |
| 9840 Medford Dr Saint Louis, MO | 3.0 | 1.0 | 912 | $1,095 | $1.20 | 45d | 1 | 0.59mi |
| 9868 Lorna Ln Saint Louis, MO | 3.0 | 1.0 | 1032 | $1,175 | $1.14 | 45d | 1 | 0.63mi |
| 1654 Mowbry Ln Saint Louis, MO | 3.0 | 1.0 | 936 | $1,300 | $1.39 | 25d | 1 | 0.63mi |
| 9839 Medford Dr Saint Louis, MO | 3.0 | 1.0 | 912 | $1,095 | $1.20 | 45d | 1 | 0.63mi |
| 9750 Lorna Ln Saint Louis, MO | 3.0 | 1.0 | 1032 | $1,100 | $1.07 | 45d | 1 | 0.74mi |
| 9725 Medford Dr Saint Louis, MO | 3.0 | 1.0 | 912 | $1,485 | $1.63 | 45d | 1 | 0.75mi |
| 9850 Dennis Dr Saint Louis, MO | 2.0 | 1.0 | 1032 | $1,175 | $1.14 | 45d | 1 | 0.75mi |
| 10113 Count Dr Saint Louis, MO | 2.0 | 1.0 | 882 | $775 | $0.88 | 45d | 1 | 0.77mi |
| 9845 Dennis Dr Saint Louis, MO | 3.0 | 1.0 | 960 | $1,550 | $1.61 | 14d | 1 | 0.78mi |
| 10112 Count Dr Saint Louis, MO | 2.0 | 1.0 | 792 | $1,000 | $1.26 | 9d | 1 | 0.79mi |
| 2326 Chambers Rd Saint Louis, MO | 2.0 | 1.0 | 1056 | $1,050 | $0.99 | 25d | 1 | 0.79mi |
| 10322 Monarch Dr Saint Louis, MO | 3.0 | 2.0 | 1073 | $1,728 | $1.61 | 25d | 1 | 0.80mi |
| 2321 Noll Dr Saint Louis, MO | 3.0 | 1.0 | 975 | $1,320 | $1.35 | 25d | 1 | 0.83mi |
| 2152 Nemnich Rd Saint Louis, MO | 2.0 | 1.5 | 1030 | $1,100 | $1.07 | 45d | 1 | 0.85mi |
| 1547 Babcock Dr Saint Louis, MO | 3.0 | 1.0 | 1014 | $1,480 | $1.46 | 45d | 1 | 0.88mi |
| 9547 Glen Owen Dr Saint Louis, MO | 2.0 | 1.0 | 923 | $985 | $1.07 | 25d | 1 | 0.89mi |
| 10409 Count Dr Saint Louis, MO | 3.0 | 1.0 | 912 | $1,100 | $1.21 | 24d | 1 | 0.93mi |
| 10113 Duke Dr Saint Louis, MO | 3.0 | 1.0 | 770 | $1,325 | $1.72 | 45d | 1 | 0.94mi |
| 9717 Dennis Dr Saint Louis, MO | 3.0 | 1.0 | 1056 | $1,323 | $1.25 | 45d | 1 | 0.95mi |
| 10365 Lord Dr Saint Louis, MO | 3.0 | 1.0 | 864 | $1,075 | $1.24 | 4d | 1 | 0.96mi |
| 10504 Baron Dr Saint Louis, MO | 3.0 | 1.0 | 1000 | $1,300 | $1.30 | 9d | 1 | 0.99mi |
| 9744 Lanier Dr Saint Louis, MO | 3.0 | 1.0 | 1014 | $1,345 | $1.33 | 45d | 1 | 0.99mi |
| 10329 Chesley Dr Saint Louis, MO | 3.0 | 1.0 | 1014 | $1,350 | $1.33 | 25d | 1 | 0.99mi |
| 10139 Royal Dr Saint Louis, MO | 2.0 | 1.0 | 1016 | $900 | $0.89 | 45d | 1 | 1.00mi |
| 10348 Earl Dr Saint Louis, MO | 3.0 | 1.0 | 770 | $1,325 | $1.72 | 0d | 1 | 1.03mi |
Listing history 12 events
-
2026-06-21days on market $92,700 Active 18 DOM
-
2026-06-18days on market $92,700 Active 15 DOM
-
2026-06-17days on market $92,700 Active 14 DOM
-
2026-06-16days on market $92,700 Active 13 DOM
-
2026-06-15days on market $92,700 Active 12 DOM
-
2026-06-13days on market $92,700 Active 10 DOM
-
2026-06-13days on market $92,700 Active 9 DOM
-
2026-06-09days on market $92,700 Active 6 DOM
-
2026-06-08days on market $92,700 Active 5 DOM
-
2026-06-07days on market $92,700 Active 4 DOM
-
2026-06-05remarks 547-char remark
-
2026-06-05$92,700 Active 1 DOM
ⓘ Source: listings_history table (triggers on properties + properties_extension) + one-shot
backfill from property_details.listing_events for pre-trigger history.
Tax reassessment forecast MO · Resets to sale price
- Current annual tax
- $846 · $70/mo
- Projected year-2 tax
- $899 · $75/mo
- Expected delta
- +$53/yr (+$4/mo · 6.3%)
ⓘ Screening estimate from a state-policy table — verify with the county assessor before closing.
Climate risk First Street
- Flood 1/10 Low FEMA zone AE · 0% chance over 30 yrs
- Wildfire 1/10 Low
- Heat 5/10 Major 7 d/yr ≥107°F today · 20 d/yr by 30 yrs out
- Wind 2/10 Low 100% chance of damaging wind over 30 yrs
- Air quality 3/10 Moderate 3 unhealthy d/yr today · 5 by 30 yrs out
Nearby sold comps map
Loading sold comps map…
Walkable amenities ~0.75 mi
Loading nearby amenities…
Taxation est. · year 1
- Rental income
- $14,426
- − Mortgage interest
- −$5,193
- − Property taxes
- −$846
- − Insurance
- −$5,988
- − Repairs & maintenance
- −$1,154
- − Management
- −$1,154
- − Depreciation
- −$2,697
- Taxable loss
- −$2,606
- Est. tax savings @ 24.0%
- +$625
- After-tax cash flow
- $-646/yr
For passive investors: Depreciation is non-cash, so a rental often shows a tax loss while cash-flowing — sheltering income. Rental losses are passive: they offset passive income freely, and up to $25,000/yr can offset ordinary (W-2) income if you actively participate and your MAGI is under $100k (phasing out to $0 by $150k); unused losses carry forward. On sale, claimed depreciation is recaptured at up to 25%, and gains may owe capital-gains tax (a 1031 exchange can defer both). Figures are a year-1 estimate at your 24.0% rate — not tax advice; consult a CPA.
Schools (NCES district)
- District
- Riverview Gardens
- NCES district ID
- 2926670
- Math proficiency
- 2% ▼ -6.00%
- Reading proficiency
- 9% ▼ -6.00%
- Median HH income
- $32,759
- Composite
- 4.22/100
- National rank
- #10058
- State rank
- #324 of 324 in MO
Livability — Dellwood
- Score
- 66/100
- State rank
- #239
- US rank
- #11618
Category grades
Schools grade is shown separately in the Schools card above.
Census & demographics
- County
- Saint Louis County · 888,823 people
- Metro
- St. Louis, MO-IL
- Population (ZIP)
- 40,929
- Household income
- $41,154
- Rent vs Own
- Severe rent burden
- 3085.0
Population outlook (St. Louis County) Hauer SSP2
- Today (2025)
- 1,025,227 people
- By 2030
- 1,028,023 · +0.3%
- By 2040
- 1,020,940 · -0.4%
- By 2050
- 1,007,280 · -1.8%
- By 2075
- 987,277 · -3.7%
- By 2100
- 921,984 · -10.1%
Race, ethnicity, and origin ACS 2023
- Neighborhood character
- Predominantly Black (90%)
- Race & ethnicity
- Black 90% White 5% Two or more races 3%
- Foreign-born
- 1% · Canada
Political lean MEDSL · St. Louis
- 2024 margin
- Strong D (+23.4) · D 60.8% · R 37.4% · Other 1.7%
- 2008→2024 swing
- +3.5pp toward D · 2008: 19.9pp · 2024: 23.4pp
- All cycles
- 2024: D+23.4 2020: D+24.0 2016: D+16.2 2012: D+13.7 2008: D+19.9
Not yet ingested
- Civics
- —
Market trends
- HPI YoY
- ▲ 3.79%
- Current HPI
- 420.28
- Rent YoY
- ▲ 4.97%
- Metro
- St. Louis, MO-IL
- State GDP YoY
- ▲ 1.84%
- F500 in state
- 20
Industry mix (Fortune 500 HQ in MO)
| Industry | F500 HQs | Revenue |
|---|---|---|
| Healthcare | 1 | $163B |
|
||
| Insurance | 1 | $21B |
|
||
| Industrial Technology | 1 | $17B |
|
||
| Retail | 1 | $16B |
|
||
| Industrial Distribution | 1 | $10B |
|
||
| Utilities | 1 | $9B |
|
||
Price history
+62.9% since first listed2 events — show timeline
- 2026-06-03 Listed $92,700 MARIS as Distributed by MLS Grid
- 2000-09-20 Sold (Public Records) $56,900 Public Records
Property tax history
-0.7%/yrLatest (2022): $846 · +0.4% YoY. Source: county tax records.
Cash-flow waterfall
monthlySold comps — $/sqft
last 12 mo · ≤1 miLoading sold comps…