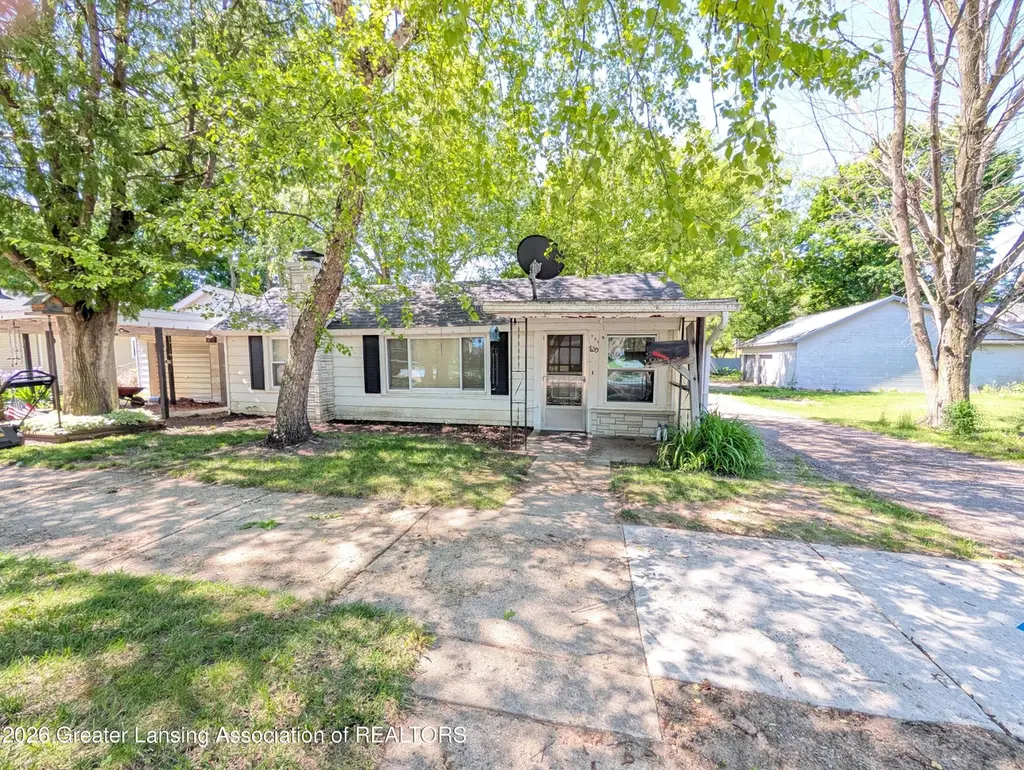
720 Brush St · Portland, MI
Flood risk 6/10 · Moderate
- FEMA flood zone
- X (unshaded)
- Chance of flooding over 30 yrs
- 0.75%
- Est. flood insurance / yr
- $473 – $860
Fire risk 1/10 · Minimal
- Est. fire insurance / yr
- $784 – $1,456
Heat risk 2/10 · Minimal
- Hot days now (above 97°F)
- 7 days/yr
- Hot days in 30 yrs
- 15 days/yr
Wind risk 2/10 · Minimal
- Chance of severe wind over 30 yrs
- —
Air-quality risk 2/10 · Minimal
- Unhealthy air days now
- 1 days/yr
- Unhealthy air days in 30 yrs
- 2 days/yr
Risk factors via First Street. Map © Google.
Why this score? — see what drove the B+ grade
The composite is a weighted blend of 9 inputs, each scored 0–100. Each bar is that input's sub-score; the figure is the points it added to the 100-point composite (weight × sub-score).
- Cash flow +29.3/30.0
- ARV discount +15.0/15.0
- DSCR +10.0/10.0
- 1% rule +8.6/10.0
- Livability +3.9/5.0
- Schools +3.6/10.0
- Rent growth +2.5/5.0
- Condition / age +2.5/5.0
- Appreciation +0.0/10.0
$99,900
🖨 Deal sheet (PDF) 📄 Offer letter ✓ Due diligence
Listing remarks MLS
Welcome to 720 Brush St. , a great opportunity to build equity and make this home your own. This property offers 2 bedrooms, 1 bathroom, and a 2-car garage, with the potential to be converted into a 3-bedroom home. Key updates include the roof, plumbing, electrical panel, and a new water service line from the street. Don't miss your chance to unlock this home's potential--schedule your showing today.
Key facts
- Plumbing
- Water service line
- Roof
Tags
Property features AI
Exterior
- Parking: Attached covered garage with 2 spaces
- Utilities: 100 amp electric service with circuit breakers; Public sewer
- Home design: Ranch-style single-story home; Built in 1940
- Construction: Aluminum siding
- Exterior features: Lot dimensions approximately 59.5 x 59; Approximately 0.08-acre lot; Garage(s) on property
Interior
- Kitchen: Electric range
- Bedrooms: Primary bedroom (17 x 9); Second bedroom (9.8 x 19.5)
- Bathrooms: 1 full bath
- Heating & cooling: Ductless heating; Ductless cooling
- Interior features: Partial basement; Dining room is a combo
- Laundry & utility: Main-level laundry; Gas water heater
Neighborhood map
What this means for you Summary
Snapshot
- This is a 2-bed/1.0-bath single-family listed at $100k.
Deal economics
- At list price, monthly cash flow is $350 ($4k/yr) — positive.
- The deal already cash-flows at list — no discount required.
- Meets the 1% rule at list price ($1k rent vs $100k).
- Recommended offer: $98k (1.5% below list) — sets the bar for market timing.
- Cap rate 10.5% vs local median 3.5% in Portland — top-decile yield for the area; either an underpriced asset or a hidden risk that comps aren't pricing in. Stress-test before assuming the spread holds.
Location & tenants
- Location reads 77/100 on livability (#121 in MI, #2,947 nationally) — a middle-class / working-renter tenant base. Strengths: crime A+, cost of living A+, housing A+; Watch: amenities F, commute F.
- Portland Public Schools (town): math 30% / reading 50% proficiency, ranked #191 of 540 in MI (top 35%) — families likely to look elsewhere, expect single-tenant / working-renter base with shorter leases.
- Market conditions: 46 active listings in the ZIP; solid renter incomes; 94 units permitted in Ionia County in 2024 (0 in 5+ unit buildings).
- This rent is only 17% of the median local income ($94k/yr) — well below the 30% rent-burden line; pricing power to push rent on renewal without tenant pushback.
Forward outlook
- Local home prices are declining (-3.0%/yr); year-one equity from $691 of loan paydown is wiped out by about $3k of value loss. Plan a longer hold.
- Ionia County population projected to shrink 8% by 2050 — rents likely to lag national; underwrite the cash flow, not the appreciation.
- At projected returns (-3.0% appreciation + 3.0% rent growth), your $28k cash investment doubles in ~8 years — after that, you're playing with house money.
Negotiation context
- It's been on market 21 days — a 2% lower offer ($98k) is reasonable based on typical stale-listing flexibility.
- 2 sale attempts with the ask held roughly flat each time — persistent listings suggest the price (not the market) is what's stuck; bring a comps-based counter.
Risks & watch-outs
- Watch-outs: built in 1940 — expect roof / HVAC / electrical / plumbing capex.
- Climate carrying-cost: major flood risk — expect insurance premiums to compound above CPI over the hold.
Questions for the listing agent
- Built in 1940 — when were the roof, HVAC, electrical panel, plumbing, and water heater last replaced?
- Is there a deadline driving the sale (1031 exchange, divorce, estate, relocation)? That informs how much negotiation room exists.
- What's the average days-on-market for RENTAL listings here right now (not sales)? A rising rental-DOM trend means longer vacancies and softer asking-rent achievability than the comps imply.
- What's the recent tenant-quality profile in this submarket — average credit score on applications, eviction rate, late-payment / NSF rate, and stable-employment percentage? A property-management company in the area should have these aggregated.
- How much new for-sale + rental construction is in the pipeline within 1–3 miles? Heavy new supply typically softens prices + rents 12–24 months out; constrained supply supports both.
Investment metrics
- 1% rule
- 1.36% ✓
- Cap rate
- 10.50%
- Cash-on-cash
- 15.01%
- DSCR
- 1.67
- GRM
- 6.1
CMA / ARV
- ARV (on-the-fly)
- $173,040
- Comps found
- 11
Show comp detail 11 sales within ~0.75 mi
| Address | Dist | Beds/Ba | Sqft | Sold | Price | $/sf | Match |
|---|---|---|---|---|---|---|---|
| 431 Smith St | 0.19mi | 3/1.0 (+1) | 1,095 (+6%) | 3mo | $209,000 | $191 | 73 |
| 515 E Grand River Ave | 0.38mi | 3/1.0 (+1) | 1,036 (+1%) | 4mo | $170,000 | $164 | 73 |
| 829 Academy St | 0.13mi | 2/1.0 | 958 (-7%) | 16mo | $130,000 | $136 | 69 |
| 348 Elm St | 0.29mi | 3/1.0 (+1) | 1,062 (+3%) | 11mo | $197,000 | $185 | 67 |
| 518 Looking Glass Ave | 0.54mi | 2/1.0 | 1,007 (-2%) | 23mo | $160,000 | $159 | 52 |
| 349 Bishop St | 0.63mi | 2/1.0 | 936 (-9%) | 13mo | $210,000 | $224 | 45 |
| 226 S Virginia | 0.50mi | 3/1.5 (+1) | 1,120 (+9%) | 14mo | $252,000 | $225 | 44 |
| 225 B St | 0.57mi | 3/1.0 (+1) | 1,120 (+9%) | 14mo | $180,000 | $161 | 42 |
| 612 W Grand River Ave | 0.73mi | 3/1.0 (+1) | 1,129 (+10%) | 4mo | $212,500 | $188 | 41 |
| 447 Divine Hwy | 0.67mi | 2/1.0 | 1,184 (+15%) | 9mo | $187,760 | $159 | 36 |
| 133 Island St | 0.48mi | 2/1.0 | 890 (-14%) | 22mo | $149,900 | $168 | 36 |
Match score weights: distance 35% · size 25% · config 20% · recency 20%. Top-matched comps best support the ARV.
Projected returns pro-forma
-3.0% appreciation · 3.0% rent growth · sell at horizon
- IRR
- 5.6%
- Equity multiple
- 1.22×
- Total profit
- $6,140
- Equity at exit
- $14,895
- IRR
- 15.1%
- Equity multiple
- 2.22×
- Total profit
- $34,216
- Equity at exit
- $8,638
Cash invested: $27,972 (down + closing). Projections, not guarantees.
Landlord ↔ Tenant lean methodology
- Overall (STATE)
- 62 Landlord-Friendly
- State Michigan
- 62 Landlord-Friendly · EVEN
- County
- — inherits STATE
- City
- — inherits STATE
ZIP-level market 48875
- Home prices YoY
- -29.5%
- Active inventory
- 46
- Price-to-rent
- 6.1×
Monthly cashflow live
- Estimated rent
- $1,363 medium interval (Pro) →
- Mortgage (P&I)
- −$524
- Tax from tax record
- −$161 /mo · $1,937/yr
- Insurance
- −$42
- HOA
- −$0
- Vacancy / Maint / Mgmt
- −$286
- Net cashflow
- $350
Break-even live
Sensitivity live
| Price | -10% $406 | -5% $378 | +0% $350 | +5% $322 | +10% $293 |
|---|---|---|---|---|---|
| Rent | -10% $242 | -5% $296 | +0% $350 | +5% $404 | +10% $458 |
| Rate | -1.0pp $400 | -0.5pp $375 | base $350 | +0.5pp $324 | +1.0pp $298 |
UW: 25.0% down · 7.5% · 30yr · 1.5% tax · 5.0% vac · 8.0% maint · 8.0% mgmt
Financing live
Cash to close
- Down payment
- $24,975
- Closing costs
- $2,997
- Reserves months
- —
- Total cash needed
- —
Loan-product check · same deal, 3 products live
Conventional
25% down · 7.5% · 30yr
- Down + closing
- —
- Monthly P&I
- —
- Monthly cashflow
- —
- DSCR
- —
- Eligible?
- —
Personal DTI + credit; lowest rate.
DSCR
20% down · 8.5% · 30yr
- Down + closing
- —
- Monthly P&I
- —
- Monthly cashflow
- —
- DSCR
- —
- Eligible?
- —
No personal income docs; deal must DSCR.
Hard money
10% down · 12.0% · 12mo
- Down + closing
- —
- Monthly P&I
- —
- Monthly cashflow
- —
- DSCR
- —
- Eligible?
- —
Short-term bridge; refi at stabilization.
Listing history 17 events
-
2026-06-18days on market $99,900 Active 21 DOM
-
2026-06-17days on market $99,900 Active 20 DOM
-
2026-06-16days on market $99,900 Active 19 DOM
-
2026-06-15days on market $99,900 Active 18 DOM
-
2026-06-14days on market $99,900 Active 16 DOM
-
2026-06-10days on market $99,900 Active 13 DOM
-
2026-06-09days on market $99,900 Active 12 DOM
-
2026-06-08days on market $99,900 Active 11 DOM
-
2026-06-07days on market $99,900 Active 10 DOM
-
2026-06-05days on market $99,900 Active 7 DOM
-
2026-06-03days on market $99,900 Active 6 DOM
-
2026-06-02days on market $99,900 Active 5 DOM
-
2026-06-01days on market $99,900 Active 4 DOM
-
2026-05-31days on market $99,900 Active 3 DOM
-
2026-05-30days on market $99,900 Active 2 DOM
-
2026-05-27$99,900 Active
Show marketing remark (403 chars)
Welcome to 720 Brush St. , a great opportunity to build equity and make this home your own. This property offers 2 bedrooms, 1 bathroom, and a 2-car garage, with the potential to be converted into a 3-bedroom home. Key updates include the roof, plumbing, electrical panel, and a new water service line from the street. Don't miss your chance to unlock this home's potential--schedule your showing today.
-
2026-05-27$99,900 Active 403-char remark
Show marketing remark (403 chars)
Welcome to 720 Brush St. , a great opportunity to build equity and make this home your own. This property offers 2 bedrooms, 1 bathroom, and a 2-car garage, with the potential to be converted into a 3-bedroom home. Key updates include the roof, plumbing, electrical panel, and a new water service line from the street. Don't miss your chance to unlock this home's potential--schedule your showing today.
ⓘ Source: listings_history table (triggers on properties + properties_extension) + one-shot
backfill from property_details.listing_events for pre-trigger history.
Tax reassessment forecast MI · Partial reset (capped growth)
- Current annual tax
- $1,937 · $161/mo
- Projected year-2 tax
- $1,937 · $161/mo
- Expected delta
- $0/yr ($0/mo · 0.0%)
ⓘ Screening estimate from a state-policy table — verify with the county assessor before closing.
Climate risk First Street
- Flood 6/10 Major FEMA zone X (unshaded) · 75% chance over 30 yrs
- Wildfire 1/10 Low
- Heat 2/10 Low 7 d/yr ≥97°F today · 15 d/yr by 30 yrs out
- Wind 2/10 Low
- Air quality 2/10 Low 1 unhealthy d/yr today · 2 by 30 yrs out
Nearby sold comps map
Loading sold comps map…
Walkable amenities ~0.75 mi
Loading nearby amenities…
Taxation est. · year 1
- Rental income
- $16,357
- − Mortgage interest
- −$5,596
- − Property taxes
- −$1,937
- − Insurance
- −$500
- − Repairs & maintenance
- −$1,309
- − Management
- −$1,309
- − Depreciation
- −$2,906
- Taxable income
- $2,801
- Est. tax owed @ 24.0%
- −$672
- After-tax cash flow
- $3,526/yr
For passive investors: Depreciation is non-cash, so a rental often shows a tax loss while cash-flowing — sheltering income. Rental losses are passive: they offset passive income freely, and up to $25,000/yr can offset ordinary (W-2) income if you actively participate and your MAGI is under $100k (phasing out to $0 by $150k); unused losses carry forward. On sale, claimed depreciation is recaptured at up to 25%, and gains may owe capital-gains tax (a 1031 exchange can defer both). Figures are a year-1 estimate at your 24.0% rate — not tax advice; consult a CPA.
Schools (NCES district)
- District
- Portland Public Schools
- NCES district ID
- 2629120
- Math proficiency
- 30% ▼ -9.00%
- Reading proficiency
- 50% ▼ -8.00%
- Median HH income
- $61,869
- Composite
- 35.55/100
- National rank
- #4905
- State rank
- #191 of 540 in MI
Livability — Portland
- Score
- 77/100
- State rank
- #121
- US rank
- #2947
Category grades
Schools grade is shown separately in the Schools card above.
Census & demographics
- Census place
- Portland, MI
- County
- Ionia County · 11,400 people
- City population
- 11,400
- Metro
- Grand Rapids-Kentwood, MI
- Population (ZIP)
- 11,400
- Household income
- $94,216
- Rent vs Own
- Severe rent burden
- 161.0
Population outlook (Ionia County) Hauer SSP2
- Today (2025)
- 63,958 people
- By 2030
- 63,321 · -1.0%
- By 2040
- 61,544 · -3.8%
- By 2050
- 58,682 · -8.2%
- By 2075
- 48,909 · -23.5%
- By 2100
- 35,867 · -43.9%
Race, ethnicity, and origin ACS 2023
- Neighborhood character
- Predominantly White (90%)
- Race & ethnicity
- White 90% Two or more races 6% Hispanic / Latino 3% Asian 2%
- Common ancestry
- Iranian 6% Romanian 6% Slovak 2%
- Foreign-born
- 1%
- Languages at home
- 99% English-only · Spanish 1%
Political lean MEDSL · Ionia
- 2024 margin
- Solid R (+31.9) · D 33.3% · R 65.2% · Other 1.5%
- 2008→2024 swing
- -26.0pp toward R · 2008: -5.8pp · 2024: -31.9pp
- All cycles
- 2024: R+31.9 2020: R+30.3 2016: R+31.0 2012: R+12.8 2008: R+5.8
Not yet ingested
- Civics
- —
Market trends
- HPI YoY
- ▼ -103.69%
- Current HPI
- 248.2974
- Rent YoY
- —
- Metro
- Grand Rapids-Kentwood, MI
- State GDP YoY
- ▲ 1.37%
- F500 in state
- 28
Industry mix (Fortune 500 HQ in MI)
| Industry | F500 HQs | Revenue |
|---|---|---|
| Automotive Parts | 3 | $48B |
|
||
| Automotive | 2 | $372B |
|
||
| Chemicals | 1 | $45B |
|
||
| Automotive Retail | 1 | $29B |
|
||
| Healthcare / Medical Devices | 1 | $23B |
|
||
| Automotive Technology | 1 | $20B |
|
||
Price history
+0.0% since first listed2 events — show timeline
- 2026-05-27 Listed $99,900 REALCOMP
- 2026-05-27 Listed $99,900 Greater Lansing AoR
Property tax history
+6.1%/yrLatest (2025): $1,937 · +49.3% YoY. Source: county tax records.
Cash-flow waterfall
monthlySold comps — $/sqft
last 12 mo · ≤1 miLoading sold comps…