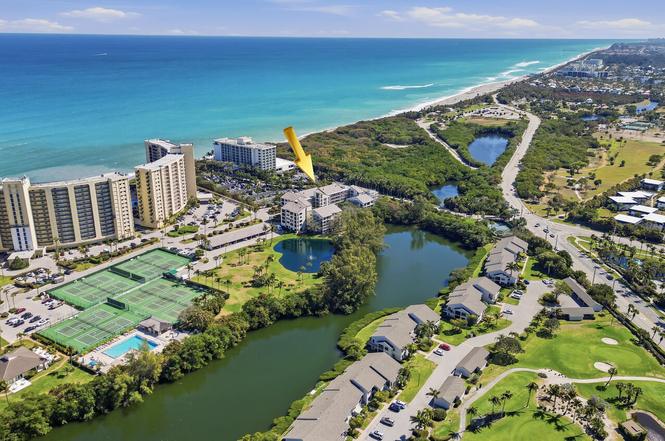
500 Ocean Trail Way #111 · Jupiter, FL
Flood risk 9/10 · Severe
- FEMA flood zone
- X (unshaded)
- Chance of flooding over 30 yrs
- 0.99%
- Est. flood insurance / yr
- $507 – $1,088
Fire risk 1/10 · Minimal
- Est. fire insurance / yr
- $947 – $1,759
Heat risk 10/10 · Severe
- Hot days now (above 106°F)
- 7 days/yr
- Hot days in 30 yrs
- 23 days/yr
Wind risk 10/10 · Severe
- Chance of severe wind over 30 yrs
- 99.0%
Air-quality risk 2/10 · Minimal
- Unhealthy air days now
- 1 days/yr
- Unhealthy air days in 30 yrs
- 2 days/yr
Risk factors via First Street. Map © Google.
Why this score? — see what drove the C grade
The composite is a weighted blend of 9 inputs, each scored 0–100. Each bar is that input's sub-score; the figure is the points it added to the 100-point composite (weight × sub-score).
- Cash flow +14.1/30.0
- 1% rule +10.0/10.0
- ARV discount +7.5/15.0
- Appreciation +6.5/10.0
- Rent growth +5.0/5.0
- DSCR +4.3/10.0
- Schools +4.3/10.0
- Livability +3.5/5.0
- Condition / age +2.5/5.0
$389,000
🖨 Deal sheet 📄 Offer letter ✓ Due diligence
Listing remarks
Location! Location! Motivated seller! Walk to many restaurants, Maltz Theater, Cinopolis and Publix. This 2/2 first floor condo has private estuary view. Handyman Special! Building is only 300 steps to the private beach. (no crossing hwy to reach beach) Property needs TLC. Original decor . Building has undergone major renovations. New roof 2024, concrete restoration 2025 of patios and foundation. Walkways and railings being redone and building being painted now. All special assessments will be paid and building has reserves. Priced to sell!
Key facts
- Concrete restoration
- Private beach
- Major renovations
Tags
Neighborhood map
What this means for you Summary
Snapshot
- This is a 2-bed/2.0-bath condo listed at $389k.
Deal economics
- At list price, monthly cash flow is $-8 ($-98/yr) — negative.
- To cash-flow at today's rent, offer at most $388k (0.4% below list).
- Meets the 1% rule at list price ($6k rent vs $389k).
- Recommended offer: $342k (12.0% below list) — sets the bar for market timing.
- Cap rate 6.5% vs local median 2.6% in Jupiter — top-decile yield for the area; either an underpriced asset or a hidden risk that comps aren't pricing in. Stress-test before assuming the spread holds.
Location & tenants
- Location reads 70/100 on livability (#415 in FL) — a middle-class / working-renter tenant base. Strengths: crime A+, employment A+, housing A+; Watch: amenities F, commute F, cost of living F.
- Palm Beach (suburban): math 46% / reading 53% proficiency, ranked #34 of 73 in FL (top 47%) — families likely to look elsewhere, expect single-tenant / working-renter base with shorter leases.
- Zoned schools: Jupiter Elementary School (math 53% / reading 47%, grade D+, #1,070 of 2,144 statewide, top 51%, 832 students, 69% FRL); Jupiter Middle School (math 62% / reading 63%, grade B+, #116 of 571 statewide, top 21%, 1,384 students, 38% FRL); Jupiter High School (math 56% / reading 64%, grade C+, #106 of 667 statewide, top 16%, 3,087 students, 28% FRL).
- Market conditions: Rents rising fast (+10.3%/yr); 337 active listings in the ZIP; 40 comparable units currently listed for rent nearby; rentals at typical pace (median 24d on market — plan ~3-4 weeks tenant-placement turnaround); solid renter incomes; 3,974 units permitted in Palm Beach County in 2024 (1,012 in 5+ unit buildings).
Forward outlook
- In year one you build about $14k of equity ($3k loan paydown + $11k appreciation (2.9% local appreciation)).
- Palm Beach County population projected at +30% by 2050 — long-run rental-demand tailwind backs the buy-and-hold thesis.
- At projected returns (2.9% appreciation + 8.0% rent growth), your $109k cash investment doubles in ~5 years — after that, you're playing with house money.
- By year 3, paydown + projected appreciation supports a ~$35k cash-out refi (75% LTV) — recoverable capital for the next deal without selling this one.
Negotiation context
- It's been on market 134 days — a 12% lower offer ($342k) is reasonable based on typical stale-listing flexibility.
- Current owner paid $125k; list at $389k implies a 211% gain — meaningful room to come down on a strong offer.
Risks & watch-outs
- Watch-outs: flood insurance adds $66/mo; HOA is 31% of rent.
- Climate carrying-cost: severe flood risk; severe wind risk, 99% chance of damaging wind over 30y; extreme-heat days projected 7→23/yr by 2055 (HVAC capex compounding) — expect insurance premiums to compound above CPI over the hold.
Questions for the listing agent
- What do current leases actually rent for vs. the listed asking? Can we see a recent rent roll and the last 12 months of T-12 income?
- It's been on market 134 days. Have you received any prior offers? Is the seller open to a 12% concession, seller financing, or rate buy-down credit?
- What's the actual annual flood-insurance premium (NFIP or private), and is the property in a SFHA with mandatory coverage?
- What does the HOA fee cover, when was the last increase, and are there any pending special assessments or reserve-fund shortfalls?
- Any open or pending special assessments — roof, HVAC, plumbing, elevator, façade? What's the per-unit balance and payoff schedule, and is the seller paying it off at close or rolling it to the buyer?
- Why hasn't it sold? Are there any deal-killer items the seller is aware of (foundation, flood, title, zoning, code violations)?
- Is there a deadline driving the sale (1031 exchange, divorce, estate, relocation)? That informs how much negotiation room exists.
- Schools are A-rated — typically a magnet for longer-tenancy family renters. What's the average tenant stay here, and is there a school-zone premium baked into asking?
- What's the average days-on-market for RENTAL listings here right now (not sales)? A rising rental-DOM trend means longer vacancies and softer asking-rent achievability than the comps imply.
- What's the recent tenant-quality profile in this submarket — average credit score on applications, eviction rate, late-payment / NSF rate, and stable-employment percentage? A property-management company in the area should have these aggregated.
- How much new apartment / multifamily construction is in the pipeline within 1–3 miles? Heavy new supply (>2% of stock underway) typically softens rents 12–24 months out; light construction supports rent growth.
Investment metrics
- 1% rule
- 1.51% ✓
- Cap rate
- 6.47%
- Cash-on-cash
- 0.64%
- DSCR
- 1.03
- GRM
- 5.5
CMA / ARV
No comps found within radius.
Projected returns pro-forma
2.93% appreciation · 8.0% rent growth · sell at horizon
- IRR
- 11.9%
- Equity multiple
- 1.71×
- Total profit
- $77,315
- Equity at exit
- $173,344
- IRR
- 18.1%
- Equity multiple
- 4.10×
- Total profit
- $337,639
- Equity at exit
- $265,931
Cash invested: $108,920 (down + closing). Projections, not guarantees.
Landlord ↔ Tenant lean methodology
- Overall (STATE)
- 87 Strongly Landlord-Friendly
- State Florida
- 87 Strongly Landlord-Friendly · R+3
- County
- — inherits STATE
- City
- — inherits STATE
ZIP-level market 33477
- Home prices YoY
- 0.8%
- Rents YoY
- 10.3%
- Active inventory
- 337
- Price-to-rent
- 5.5×
Monthly cashflow live
- Estimated rent
- $5,893 high interval (Pro) →
- Mortgage (P&I)
- −$2,040
- Tax from tax record
- −$593 /mo · $7,116/yr
- Insurance
- −$162
- Flood insurance flood zone
- −$66 /mo · $798/yr
- HOA
- −$1,802
- Vacancy / Maint / Mgmt
- −$1,238
- Net cashflow
- $-8
Break-even live
UW: 25.0% down · 7.5% · 30yr · 1.5% tax · 5.0% vac · 8.0% maint · 8.0% mgmt
Financing live
Cash to close
- Down payment
- $97,250
- Closing costs
- $11,670
- Reserves months
- —
- Total cash needed
- —
Loan-product check · same deal, 3 products live
Conventional
25% down · 7.5% · 30yr
- Down + closing
- —
- Monthly P&I
- —
- Monthly cashflow
- —
- DSCR
- —
- Eligible?
- —
Personal DTI + credit; lowest rate.
DSCR
20% down · 8.5% · 30yr
- Down + closing
- —
- Monthly P&I
- —
- Monthly cashflow
- —
- DSCR
- —
- Eligible?
- —
No personal income docs; deal must DSCR.
Hard money
10% down · 12.0% · 12mo
- Down + closing
- —
- Monthly P&I
- —
- Monthly cashflow
- —
- DSCR
- —
- Eligible?
- —
Short-term bridge; refi at stabilization.
Rent comps 40 comps
| Address | Beds | Baths | Sqft | Rent | $/sqft | DOM | Units | Dist |
|---|---|---|---|---|---|---|---|---|
| 500 Ocean Trail Way Jupiter, FL | 2.0 | 2.0 | 1523 | $6,150 | $4.04 | 24d | 1 | 0.01mi |
| 100 Ocean Trail Way #609 Jupiter, FL | 2.0 | 2.0 | 1170 | $8,500 | $7.26 | 24d | 1 | 0.06mi |
| 100 Ocean Trail Way Jupiter, FL | 2.0 | 2.0 | 1170 | $4,000 | $3.42 | 24d | 1 | 0.06mi |
| 200 Ocean Trail Way #609 Jupiter, FL | 2.0 | 2.0 | 1170 | $9,500 | $8.12 | 24d | 1 | 0.11mi |
| 200 Ocean Trail Way #1105 Jupiter, FL | 2.0 | 2.0 | 1170 | $4,100 | $3.50 | 24d | 1 | 0.11mi |
| 200 Ocean Trail Way #1107 Jupiter, FL | 2.0 | 2.0 | 1170 | $4,250 | $3.63 | 24d | 1 | 0.11mi |
| 200 Ocean Trail Way #407 Jupiter, FL | 2.0 | 2.0 | 1170 | $8,500 | $7.26 | 22d | 1 | 0.11mi |
| 200 Ocean Trail Way #1108 Jupiter, FL | 2.0 | 2.0 | 1170 | $10,000 | $8.55 | 19d | 1 | 0.11mi |
| 200 Ocean Trail Way #1108 Jupiter, FL | 2.0 | 2.0 | 1170 | $10,000 | $8.55 | 10d | 1 | 0.11mi |
| 200 Ocean Trail Way #609 Jupiter, FL | 2.0 | 2.0 | 1170 | $9,500 | $8.12 | 10d | 1 | 0.11mi |
| 300 Ocean Trail Way #308 Jupiter, FL | 2.0 | 2.0 | 1170 | $3,800 | $3.25 | 17d | 1 | 0.15mi |
| 300 Ocean Trail Way #903 Jupiter, FL | 2.0 | 2.0 | 1170 | $6,000 | $5.13 | 19d | 1 | 0.15mi |
| 300 Ocean Trail Way #410 Jupiter, FL | 2.0 | 2.0 | 1270 | $4,500 | $3.54 | 5d | 1 | 0.15mi |
| 300 Ocean Trail Way #403 Jupiter, FL | 2.0 | 2.0 | 1170 | $3,450 | $2.95 | 17d | 1 | 0.15mi |
| 300 Ocean Trail Way #607 Jupiter, FL | 2.0 | 2.0 | 1170 | $9,500 | $8.12 | 24d | 1 | 0.15mi |
| 300 Ocean Trail Way #702 Jupiter, FL | 3.0 | 2.0 | 1170 | $13,000 | $11.11 | 24d | 1 | 0.15mi |
| 300 Ocean Trail Way #702 Jupiter, FL | 3.0 | 2.0 | 1170 | $13,000 | $11.11 | 10d | 1 | 0.15mi |
| 300 Ocean Trail Way #907 Jupiter, FL | 2.0 | 2.0 | 1170 | $5,500 | $4.70 | 24d | 1 | 0.15mi |
| 300 Ocean Trail Way #1202 Jupiter, FL | 2.0 | 2.0 | 1170 | $4,500 | $3.85 | 24d | 1 | 0.15mi |
| 300 Ocean Trail Way #602 Jupiter, FL | 2.0 | 2.0 | 1170 | $3,500 | $2.99 | 24d | 1 | 0.15mi |
| 300 Ocean Trail Way #510 Jupiter, FL | 2.0 | 2.0 | 1270 | $8,500 | $6.69 | 15d | 1 | 0.15mi |
| 400 Ocean Trail Way #401 Jupiter, FL | 2.0 | 2.0 | 1270 | $11,000 | $8.66 | 10d | 1 | 0.22mi |
| 400 Ocean Trail Way #401 Jupiter, FL | 2.0 | 2.0 | 1270 | $11,000 | $8.66 | 24d | 1 | 0.22mi |
| 400 Ocean Trail Way #101 Jupiter, FL | 2.0 | 2.0 | 1270 | $4,500 | $3.54 | 24d | 1 | 0.22mi |
| 400 Ocean Trail Way #707 Jupiter, FL | 2.0 | 2.0 | 1170 | $8,500 | $7.26 | 24d | 1 | 0.22mi |
| 400 Ocean Trail Way #804 Jupiter, FL | 2.0 | 2.0 | 1170 | $2,950 | $2.52 | 22d | 1 | 0.22mi |
| 400 Ocean Trail Way #804 Jupiter, FL | 2.0 | 2.0 | 1170 | $2,950 | $2.52 | 24d | 1 | 0.22mi |
| 803 Clubhouse Cir Jupiter, FL | 2.0 | 2.0 | 1280 | $2,500 | $1.95 | 24d | 1 | 0.27mi |
| 131 Palm Ave #36 Jupiter, FL | 2.0 | 2.0 | 1321 | $3,700 | $2.80 | 24d | 1 | 0.27mi |
| 404 Clubhouse Cir Jupiter, FL | 2.0 | 2.0 | 1280 | $3,500 | $2.73 | 15d | 1 | 0.29mi |
| 2309 Fairway Dr S Jupiter, FL | 2.0 | 2.0 | 1530 | $2,800 | $1.83 | 7d | 1 | 0.29mi |
| 404 Clubhouse Cir Jupiter, FL | 2.0 | 2.0 | 1280 | $7,500 | $5.86 | 24d | 1 | 0.29mi |
| 2309 Fairway Dr S Unit 2309 Jupiter, FL | 2.0 | 2.0 | 1530 | $2,800 | $1.83 | 24d | 1 | 0.29mi |
| 275 Palm Ave Jupiter, FL | 1.0–2.0 | 1.5–2.0 | 1075 | $5,800 | $5.40 | 7d | 6 | 0.30mi |
| 275 Palm Ave Jupiter, FL | 1.0–2.0 | 1.5–2.0 | 1075 | $5,800 | $5.40 | 5d | 6 | 0.30mi |
| 275 Palm Ave Jupiter, FL | 1.0–2.0 | 1.5–2.0 | 1075 | $5,800 | $5.40 | 3d | 6 | 0.30mi |
| 300 N Highway A1A Unit 405H Jupiter, FL | 2.0 | 2.0 | 1520 | $2,500 | $1.64 | 24d | 1 | 0.39mi |
| 2707 Fairway Dr N Jupiter, FL | 2.0 | 2.5 | 1195 | $2,800 | $2.34 | 24d | 1 | 0.42mi |
| 2403 Fairway Dr N Jupiter, FL | 2.0 | 2.5 | 1195 | $4,000 | $3.35 | 24d | 1 | 0.42mi |
| 2905 Fairway Dr N Jupiter, FL | 2.0 | 2.5 | 1195 | $7,500 | $6.28 | 24d | 1 | 0.42mi |
HOA detail condo
- Monthly dues
- $1,802 · $21,624/yr
- Assessments
- None detected in remarks — confirm with the listing agent.
Listing history 5 events
-
2026-04-15status Pending
-
2026-02-23price $389,000
-
2025-12-02$392,000 Active
-
1988-03-01soldstatus $125,000
-
1987-12-01soldstatus $123,000
ⓘ Source: listings_history table (triggers on properties + properties_extension) + one-shot
backfill from property_details.listing_events for pre-trigger history.
Tax reassessment forecast FL · Resets to sale price
- Current annual tax
- $7,116 · $593/mo
- Projected year-2 tax
- $7,116 · $593/mo
- Expected delta
- $0/yr ($0/mo · 0.0%)
ⓘ Screening estimate from a state-policy table — verify with the county assessor before closing.
Climate risk First Street
- Flood 9/10 Extreme FEMA zone X (unshaded) · 99% chance over 30 yrs
- Wildfire 1/10 Low
- Heat 10/10 Extreme 7 d/yr ≥106°F today · 23 d/yr by 30 yrs out
- Wind 10/10 Extreme 99% chance of damaging wind over 30 yrs
- Air quality 2/10 Low 1 unhealthy d/yr today · 2 by 30 yrs out
Nearby sold comps map
Loading sold comps map…
Walkable amenities ~0.75 mi
Loading nearby amenities…
Taxation est. · year 1
- Rental income
- $70,714
- − Mortgage interest
- −$21,790
- − Property taxes
- −$7,116
- − Insurance
- −$2,742
- − Repairs & maintenance
- −$5,657
- − Management
- −$5,657
- − HOA
- −$21,624
- − Depreciation
- −$11,316
- Taxable loss
- −$5,189
- Est. tax savings @ 24.0%
- +$1,245
- After-tax cash flow
- $1,148/yr
For passive investors: Depreciation is non-cash, so a rental often shows a tax loss while cash-flowing — sheltering income. Rental losses are passive: they offset passive income freely, and up to $25,000/yr can offset ordinary (W-2) income if you actively participate and your MAGI is under $100k (phasing out to $0 by $150k); unused losses carry forward. On sale, claimed depreciation is recaptured at up to 25%, and gains may owe capital-gains tax (a 1031 exchange can defer both). Figures are a year-1 estimate at your 24.0% rate — not tax advice; consult a CPA.
Schools (NCES district)
- District
- Palm Beach
- NCES district ID
- 1201500
- Math proficiency
- 46% ▼ -16.00%
- Reading proficiency
- 53% ▼ -4.00%
- Median HH income
- $53,943
- Composite
- 42.72/100
- National rank
- #3160
- State rank
- #34 of 73 in FL
Livability — Jupiter
- Score
- 70/100
- State rank
- #415
- US rank
- #7386
Category grades
Schools grade is shown separately in the Schools card above.
Census & demographics
- Census place
- Jupiter, FL
- County
- Palm Beach County · 1,438,312 people
- City population
- 68,420
- Metro
- Miami-Fort Lauderdale-Pompano Beach, FL
- Population (ZIP)
- 12,908
- Household income
- $104,992
- Rent vs Own
- Severe rent burden
- 445.0
Population outlook (Palm Beach County) Hauer SSP2
- Today (2025)
- 1,637,487 people
- By 2030
- 1,743,255 · +6.5%
- By 2040
- 1,948,712 · +19.0%
- By 2050
- 2,132,979 · +30.3%
- By 2075
- 2,530,027 · +54.5%
- By 2100
- 2,706,979 · +65.3%
Race, ethnicity, and origin ACS 2023
- Neighborhood character
- Predominantly White (93%)
- Race & ethnicity
- White 93% Hispanic / Latino 5% Two or more races 4%
- Hispanic origin (detail)
- Common ancestry
- Romanian 6% Scotch-Irish 4% Lithuanian 2%
- Foreign-born
- 10% · Canada, Guatemala, Jamaica
- Languages at home
- 90% English-only · Spanish 5% Other Indo-European 2% German/W. Germanic 1%
Political lean MEDSL · Palm Beach
- 2024 margin
- Toss-up / Even · D 50.0% · R 49.2%
- 2008→2024 swing
- -22.1pp toward R · 2008: 22.9pp · 2024: 0.8pp
- All cycles
- 2024: D+0.8 2020: D+12.8 2016: D+15.3 2012: D+17.0 2008: D+22.9
Not yet ingested
- Civics
- —
Market trends
- HPI YoY
- ▲ 2.93%
- Current HPI
- 356.212
- Rent YoY
- ▲ 10.27%
- Metro
- Miami-Fort Lauderdale-Pompano Beach, FL
- State GDP YoY
- ▲ 3.28%
- F500 in state
- 36
Industry mix (Fortune 500 HQ in FL)
| Industry | F500 HQs | Revenue |
|---|---|---|
| Industrial Technology | 2 | $29B |
|
||
| Insurance | 2 | $17B |
|
||
| Retail | 1 | $60B |
|
||
| Technology Distribution | 1 | $58B |
|
||
| Homebuilding | 1 | $35B |
|
||
| Technology Manufacturing | 1 | $35B |
|
||
Price history
+216.3% since first listed5 events — show timeline
- 2026-04-15 Pending — Beaches MLS
- 2026-02-23 Price Changed $389,000 Beaches MLS
- 2025-12-02 Listed $392,000 Beaches MLS
- 1988-03-01 Sold (Public Records) $125,000 Public Records
- 1987-12-01 Sold (Public Records) $123,000 Public Records
Property tax history
+2.6%/yrLatest (2025): $7,116 · +3.1% YoY. Source: county tax records.
Cash-flow waterfall
monthlySold comps — $/sqft
last 12 mo · ≤1 miLoading sold comps…