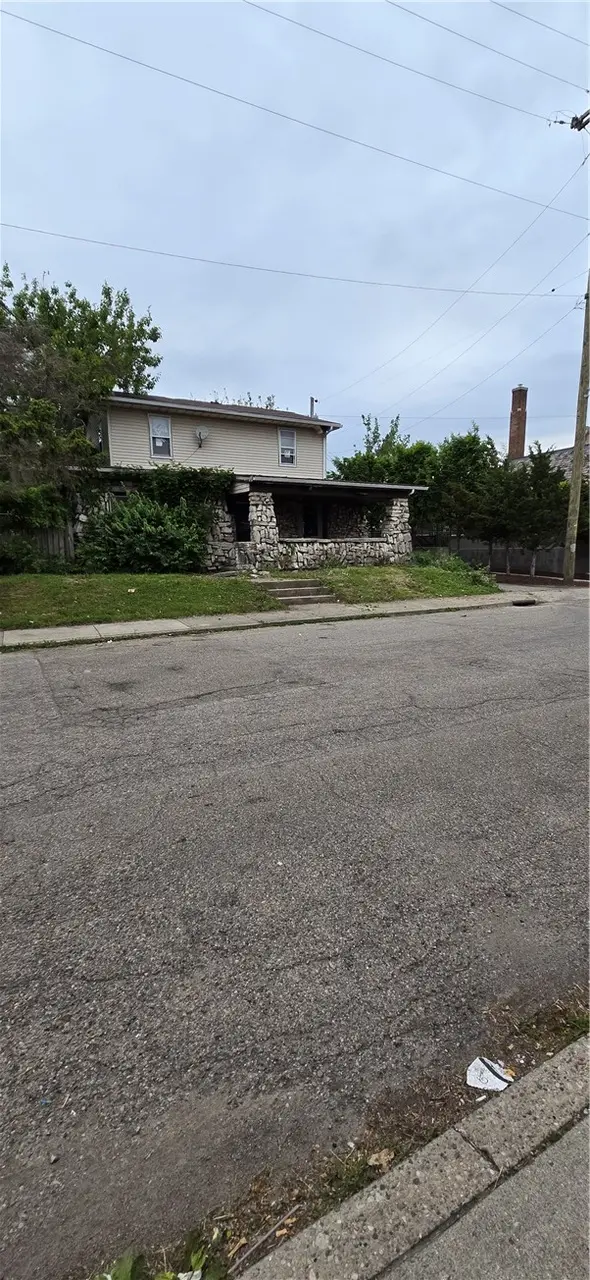
215 Edmund St · Dayton, OH
Flood risk No data
- FEMA flood zone
- —
- Chance of flooding over 30 yrs
- —
- Est. flood insurance / yr
- —
Fire risk No data
- Est. fire insurance / yr
- —
Heat risk No data
- Hot days now (above threshold)
- —
- Hot days in 30 yrs
- —
Wind risk No data
- Chance of severe wind over 30 yrs
- —
Air-quality risk No data
- Unhealthy air days now
- —
- Unhealthy air days in 30 yrs
- —
Risk factors via First Street. Map © Google.
Why this score? — see what drove the B- grade
The composite is a weighted blend of 9 inputs, each scored 0–100. Each bar is that input's sub-score; the figure is the points it added to the 100-point composite (weight × sub-score).
- Cash flow +30.0/30.0
- 1% rule +10.0/10.0
- DSCR +10.0/10.0
- ARV discount +7.5/15.0
- Livability +3.2/5.0
- Rent growth +2.5/5.0
- Condition / age +2.5/5.0
- Schools +1.3/10.0
- Appreciation +0.0/10.0
$59,950
🖨 Deal sheet 📄 Offer letter ✓ Due diligence
Listing remarks MLS
Fixer upper with solid bones. 3 bedroom 1 bathroom home in old north dayton in need of updates throughout. Property is being sold as is - no repairs to be made - Cash or hard money only.
Key facts
- Community amenities
- Two-story layout
- Built 1910
Tags
Property features AI
Finance
- Other: Residential zoning; Directions: From OH-4, take Stanley Ave east. Turn right on Troy St, then right on Edmund St. Property on left just past Maryland Ave intersection.
- HOA & community: No HOA
Exterior
- Utilities: Public water; Public sewer
- Home design: Contemporary/Modern single-family home; Two levels
- Construction: Block and other foundation
- Exterior features: Shingle roof; Aluminum siding and stone exterior; Windows: Other
Interior
- Bathrooms: One full bathroom (primary bathroom: other)
- Interior features: Five total rooms; Full basement
Neighborhood map
What this means for you Summary
Snapshot
- This is a 3-bed/2.0-bath single-family listed at $60k.
Deal economics
- At list price, monthly cash flow is $590 ($7k/yr) — positive.
- The deal already cash-flows at list — no discount required.
- Meets the 1% rule at list price ($1k rent vs $60k).
- Cap rate 18.1% vs local median 7.4% in Dayton — top-decile yield for the area; either an underpriced asset or a hidden risk that comps aren't pricing in. Stress-test before assuming the spread holds.
Location & tenants
- Location reads 65/100 on livability (#716 in OH) — a middle-class / working-renter tenant base. Strengths: cost of living A+, housing A+, health & safety A; Watch: schools C-, amenities C-, crime F.
- Dayton City (urban): math 12% / reading 21% proficiency, ranked #641 of 656 in OH (top 98%) — low school quality limits family demand, transient renter base, plan for 1-2y turnover; 74% free/reduced lunch — lower-income household profile, screen leases tightly.
- Market conditions: 66 active listings in the ZIP; 18 comparable units currently listed for rent nearby; rentals at typical pace (median 24d on market — plan ~3-4 weeks tenant-placement turnaround); lower-income renter base — watch delinquency; 907 units permitted in Montgomery County in 2024 (416 in 5+ unit buildings).
- This rent runs 40% of the median local income ($39k/yr) — at the standard rent-burdened threshold; future hikes will face affordability resistance.
Forward outlook
- Local home prices are declining (-3.0%/yr); year-one equity from $414 of loan paydown is wiped out by about $2k of value loss. Plan a longer hold.
- Montgomery County population projected at -10% by 2050 — secular population decline; favor cash flow + early exit over multi-decade hold.
- At projected returns (-3.0% appreciation + 3.0% rent growth), your $17k cash investment doubles in ~3 years — after that, you're playing with house money.
Negotiation context
- Only 2 days on market — expect competitive offers; lowballing is unlikely to land.
- 2 sale attempts since 2y ago with the ask held roughly flat each time — persistent listings suggest the price (not the market) is what's stuck; bring a comps-based counter.
Risks & watch-outs
- Watch-outs: built in 1910 — expect roof / HVAC / electrical / plumbing capex.
Questions for the listing agent
- Built in 1910 — when were the roof, HVAC, electrical panel, plumbing, and water heater last replaced?
- Is there a deadline driving the sale (1031 exchange, divorce, estate, relocation)? That informs how much negotiation room exists.
- Crime grade is F in this area — have there been break-ins, vandalism, or insurance claims at this property in the last 3 years? What carrier currently insures it and at what premium?
- What's the average days-on-market for RENTAL listings here right now (not sales)? A rising rental-DOM trend means longer vacancies and softer asking-rent achievability than the comps imply.
- What's the recent tenant-quality profile in this submarket — average credit score on applications, eviction rate, late-payment / NSF rate, and stable-employment percentage? A property-management company in the area should have these aggregated.
- How much new for-sale + rental construction is in the pipeline within 1–3 miles? Heavy new supply typically softens prices + rents 12–24 months out; constrained supply supports both.
Investment metrics
- 1% rule
- 2.16% ✓
- Cap rate
- 18.11%
- Cash-on-cash
- 42.21%
- DSCR
- 2.88
- GRM
- 3.9
CMA / ARV
- ARV (median comp)
- $138,874
- List price
- $59,950
- Delta
- -56.83%
- Verdict
- UNDERPRICED
- Comps
- 20 within 1.0 mi
Show comp detail 12 sales within ~0.75 mi
| Address | Dist | Beds/Ba | Sqft | Sold | Price | $/sf | Match |
|---|---|---|---|---|---|---|---|
| 70 Baltimore St | 0.25mi | 3/2.5 | 1,540 (+2%) | 3mo | $170,000 | $110 | 81 |
| 1815 Warner Ave | 0.26mi | 3/2.0 | 1,458 (-4%) | 4mo | $43,000 | $29 | 78 |
| 729 Troy St | 0.04mi | 4/2.0 (+1) | 1,680 (+11%) | 2mo | $220,000 | $131 | 73 |
| 1322 Schaeffer St | 0.20mi | 3/2.0 | 1,384 (-9%) | 4mo | $40,000 | $29 | 73 |
| 1030 Dodgson Ct | 0.50mi | 3/2.0 | 1,472 (-3%) | 2mo | $165,500 | $112 | 70 |
| 1044 Dodgson Ct | 0.52mi | 3/2.5 | 1,432 (-6%) | 2mo | $150,000 | $105 | 63 |
| 905 Troy St | 0.17mi | 3/3.0 | 1,342 (-11%) | 8mo | $186,200 | $139 | 63 |
| 77 Baltimore St | 0.22mi | 3/1.0 | 1,319 (-13%) | 2mo | $111,900 | $85 | 62 |
| 129 Rita St | 0.40mi | 3/1.5 | 1,355 (-11%) | 2mo | $165,000 | $122 | 60 |
| 718 Taylor St | 0.52mi | 3/1.5 | 1,404 (-7%) | 4mo | $156,500 | $111 | 58 |
| 165 Rita St | 0.41mi | 3/1.0 | 1,360 (-10%) | 5mo | $60,000 | $44 | 55 |
| 310 Brandt St | 0.71mi | 3/1.0 | 1,389 (-8%) | 0mo | $147,000 | $106 | 48 |
Match score weights: distance 35% · size 25% · config 20% · recency 20%. Top-matched comps best support the ARV.
Projected returns pro-forma
-3.0% appreciation · 3.0% rent growth · sell at horizon
- IRR
- 38.9%
- Equity multiple
- 2.66×
- Total profit
- $27,925
- Equity at exit
- $8,939
- IRR
- 45.4%
- Equity multiple
- 5.34×
- Total profit
- $72,870
- Equity at exit
- $5,183
Cash invested: $16,786 (down + closing). Projections, not guarantees.
Landlord ↔ Tenant lean methodology
- Overall (STATE)
- 73 Landlord-Friendly
- State Ohio
- 73 Landlord-Friendly · R+6
- County
- — inherits STATE
- City
- — inherits STATE
ZIP-level market 45404
- Home prices YoY
- -24.2%
- Active inventory
- 66
- Price-to-rent
- 3.9×
Monthly cashflow live
- Estimated rent
- $1,296 high interval (Pro) →
- Mortgage (P&I)
- −$314
- Tax from tax record
- −$94 /mo · $1,131/yr
- Insurance
- −$25
- HOA
- −$0
- Vacancy / Maint / Mgmt
- −$272
- Net cashflow
- $590
Break-even live
UW: 25.0% down · 7.5% · 30yr · 1.5% tax · 5.0% vac · 8.0% maint · 8.0% mgmt
Financing live
Cash to close
- Down payment
- $14,988
- Closing costs
- $1,798
- Reserves months
- —
- Total cash needed
- —
Loan-product check · same deal, 3 products live
Conventional
25% down · 7.5% · 30yr
- Down + closing
- —
- Monthly P&I
- —
- Monthly cashflow
- —
- DSCR
- —
- Eligible?
- —
Personal DTI + credit; lowest rate.
DSCR
20% down · 8.5% · 30yr
- Down + closing
- —
- Monthly P&I
- —
- Monthly cashflow
- —
- DSCR
- —
- Eligible?
- —
No personal income docs; deal must DSCR.
Hard money
10% down · 12.0% · 12mo
- Down + closing
- —
- Monthly P&I
- —
- Monthly cashflow
- —
- DSCR
- —
- Eligible?
- —
Short-term bridge; refi at stabilization.
Rent comps 18 comps
| Address | Beds | Baths | Sqft | Rent | $/sqft | DOM | Units | Dist |
|---|---|---|---|---|---|---|---|---|
| 531 Maryland Ave Dayton, OH | 4.0 | 1.5 | 1962 | $1,700 | $0.87 | 14d | 1 | 0.08mi |
| 155 Grove Ave Unit 155 Dayton, OH | 3.0 | 1.0 | 1150 | $950 | $0.83 | 43d | 1 | 0.16mi |
| 200 Hart St Dayton, OH | 3.0 | 1.0 | 1304 | $1,250 | $0.96 | 23d | 1 | 0.26mi |
| 321 Deeds Ave Unit 319 Dayton, OH | 4.0 | 2.0 | 1794 | $1,100 | $0.61 | 43d | 1 | 0.27mi |
| 1517 Chapel St Unit 1521 Dayton, OH | 2.0 | 1.0 | 1239 | $1,000 | $0.81 | 3d | 1 | 0.32mi |
| 224 Deeds Ave Dayton, OH | 2.0 | 1.0 | 1124 | $950 | $0.85 | 23d | 1 | 0.35mi |
| 821 Herman Ave Dayton, OH | 3.0 | 1.0 | 1456 | $1,100 | $0.76 | 21d | 1 | 0.66mi |
| 2119 Bellefontaine Ave Dayton, OH | 3.0 | 1.5 | 1500 | $1,400 | $0.93 | 2d | 1 | 0.76mi |
| 204 Sears St Dayton, OH | 3.0 | 1.0–2.5 | 1124 | $2,793 | $2.48 | 2d | 10 | 1.12mi |
| 112 Webster St Dayton, OH | 2.0 | 1.0–2.0 | 802 | $2,198 | $2.74 | 2d | 63 | 1.15mi |
| 29 N Garfield St Dayton, OH | 3.0 | 1.0 | 1092 | $1,000 | $0.92 | 23d | 1 | 1.20mi |
| 140 E Monument Ave Dayton, OH | 3.0 | 1.0–2.0 | 1048 | $2,344 | $2.24 | 2d | 11 | 1.31mi |
| 500 E 3rd St Dayton, OH | 1.0–2.0 | 1.0–2.0 | 935 | $1,660 | $1.78 | 3d | 16 | 1.39mi |
| 534 Geyer St Dayton, OH | 4.0 | 1.0 | 1640 | $1,530 | $0.93 | 23d | 1 | 1.40mi |
| 2924 E 2nd St Unit 2 Dayton, OH | 2.0 | 1.0 | 2078 | $875 | $0.42 | 23d | 1 | 1.44mi |
| 100 N Jefferson St Dayton, OH | 1.0–2.0 | 1.0–2.0 | 800 | $1,532 | $1.92 | 3d | 11 | 1.45mi |
| 15 John St Unit 15 Dayton, OH | 2.0 | 1.0 | 1200 | $800 | $0.67 | 23d | 1 | 1.47mi |
| 412 Forest Ave Unit 414 Dayton, OH | 3.0 | 1.5 | 1200 | $1,200 | $1.00 | 43d | 1 | 1.49mi |
Listing history 27 events
-
2026-06-18days on market $59,950 Active 2 DOM
-
2026-06-16remarks 695-char remark
-
2026-06-16days on market $59,950 Active 1 DOM
-
2026-06-15days on market $59,950 Active 31 DOM
-
2026-06-14days on market $59,950 Active 29 DOM
-
2026-06-13days on market $59,950 Active 28 DOM
-
2026-06-10days on market $59,950 Active 26 DOM
-
2026-06-09days on market $59,950 Active 25 DOM
-
2026-06-08days on market $59,950 Active 24 DOM
-
2026-06-07days on market $59,950 Active 23 DOM
-
2026-06-05days on market $59,950 Active 20 DOM
-
2026-06-03days on market $59,950 Active 19 DOM
-
2026-06-02days on market $59,950 Active 18 DOM
-
2026-06-01days on market $59,950 Active 17 DOM
-
2026-05-31days on market $59,950 Active 16 DOM
-
2026-05-15$59,950 Active 741-char remark
-
2025-03-06soldstatus $56,000 Closed 186-char remark
Show marketing remark (186 chars)
Fixer upper with solid bones. 3 bedroom 1 bathroom home in old north dayton in need of updates throughout. Property is being sold as is - no repairs to be made - Cash or hard money only.
-
2025-02-10historical ActiveUnderContract 186-char remark
Show marketing remark (186 chars)
Fixer upper with solid bones. 3 bedroom 1 bathroom home in old north dayton in need of updates throughout. Property is being sold as is - no repairs to be made - Cash or hard money only.
-
2025-01-30price $51,900 186-char remark
Show marketing remark (186 chars)
Fixer upper with solid bones. 3 bedroom 1 bathroom home in old north dayton in need of updates throughout. Property is being sold as is - no repairs to be made - Cash or hard money only.
-
2024-12-17price $55,900 186-char remark
Show marketing remark (186 chars)
Fixer upper with solid bones. 3 bedroom 1 bathroom home in old north dayton in need of updates throughout. Property is being sold as is - no repairs to be made - Cash or hard money only.
-
2024-12-09price $56,900 186-char remark
Show marketing remark (186 chars)
Fixer upper with solid bones. 3 bedroom 1 bathroom home in old north dayton in need of updates throughout. Property is being sold as is - no repairs to be made - Cash or hard money only.
-
2024-12-02price $57,900 186-char remark
Show marketing remark (186 chars)
Fixer upper with solid bones. 3 bedroom 1 bathroom home in old north dayton in need of updates throughout. Property is being sold as is - no repairs to be made - Cash or hard money only.
-
2024-11-26price $58,900 186-char remark
Show marketing remark (186 chars)
Fixer upper with solid bones. 3 bedroom 1 bathroom home in old north dayton in need of updates throughout. Property is being sold as is - no repairs to be made - Cash or hard money only.
-
2024-11-19$59,900 Active 186-char remark
Show marketing remark (186 chars)
Fixer upper with solid bones. 3 bedroom 1 bathroom home in old north dayton in need of updates throughout. Property is being sold as is - no repairs to be made - Cash or hard money only.
-
2005-03-24soldstatus $58,600
-
2001-07-13soldstatus $47,000
-
1993-09-28soldstatus $14,000
ⓘ Source: listings_history table (triggers on properties + properties_extension) + one-shot
backfill from property_details.listing_events for pre-trigger history.
Tax reassessment forecast OH · Partial reset (capped growth)
- Current annual tax
- $1,131 · $94/mo
- Projected year-2 tax
- $1,131 · $94/mo
- Expected delta
- $0/yr ($0/mo · 0.0%)
ⓘ Screening estimate from a state-policy table — verify with the county assessor before closing.
Nearby sold comps map
Loading sold comps map…
Walkable amenities ~0.75 mi
Loading nearby amenities…
Taxation est. · year 1
- Rental income
- $15,556
- − Mortgage interest
- −$3,358
- − Property taxes
- −$1,131
- − Insurance
- −$300
- − Repairs & maintenance
- −$1,244
- − Management
- −$1,244
- − Depreciation
- −$1,744
- Taxable income
- $6,534
- Est. tax owed @ 24.0%
- −$1,568
- After-tax cash flow
- $5,518/yr
For passive investors: Depreciation is non-cash, so a rental often shows a tax loss while cash-flowing — sheltering income. Rental losses are passive: they offset passive income freely, and up to $25,000/yr can offset ordinary (W-2) income if you actively participate and your MAGI is under $100k (phasing out to $0 by $150k); unused losses carry forward. On sale, claimed depreciation is recaptured at up to 25%, and gains may owe capital-gains tax (a 1031 exchange can defer both). Figures are a year-1 estimate at your 24.0% rate — not tax advice; consult a CPA.
Schools (NCES district)
- District
- Dayton City
- NCES district ID
- 3904384
- Math proficiency
- 12% ▼ -12.00%
- Reading proficiency
- 21% ▼ -11.00%
- Median HH income
- $28,688
- Composite
- 12.94/100
- National rank
- #9579
- State rank
- #641 of 656 in OH
Livability — Dayton
- Score
- 65/100
- State rank
- #716
- US rank
- #12895
Category grades
Schools grade is shown separately in the Schools card above.
Census & demographics
- Census place
- Dayton, OH
- County
- Montgomery County · 459,541 people
- City population
- 164,387
- Metro
- Dayton-Kettering, OH
- Population (ZIP)
- 9,826
- Household income
- $38,874
- Rent vs Own
- Severe rent burden
- 702.0
Population outlook (Montgomery County) Hauer SSP2
- Today (2025)
- 523,241 people
- By 2030
- 514,948 · -1.6%
- By 2040
- 493,378 · -5.7%
- By 2050
- 469,639 · -10.2%
- By 2075
- 418,360 · -20.0%
- By 2100
- 353,315 · -32.5%
Race, ethnicity, and origin ACS 2023
- Neighborhood character
- Predominantly White (70%)
- Race & ethnicity
- White 70% Black 19% Two or more races 7% Hispanic / Latino 4% Asian 1%
- Common ancestry
- Iranian 3% Slovak 2% Serbian 1%
- Foreign-born
- 9% · Canada
- Languages at home
- 88% English-only · Spanish 4% Arabic 4% Other Asian/Pacific 3%
Political lean MEDSL · Montgomery
- 2024 margin
- Toss-up / Even · D 49.8% · R 49.3%
- 2008→2024 swing
- -5.8pp toward R · 2008: 6.2pp · 2024: 0.5pp
- All cycles
- 2024: D+0.5 2020: D+2.2 2016: R+1.2 2012: D+3.1 2008: D+6.2
Not yet ingested
- Civics
- —
Market trends
- HPI YoY
- ▼ -67.48%
- Current HPI
- 210.9571
- Rent YoY
- —
- Metro
- Dayton-Kettering, OH
- State GDP YoY
- ▲ 1.98%
- F500 in state
- 48
Industry mix (Fortune 500 HQ in OH)
| Industry | F500 HQs | Revenue |
|---|---|---|
| Insurance | 3 | $145B |
|
||
| Industrial Machinery | 3 | $49B |
|
||
| Financial Services | 3 | $24B |
|
||
| Consumer Goods | 2 | $93B |
|
||
| Aerospace / Defense | 2 | $47B |
|
||
| Utilities | 2 | $33B |
|
||
Price history
+328.2% since first listed12 events — show timeline
- 2026-06-16 Listed $59,950 Cincy MLS
- 2025-03-06 Sold (MLS) $56,000 Dayton MLS
- 2025-02-10 Contingent — Dayton MLS
- 2025-01-30 Price Changed $51,900 Dayton MLS
- 2024-12-17 Price Changed $55,900 Dayton MLS
- 2024-12-09 Price Changed $56,900 Dayton MLS
- 2024-12-02 Price Changed $57,900 Dayton MLS
- 2024-11-26 Price Changed $58,900 Dayton MLS
- 2024-11-19 Listed $59,900 Dayton MLS
- 2005-03-24 Sold (Public Records) $58,600 Public Records
- 2001-07-13 Sold (Public Records) $47,000 Public Records
- 1993-09-28 Sold (Public Records) $14,000 Public Records
Property tax history
+3.5%/yrLatest (2025): $1,131 · -4.7% YoY. Source: county tax records.
Cash-flow waterfall
monthlySold comps — $/sqft
last 12 mo · ≤1 miLoading sold comps…