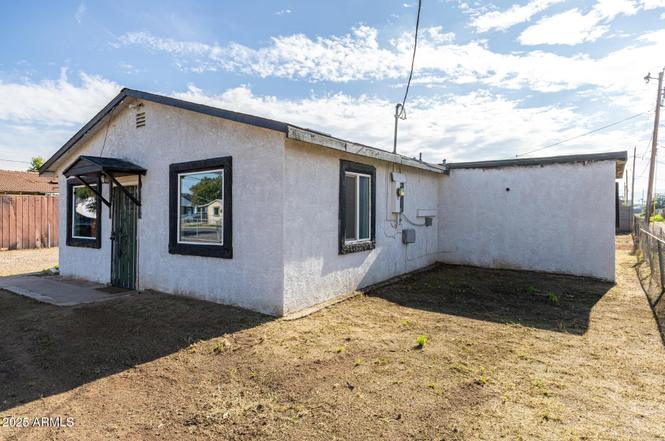
2811 W Pima St · Phoenix, AZ
Flood risk 3/10 · Minor
- FEMA flood zone
- X (shaded)
- Chance of flooding over 30 yrs
- 0.09%
- Est. flood insurance / yr
- $507 – $1,088
Fire risk 4/10 · Minor
- Est. fire insurance / yr
- $610 – $1,132
Heat risk 9/10 · Severe
- Hot days now (above 112°F)
- 7 days/yr
- Hot days in 30 yrs
- 19 days/yr
Wind risk 1/10 · Minimal
- Chance of severe wind over 30 yrs
- —
Air-quality risk 2/10 · Minimal
- Unhealthy air days now
- 2 days/yr
- Unhealthy air days in 30 yrs
- 2 days/yr
Risk factors via First Street. Map © Google.
Why this score? — see what drove the C+ grade
The composite is a weighted blend of 9 inputs, each scored 0–100. Each bar is that input's sub-score; the figure is the points it added to the 100-point composite (weight × sub-score).
- Cash flow +23.9/30.0
- ARV discount +15.0/15.0
- DSCR +7.7/10.0
- 1% rule +5.2/10.0
- Livability +3.8/5.0
- Condition / age +2.5/5.0
- Schools +1.1/10.0
- Rent growth +1.0/5.0
- Appreciation +0.0/10.0
$159,900
🖨 Deal sheet 📄 Offer letter ✓ Due diligence
Listing remarks MLS
Investor special. R-3 zoning! Tons of upside & great value for Central Phoenix. A/C, large lot and fenced yard plus Storage shed and carport.
Key facts
- N/s lot exposure
- Backyard storage
- Front access
Tags
Property features AI
Finance
- HOA & community: No association fees
Exterior
- Parking: Separate storage area
- Utilities: City water; Septic tank
- Home design: Single family residence; Fee simple ownership; Fixer condition
- Construction: Stucco, painted, and block construction; Composition roof; Other roof
- Exterior features: Shed(s); Storage; Dirt front and dirt back lot surfaces; Chain link fencing; Other fencing
Interior
- Kitchen: Kitchen island
- Bedrooms: Up to 3 bedrooms
- Flooring: Other flooring
- Bathrooms: 1 full bathroom
- Heating & cooling: Natural gas heating; Other heating; Central air; Ceiling fans; Other cooling
- Interior features: High speed internet; Kitchen island; Storage
- Laundry & utility: Laundry inside
Neighborhood map
What this means for you Summary
Snapshot
- This is a 2-bed/1.0-bath single-family listed at $160k.
Deal economics
- At list price, monthly cash flow is $309 ($4k/yr) — positive.
- The deal already cash-flows at list — no discount required.
- Meets the 1% rule at list price ($2k rent vs $160k).
- Recommended offer: $141k (12.0% below list) — sets the bar for market timing.
- Cap rate 8.6% vs local median 3.3% in Phoenix — top-decile yield for the area; either an underpriced asset or a hidden risk that comps aren't pricing in. Stress-test before assuming the spread holds.
Location & tenants
- Location reads 75/100 on livability (#16 in AZ, #3,924 nationally) — a middle-class / working-renter tenant base. Strengths: amenities A+, commute A+, housing A+; Watch: health & safety C-, crime F.
- Phoenix Union High School District (4286) (urban): math 10% / reading 15% proficiency, ranked #224 of 249 in AZ (top 90%) — low school quality limits family demand, transient renter base, plan for 1-2y turnover.
- Zoned schools: Carl Hayden High School (math 7% / reading 11%, grade F, #356 of 381 statewide, top 94%, 2,217 students, 93% FRL).
- Market conditions: Rents falling (-6.0%/yr); 107 active listings in the ZIP; 15 comparable units currently listed for rent nearby; rentals leasing fast (median 2d on market — plan ~1-2 weeks tenant-placement turnaround); 36,011 units permitted in Maricopa County in 2024 (12,801 in 5+ unit buildings).
- This rent runs 38% of the median local income ($52k/yr) — at the standard rent-burdened threshold; future hikes will face affordability resistance.
Forward outlook
- Local home prices are declining (-3.0%/yr); year-one equity from $1k of loan paydown is wiped out by about $5k of value loss. Plan a longer hold.
- Maricopa County population projected at +38% by 2050 — long-run rental-demand tailwind backs the buy-and-hold thesis.
Negotiation context
- It's been on market 162 days — a 12% lower offer ($141k) is reasonable based on typical stale-listing flexibility.
- 6 sale attempts since 4y ago; this cycle's ask has dropped $20k (11%) from the opening price — seller is motivated, your offer sets the floor, not the list.
Risks & watch-outs
- Watch-outs: built in 1950 — expect roof / HVAC / electrical / plumbing capex.
- Climate carrying-cost: extreme-heat days projected 7→19/yr by 2055 (HVAC capex compounding) — expect insurance premiums to compound above CPI over the hold.
Questions for the listing agent
- It's been on market 162 days. Have you received any prior offers? Is the seller open to a 12% concession, seller financing, or rate buy-down credit?
- Built in 1950 — when were the roof, HVAC, electrical panel, plumbing, and water heater last replaced?
- Why hasn't it sold? Are there any deal-killer items the seller is aware of (foundation, flood, title, zoning, code violations)?
- Is there a deadline driving the sale (1031 exchange, divorce, estate, relocation)? That informs how much negotiation room exists.
- Crime grade is F in this area — have there been break-ins, vandalism, or insurance claims at this property in the last 3 years? What carrier currently insures it and at what premium?
- What's the average days-on-market for RENTAL listings here right now (not sales)? A rising rental-DOM trend means longer vacancies and softer asking-rent achievability than the comps imply.
- What's the recent tenant-quality profile in this submarket — average credit score on applications, eviction rate, late-payment / NSF rate, and stable-employment percentage? A property-management company in the area should have these aggregated.
- How much new for-sale + rental construction is in the pipeline within 1–3 miles? Heavy new supply typically softens prices + rents 12–24 months out; constrained supply supports both.
Investment metrics
- 1% rule
- 1.02% ✓
- Cap rate
- 8.61%
- Cash-on-cash
- 8.28%
- DSCR
- 1.37
- GRM
- 8.2
CMA / ARV
- ARV (on-the-fly)
- $259,776
- Comps found
- 5
Show comp detail 5 sales within ~0.75 mi
| Address | Dist | Beds/Ba | Sqft | Sold | Price | $/sf | Match |
|---|---|---|---|---|---|---|---|
| 822 S 29th Ave | 0.48mi | 1/1.0 (-1) | 1,096 (+4%) | 8mo | $137,500 | $125 | 60 |
| 2950 W Pima St | 0.21mi | 3/2.0 (+1) | 1,125 (+6%) | 20mo | $370,000 | $329 | 53 |
| 2938 W Pima St | 0.19mi | 3/1.0 (+1) | 912 (-14%) | 18mo | $320,000 | $351 | 48 |
| 2410 W Papago St | 0.51mi | 3/1.8 (+1) | 1,197 (+13%) | 15mo | $295,000 | $246 | 33 |
| 2315 W Hadley St | 0.75mi | 2/1.0 | 900 (-15%) | 13mo | $160,000 | $178 | 30 |
Match score weights: distance 35% · size 25% · config 20% · recency 20%. Top-matched comps best support the ARV.
Projected returns pro-forma
-3.0% appreciation · 0.0% rent growth · sell at horizon
- IRR
- -6.9%
- Equity multiple
- 0.75×
- Total profit
- $-11,070
- Equity at exit
- $23,842
- IRR
- -1.1%
- Equity multiple
- 0.93×
- Total profit
- $-2,996
- Equity at exit
- $13,825
Cash invested: $44,772 (down + closing). Projections, not guarantees.
Landlord ↔ Tenant lean methodology
- Overall (STATE)
- 87 Strongly Landlord-Friendly
- State Arizona
- 87 Strongly Landlord-Friendly · R+3
- County
- — inherits STATE
- City
- — inherits STATE
ZIP-level market 85009
- Home prices YoY
- -29.7%
- Rents YoY
- -6.0%
- Active inventory
- 107
- Price-to-rent
- 8.2×
Monthly cashflow live
- Estimated rent
- $1,631 high interval (Pro) →
- Mortgage (P&I)
- −$839
- Tax from tax record
- −$75 /mo · $897/yr
- Insurance
- −$67
- HOA
- −$0
- Vacancy / Maint / Mgmt
- −$343
- Net cashflow
- $309
Break-even live
UW: 25.0% down · 7.5% · 30yr · 1.5% tax · 5.0% vac · 8.0% maint · 8.0% mgmt
Financing live
Cash to close
- Down payment
- $39,975
- Closing costs
- $4,797
- Reserves months
- —
- Total cash needed
- —
Loan-product check · same deal, 3 products live
Conventional
25% down · 7.5% · 30yr
- Down + closing
- —
- Monthly P&I
- —
- Monthly cashflow
- —
- DSCR
- —
- Eligible?
- —
Personal DTI + credit; lowest rate.
DSCR
20% down · 8.5% · 30yr
- Down + closing
- —
- Monthly P&I
- —
- Monthly cashflow
- —
- DSCR
- —
- Eligible?
- —
No personal income docs; deal must DSCR.
Hard money
10% down · 12.0% · 12mo
- Down + closing
- —
- Monthly P&I
- —
- Monthly cashflow
- —
- DSCR
- —
- Eligible?
- —
Short-term bridge; refi at stabilization.
Rent comps 15 comps
| Address | Beds | Baths | Sqft | Rent | $/sqft | DOM | Units | Dist |
|---|---|---|---|---|---|---|---|---|
| 2746 W Pima St Unit 2 Phoenix, AZ | 3.0 | 2.0 | 1100 | $1,898 | $1.73 | 17d | 1 | 0.06mi |
| 2746 W Pima St Phoenix, AZ | 3.0 | 2.0 | 1100 | $1,898 | $1.73 | 1d | 1 | 0.06mi |
| 2942 W Yuma St Phoenix, AZ | 2.0 | 1.0 | 750 | $1,400 | $1.87 | 22d | 1 | 0.25mi |
| 3232 W Jackson St Phoenix, AZ | 2.0 | 1.0 | 800 | $1,450 | $1.81 | 1d | 1 | 1.01mi |
| 3310 W Jackson St Unit 2 Phoenix, AZ | 3.0 | 1.0 | 823 | $1,450 | $1.76 | 24d | 1 | 1.05mi |
| 3324 W Jackson St #1 Phoenix, AZ | 3.0 | 1.0 | 1050 | $1,900 | $1.81 | 1d | 1 | 1.07mi |
| 3543 W Grant St Unit A Phoenix, AZ | 2.0 | 1.0 | 851 | $1,100 | $1.29 | 14d | 1 | 1.11mi |
| 1920 W Tonto St Phoenix, AZ | 2.0 | 1.0 | 1000 | $1,595 | $1.59 | 4d | 1 | 1.17mi |
| 121 S 21st Ave Phoenix, AZ | 3.0 | 1.0 | 1350 | $2,200 | $1.63 | 1d | 1 | 1.29mi |
| 2213 W Adams St Phoenix, AZ | 2.0 | 1.0 | 760 | $1,125 | $1.48 | 1d | 1 | 1.32mi |
| 3325 W Monroe St Unit B Phoenix, AZ | 1.0 | 1.0 | 700 | $995 | $1.42 | 14d | 1 | 1.34mi |
| 2133 W Adams St Unit 3 Phoenix, AZ | 2.0 | 1.0 | 800 | $899 | $1.12 | 1d | 1 | 1.36mi |
| 2045 W Washington St Unit 3 Phoenix, AZ | 2.0 | 2.0 | 900 | $1,400 | $1.56 | 1d | 1 | 1.37mi |
| 2121 W Adams St Phoenix, AZ | 2.0 | 2.0 | 875 | $1,497 | $1.71 | 1d | 2 | 1.38mi |
| 2121 W Adams St Unit A 202 Phoenix, AZ | 2.0 | 2.0 | 875 | $1,497 | $1.71 | 22d | 1 | 1.38mi |
Listing history 26 events
-
2026-06-13statusdays on market $159,900 Pending 162 DOM
-
2026-06-09days on market $159,900 Active 159 DOM
-
2026-06-08days on market $159,900 Active 158 DOM
-
2026-06-07days on market $159,900 Active 157 DOM
-
2026-06-04days on market $159,900 Active 154 DOM
-
2026-06-03days on market $159,900 Active 153 DOM
-
2026-06-02days on market $159,900 Active 152 DOM
-
2026-06-01days on market $159,900 Active 151 DOM
-
2026-05-31days on market $159,900 Active 150 DOM
-
2026-03-28price $174,900
-
2026-03-28status Active
-
2026-02-27historical Under Contract Accepting Backups
-
2026-01-01$179,900 Active
-
2025-11-13price $250,000
-
2025-10-21status Active
-
2025-09-09status Pending
-
2025-09-09historical
-
2025-09-05$275,000 Active
-
2023-01-04soldstatus $190,000
-
2022-12-30soldstatus $140,000 Closed 148-char remark
Show marketing remark (148 chars)
Investor special. R-3 zoning! Tons of upside & great value for Central Phoenix. A/C, large lot and fenced yard plus Storage shed and carport.
-
2022-12-21historical Under Contract Accepting Backups 148-char remark
Show marketing remark (148 chars)
Investor special. R-3 zoning! Tons of upside & great value for Central Phoenix. A/C, large lot and fenced yard plus Storage shed and carport.
-
2022-12-20status Active 148-char remark
Show marketing remark (148 chars)
Investor special. R-3 zoning! Tons of upside & great value for Central Phoenix. A/C, large lot and fenced yard plus Storage shed and carport.
-
2022-12-13historical Under Contract Accepting Backups 148-char remark
Show marketing remark (148 chars)
Investor special. R-3 zoning! Tons of upside & great value for Central Phoenix. A/C, large lot and fenced yard plus Storage shed and carport.
-
2022-12-01$199,999 Active 148-char remark
Show marketing remark (148 chars)
Investor special. R-3 zoning! Tons of upside & great value for Central Phoenix. A/C, large lot and fenced yard plus Storage shed and carport.
-
1985-09-27soldstatus $28,000
-
1983-08-19soldstatus $10,000
ⓘ Source: listings_history table (triggers on properties + properties_extension) + one-shot
backfill from property_details.listing_events for pre-trigger history.
Tax reassessment forecast AZ · Resets to sale price
- Current annual tax
- $897 · $75/mo
- Projected year-2 tax
- $1,055 · $88/mo
- Expected delta
- +$159/yr (+$13/mo · 17.7%)
ⓘ Screening estimate from a state-policy table — verify with the county assessor before closing.
Climate risk First Street
- Flood 3/10 Moderate FEMA zone X (shaded) · 9% chance over 30 yrs
- Wildfire 4/10 Moderate
- Heat 9/10 Extreme 7 d/yr ≥112°F today · 19 d/yr by 30 yrs out
- Wind 1/10 Low
- Air quality 2/10 Low 2 unhealthy d/yr today · 2 by 30 yrs out
Nearby sold comps map
Loading sold comps map…
Walkable amenities ~0.75 mi
Loading nearby amenities…
Taxation est. · year 1
- Rental income
- $19,576
- − Mortgage interest
- −$8,957
- − Property taxes
- −$897
- − Insurance
- −$800
- − Repairs & maintenance
- −$1,566
- − Management
- −$1,566
- − Depreciation
- −$4,652
- Taxable income
- $1,139
- Est. tax owed @ 24.0%
- −$273
- After-tax cash flow
- $3,433/yr
For passive investors: Depreciation is non-cash, so a rental often shows a tax loss while cash-flowing — sheltering income. Rental losses are passive: they offset passive income freely, and up to $25,000/yr can offset ordinary (W-2) income if you actively participate and your MAGI is under $100k (phasing out to $0 by $150k); unused losses carry forward. On sale, claimed depreciation is recaptured at up to 25%, and gains may owe capital-gains tax (a 1031 exchange can defer both). Figures are a year-1 estimate at your 24.0% rate — not tax advice; consult a CPA.
Schools (NCES district)
- District
- Phoenix Union High School District (4286)
- NCES district ID
- 0406330
- Math proficiency
- 10% ▼ -27.00%
- Reading proficiency
- 15% ▼ -18.00%
- Median HH income
- $39,055
- Composite
- 10.63/100
- National rank
- #9773
- State rank
- #224 of 249 in AZ
Livability — Phoenix
- Score
- 75/100
- State rank
- #16
- US rank
- #3924
Category grades
Schools grade is shown separately in the Schools card above.
Census & demographics
- Census place
- Phoenix, AZ
- County
- Maricopa County · 4,537,380 people
- City population
- 1,500,198
- Metro
- Phoenix-Mesa-Chandler, AZ
- Population (ZIP)
- 52,064
- Household income
- $52,054
- Rent vs Own
- Severe rent burden
- 2121.0
Population outlook (Maricopa County) Hauer SSP2
- Today (2025)
- 4,979,203 people
- By 2030
- 5,378,229 · +8.0%
- By 2040
- 6,156,598 · +23.6%
- By 2050
- 6,872,376 · +38.0%
- By 2075
- 8,401,270 · +68.7%
- By 2100
- 9,247,439 · +85.7%
Race, ethnicity, and origin ACS 2023
- Neighborhood character
- Predominantly Hispanic (81%)
- Race & ethnicity
- Hispanic / Latino 81% Two or more races 34% White 9% Black 5% Native American 3%
- Hispanic origin (detail)
- Mexican 73%
- Foreign-born
- 32% · Canada
- Languages at home
- 31% English-only · Spanish 67%
Political lean MEDSL · Maricopa
- 2024 margin
- Toss-up / Even · D 47.7% · R 51.2% · Other 1.1%
- 2008→2024 swing
- +7.1pp toward D · 2008: -10.6pp · 2024: -3.5pp
- All cycles
- 2024: R+3.5 2020: D+2.2 2016: R+3.5 2012: R+12.0 2008: R+10.6
Not yet ingested
- Civics
- —
Market trends
- HPI YoY
- ▼ -172.78%
- Current HPI
- 409.6161
- Rent YoY
- ▼ -5.98%
- Metro
- Phoenix-Mesa-Chandler, AZ
- State GDP YoY
- ▲ 4.54%
- F500 in state
- 20
Industry mix (Fortune 500 HQ in AZ)
| Industry | F500 HQs | Revenue |
|---|---|---|
| Technology | 2 | $13B |
|
||
| Mining / Metals | 1 | $23B |
|
||
| Environmental Services | 1 | $16B |
|
||
| Metals / Steel | 1 | $14B |
|
||
| Technology Distribution | 1 | $9B |
|
||
| Homebuilding | 1 | $8B |
|
||
Price history
+1649.0% since first listed17 events — show timeline
- 2026-03-28 Price Changed $174,900 ARMLS
- 2026-03-28 Relisted — ARMLS
- 2026-02-27 Contingent — ARMLS
- 2026-01-01 Listed $179,900 ARMLS
- 2025-11-13 Price Changed $250,000 ARMLS
- 2025-10-21 Relisted — ARMLS
- 2025-09-09 Pending — ARMLS
- 2025-09-09 Listing Removed — ARMLS
- 2025-09-05 Listed $275,000 ARMLS
- 2023-01-04 Sold (Public Records) $190,000 Public Records
- 2022-12-30 Sold (MLS) $140,000 ARMLS
- 2022-12-21 Contingent — ARMLS
- 2022-12-20 Relisted — ARMLS
- 2022-12-13 Contingent — ARMLS
- 2022-12-01 Listed $199,999 ARMLS
- 1985-09-27 Sold (Public Records) $28,000 Public Records
- 1983-08-19 Sold (Public Records) $10,000 Public Records
Property tax history
+0.7%/yrLatest (2025): $897 · -0.9% YoY. Source: county tax records.
Cash-flow waterfall
monthlySold comps — $/sqft
last 12 mo · ≤1 miLoading sold comps…