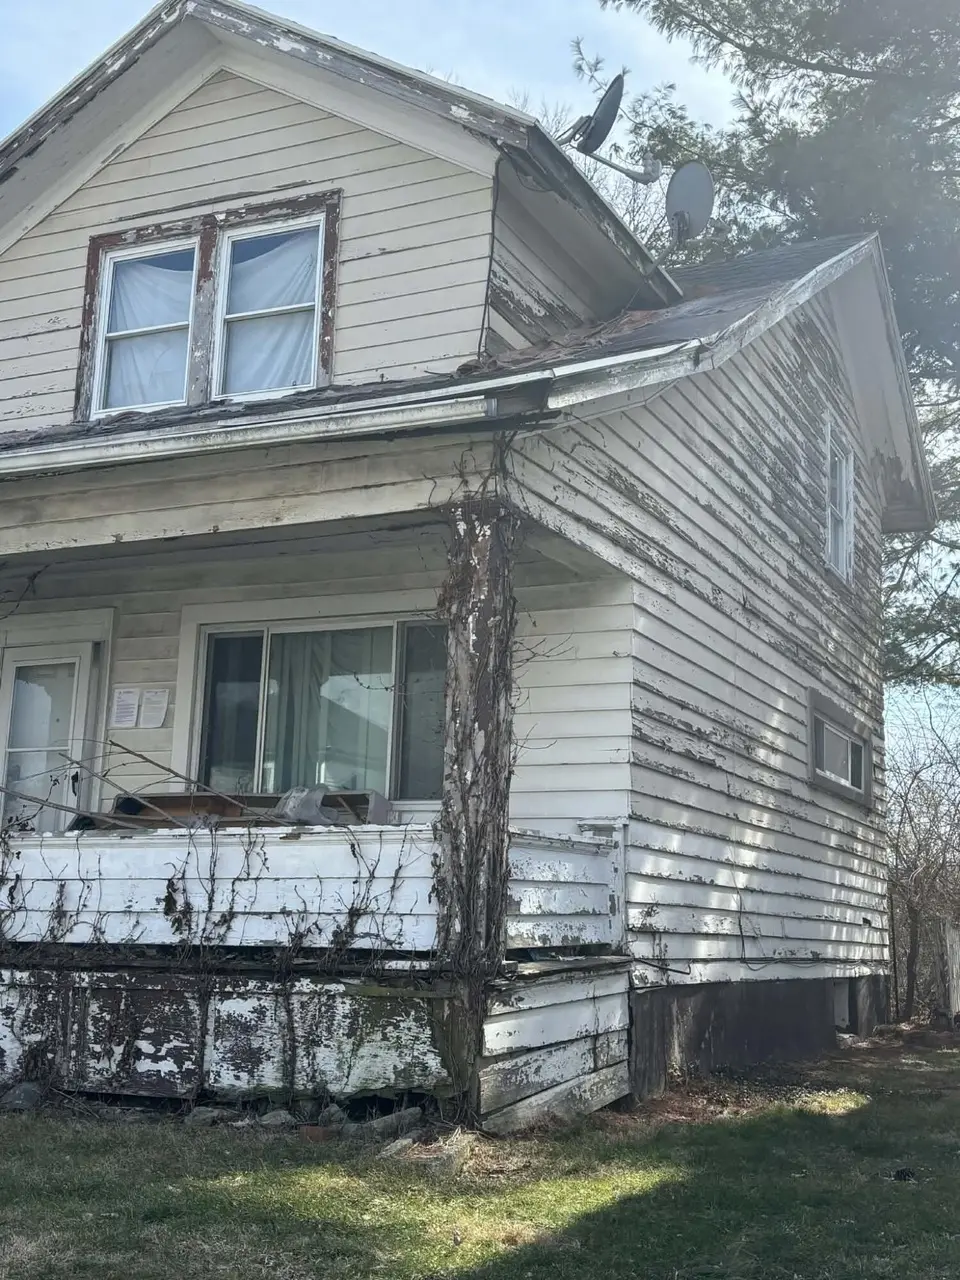
712 Clegg St · Dayton, OH
Flood risk 1/10 · Minimal
- FEMA flood zone
- X (unshaded)
- Chance of flooding over 30 yrs
- 0.0%
- Est. flood insurance / yr
- $473 – $860
Fire risk 1/10 · Minimal
- Est. fire insurance / yr
- $713 – $1,323
Heat risk 4/10 · Minor
- Hot days now (above 102°F)
- 7 days/yr
- Hot days in 30 yrs
- 18 days/yr
Wind risk 2/10 · Minimal
- Chance of severe wind over 30 yrs
- 0.0%
Air-quality risk 3/10 · Minor
- Unhealthy air days now
- 3 days/yr
- Unhealthy air days in 30 yrs
- 5 days/yr
Risk factors via First Street. Map © Google.
Why this score? — see what drove the D grade
The composite is a weighted blend of 9 inputs, each scored 0–100. Each bar is that input's sub-score; the figure is the points it added to the 100-point composite (weight × sub-score).
- Cash flow +15.0/30.0
- ARV discount +7.5/15.0
- 1% rule +5.0/10.0
- DSCR +5.0/10.0
- Rent growth +3.5/5.0
- Livability +3.2/5.0
- Condition / age +2.5/5.0
- Schools +1.3/10.0
- Appreciation +0.0/10.0
$19,000
🖨 Deal sheet 📄 Offer letter ✓ Due diligence
Listing remarks MLS
This is the one seasoned investors and visionaries have been waiting for. Located at 712 Clegg St, this property is a true blank canvas--a full renovation project ready for transformation. Whether you're looking for your next flip, rental conversion, or long-term hold, the upside here is undeniable. The home offers 2 bedrooms, 1 bath, and over 1,100 square feet, sitting on a generous lot with room to reimagine both the structure and exterior. The current condition requires a complete rehab, making it ideal for buyers ready to bring their contractor and creativity. Surrounded by steady rental demand and ongoing revitalization, this is a chance to get in at a price point that leaves room for strong returns. (Curb Offers Only!) Opportunities like this don't last--priced for a quick sale and sold as-is.
Key facts
- Generous lot
- 4,791 sq ft lot
- Built 1917
Tags
Neighborhood map
What this means for you Summary
Snapshot
- This is a 2-bed/1.0-bath single-family listed at $19k.
Deal economics
- At list price, monthly cash flow is $824 ($10k/yr) — positive.
- The deal already cash-flows at list — no discount required.
- Meets the 1% rule at list price ($1k rent vs $19k).
- Recommended offer: $18k (6.0% below list) — sets the bar for market timing.
- Cap rate 58.3% vs local median 7.4% in Dayton — top-decile yield for the area; either an underpriced asset or a hidden risk that comps aren't pricing in. Stress-test before assuming the spread holds.
Location & tenants
- Location reads 65/100 on livability (#716 in OH) — a middle-class / working-renter tenant base. Strengths: cost of living A+, housing A+, health & safety A; Watch: schools C-, amenities C-, crime F.
- Dayton City (urban): math 12% / reading 21% proficiency, ranked #641 of 656 in OH (top 98%) — low school quality limits family demand, transient renter base, plan for 1-2y turnover; 74% free/reduced lunch — lower-income household profile, screen leases tightly.
- Market conditions: Rents rising fast (+4.1%/yr); 135 active listings in the ZIP; 28 comparable units currently listed for rent nearby; rentals at typical pace (median 23d on market — plan ~3-4 weeks tenant-placement turnaround); 43% of comp listings sitting > 30 days — soft ceiling on asking rent; lower-income renter base — watch delinquency; 907 units permitted in Montgomery County in 2024 (416 in 5+ unit buildings).
- This rent runs 41% of the median local income ($37k/yr) — at the standard rent-burdened threshold; future hikes will face affordability resistance.
Forward outlook
- Local home prices are declining (-3.0%/yr); year-one equity from $131 of loan paydown is wiped out by about $570 of value loss. Plan a longer hold.
- Montgomery County population projected at -10% by 2050 — secular population decline; favor cash flow + early exit over multi-decade hold.
- At projected returns (-3.0% appreciation + 4.1% rent growth), your $5k cash investment doubles in ~1 year — after that, you're playing with house money.
Negotiation context
- It's been on market 81 days — a 6% lower offer ($18k) is reasonable based on typical stale-listing flexibility.
- 2 sale attempts; this cycle's ask has dropped $20k (51%) from the opening price — seller is motivated, your offer sets the floor, not the list.
Risks & watch-outs
- Watch-outs: property tax is 4.3% of price; built in 1917 — expect roof / HVAC / electrical / plumbing capex.
Questions for the listing agent
- It's been on market 81 days. Have you received any prior offers? Is the seller open to a 6% concession, seller financing, or rate buy-down credit?
- Built in 1917 — when were the roof, HVAC, electrical panel, plumbing, and water heater last replaced?
- Property tax is high relative to price — has the assessment been appealed recently, and will the sale trigger a re-assessment?
- Why hasn't it sold? Are there any deal-killer items the seller is aware of (foundation, flood, title, zoning, code violations)?
- Is there a deadline driving the sale (1031 exchange, divorce, estate, relocation)? That informs how much negotiation room exists.
- Crime grade is F in this area — have there been break-ins, vandalism, or insurance claims at this property in the last 3 years? What carrier currently insures it and at what premium?
- The area grade is low — what's the realistic commute time and amenity access for the typical tenant pool here? Any planned neighborhood developments (good or bad) we should know about?
- What's the average days-on-market for RENTAL listings here right now (not sales)? A rising rental-DOM trend means longer vacancies and softer asking-rent achievability than the comps imply.
- What's the recent tenant-quality profile in this submarket — average credit score on applications, eviction rate, late-payment / NSF rate, and stable-employment percentage? A property-management company in the area should have these aggregated.
- How much new for-sale + rental construction is in the pipeline within 1–3 miles? Heavy new supply typically softens prices + rents 12–24 months out; constrained supply supports both.
Investment metrics
- 1% rule
- 6.66% ✓
- Cap rate
- 58.34%
- Cash-on-cash
- 185.89%
- DSCR
- 9.27
- GRM
- 1.3
CMA / ARV
- ARV (median comp)
- $76,681
- List price
- $19,000
- Delta
- -75.22%
- Verdict
- UNDERPRICED
- Comps
- 20 within 1.0 mi
Show comp detail 12 sales within ~0.75 mi
| Address | Dist | Beds/Ba | Sqft | Sold | Price | $/sf | Match |
|---|---|---|---|---|---|---|---|
| 726 Clegg St | 0.02mi | 2/1.0 | 1,072 (-6%) | 11mo | $25,000 | $23 | 80 |
| 374 Bolander Ave | 0.38mi | 2/1.0 | 1,165 (+2%) | 16mo | $54,000 | $46 | 66 |
| 791 Edgemont Ave | 0.24mi | 2/1.0 | 1,032 (-10%) | 9mo | $40,000 | $39 | 65 |
| 350 Smith St | 0.37mi | 3/1.0 (+1) | 1,230 (+8%) | 2mo | $76,500 | $62 | 63 |
| 218 Smith St | 0.61mi | 3/1.0 (+1) | 1,164 (+2%) | 1mo | $150,000 | $129 | 63 |
| 1410 Steiner Ave | 0.62mi | 2/2.0 | 1,154 (+1%) | 10mo | $114,000 | $99 | 58 |
| 1331 Swisher Ave | 0.52mi | 3/1.0 (+1) | 1,144 (0%) | 17mo | $81,000 | $71 | 56 |
| 711 Cincinnati St | 0.33mi | 2/2.0 | 976 (-15%) | 1mo | $125,500 | $129 | 56 |
| 1449 Weaver St | 0.66mi | 2/1.0 | 1,044 (-9%) | 9mo | $100,000 | $96 | 47 |
| 1253 S Broadway St | 0.47mi | 3/3.0 (+1) | 1,236 (+8%) | 13mo | $115,000 | $93 | 41 |
| 433 W Stewart St | 0.40mi | 3/2.0 (+1) | 1,007 (-12%) | 15mo | $126,000 | $125 | 40 |
| 1516 Hochwalt Ave | 0.74mi | 3/1.5 (+1) | 1,065 (-7%) | 16mo | $130,000 | $122 | 34 |
Match score weights: distance 35% · size 25% · config 20% · recency 20%. Top-matched comps best support the ARV.
Projected returns pro-forma
-3.0% appreciation · 4.06% rent growth · sell at horizon
- IRR
- —
- Equity multiple
- 10.55×
- Total profit
- $50,819
- Equity at exit
- $2,833
- IRR
- —
- Equity multiple
- 23.13×
- Total profit
- $117,748
- Equity at exit
- $1,643
Cash invested: $5,320 (down + closing). Projections, not guarantees.
Landlord ↔ Tenant lean methodology
- Overall (STATE)
- 73 Landlord-Friendly
- State Ohio
- 73 Landlord-Friendly · R+6
- County
- — inherits STATE
- City
- — inherits STATE
ZIP-level market 45417
- Home prices YoY
- -32.3%
- Rents YoY
- 4.1%
- Active inventory
- 135
- Price-to-rent
- 1.3×
Monthly cashflow live
- Estimated rent
- $1,266 high interval (Pro) →
- Mortgage (P&I)
- −$100
- Tax from tax record
- −$69 /mo · $823/yr
- Insurance
- −$8
- HOA
- −$0
- Vacancy / Maint / Mgmt
- −$266
- Net cashflow
- $824
Break-even live
UW: 25.0% down · 7.5% · 30yr · 1.5% tax · 5.0% vac · 8.0% maint · 8.0% mgmt
Financing live
Cash to close
- Down payment
- $4,750
- Closing costs
- $570
- Reserves months
- —
- Total cash needed
- —
Loan-product check · same deal, 3 products live
Conventional
25% down · 7.5% · 30yr
- Down + closing
- —
- Monthly P&I
- —
- Monthly cashflow
- —
- DSCR
- —
- Eligible?
- —
Personal DTI + credit; lowest rate.
DSCR
20% down · 8.5% · 30yr
- Down + closing
- —
- Monthly P&I
- —
- Monthly cashflow
- —
- DSCR
- —
- Eligible?
- —
No personal income docs; deal must DSCR.
Hard money
10% down · 12.0% · 12mo
- Down + closing
- —
- Monthly P&I
- —
- Monthly cashflow
- —
- DSCR
- —
- Eligible?
- —
Short-term bridge; refi at stabilization.
Rent comps 28 comps
| Address | Beds | Baths | Sqft | Rent | $/sqft | DOM | Units | Dist |
|---|---|---|---|---|---|---|---|---|
| 402 Harriet St Dayton, OH | 3.0 | 1.0 | 864 | $1,150 | $1.33 | 14d | 1 | 0.47mi |
| 1515 W Stewart St Dayton, OH | 2.0 | 1.0 | 925 | $1,000 | $1.08 | 43d | 1 | 0.74mi |
| 47 Leroy St Dayton, OH | 3.0 | 1.0 | 1456 | $1,200 | $0.82 | 43d | 1 | 0.90mi |
| 1272 Clement Ave Dayton, OH | 3.0 | 1.0 | 1025 | $1,350 | $1.32 | 2d | 1 | 1.12mi |
| 310 Old River Trl Dayton, OH | 2.0 | 2.0–2.5 | 1231 | $2,440 | $1.98 | 2d | 3 | 1.18mi |
| 673 Randolph St Dayton, OH | 2.0 | 1.0 | 792 | $950 | $1.20 | 43d | 1 | 1.23mi |
| 1266 Lytle Ln Dayton, OH | 2.0 | 2.0–2.5 | 1250 | $1,295 | $1.04 | 2d | 1 | 1.24mi |
| See individual Unit addresses Dayton, OH | 1.0–2.0 | 1.0–2.0 | 928 | $2,297 | $2.48 | 43d | 10 | 1.26mi |
| 652 Dennison Ave Dayton, OH | 2.0 | 2.0 | 988 | $1,095 | $1.11 | 21d | 1 | 1.27mi |
| 619 Nathan Pl Dayton, OH | 2.0 | 1.0–2.0 | 729 | $1,608 | $2.21 | 2d | 7 | 1.32mi |
| 2240 Lakeview Ave Dayton, OH | 3.0 | 1.0 | 1056 | $1,025 | $0.97 | 43d | 1 | 1.32mi |
| 213 Burns Ave Dayton, OH | 2.0 | 1.5 | 1388 | $1,500 | $1.08 | 14d | 1 | 1.37mi |
| 213 Burns Ave Dayton, OH | 2.0 | 1.5 | 1388 | $1,500 | $1.08 | 43d | 1 | 1.37mi |
| 42 S Mathison St Dayton, OH | 3.0 | 1.0 | 1300 | $1,220 | $0.94 | 3d | 1 | 1.39mi |
| 40 S Mathison St Dayton, OH | 3.0 | 1.0 | 1300 | $1,200 | $0.92 | 14d | 1 | 1.39mi |
| 243 Oak St Dayton, OH | 3.0 | 1.5 | 1316 | $1,600 | $1.22 | 3d | 1 | 1.43mi |
| 40 W 4th St Unit 909-2109 Dayton, OH | 1.0 | 1.0 | 824 | $1,548 | $1.88 | 43d | 1 | 1.43mi |
| 40 W 4th St Dayton, OH | 1.0–2.0 | 1.0–2.0 | 1118 | $2,200 | $1.97 | 43d | 7 | 1.43mi |
| 42 S Ludlow St Dayton, OH | 1.0–3.0 | 1.0–2.0 | 860 | $1,012 | $1.18 | 43d | 1 | 1.46mi |
| 623 Clifton Dr Apt B Dayton, OH | 2.0 | 1.0 | 1200 | $1,174 | $0.98 | 3d | 1 | 1.46mi |
| 623 Clifton Dr Apt A Dayton, OH | 2.0 | 1.0 | 1200 | $1,200 | $1.00 | 2d | 1 | 1.46mi |
| 59 Green St Unit A Dayton, OH | 2.0 | 1.0 | 1100 | $1,350 | $1.23 | 3d | 1 | 1.48mi |
| 2358 S Patterson Blvd Unit 6 Kettering, OH | 2.0 | 1.0 | 900 | $1,000 | $1.11 | 23d | 1 | 1.48mi |
| 848 Riverview Ter Unit 606 Dayton, OH | 1.0 | 1.0 | 700 | $900 | $1.29 | 43d | 1 | 1.48mi |
| 848 Riverview Ter Unit 508 Dayton, OH | 1.0 | 1.0 | 800 | $975 | $1.22 | 43d | 1 | 1.48mi |
| 848 Riverview Ter Apt 607 Dayton, OH | 2.0 | 1.0 | 1400 | $1,300 | $0.93 | 23d | 1 | 1.48mi |
| 848 Riverview Ter Apt 205 Dayton, OH | 2.0 | 1.0 | 1100 | $1,100 | $1.00 | 14d | 1 | 1.48mi |
| 322 S Patterson Blvd Unit 103 Dayton, OH | 2.0 | 2.0 | 910 | $1,700 | $1.87 | 43d | 1 | 1.50mi |
Listing history 20 events
-
2026-06-18days on market $19,000 Active 81 DOM
-
2026-06-17days on market $19,000 Active 80 DOM
-
2026-06-16days on market $19,000 Active 79 DOM
-
2026-06-15days on market $19,000 Active 78 DOM
-
2026-06-14days on market $19,000 Active 76 DOM
-
2026-06-13days on market $19,000 Active 75 DOM
-
2026-06-10days on market $19,000 Active 73 DOM
-
2026-06-09days on market $19,000 Active 72 DOM
-
2026-06-08days on market $19,000 Active 71 DOM
-
2026-06-07days on market $19,000 Active 70 DOM
-
2026-06-05days on market $19,000 Active 67 DOM
-
2026-06-03days on market $19,000 Active 66 DOM
-
2026-06-02days on market $19,000 Active 65 DOM
-
2026-06-01days on market $19,000 Active 64 DOM
-
2026-05-31days on market $19,000 Active 63 DOM
-
2026-04-13price $19,000 810-char remark
Show marketing remark (810 chars)
This is the one seasoned investors and visionaries have been waiting for. Located at 712 Clegg St, this property is a true blank canvas--a full renovation project ready for transformation. Whether you're looking for your next flip, rental conversion, or long-term hold, the upside here is undeniable. The home offers 2 bedrooms, 1 bath, and over 1,100 square feet, sitting on a generous lot with room to reimagine both the structure and exterior. The current condition requires a complete rehab, making it ideal for buyers ready to bring their contractor and creativity. Surrounded by steady rental demand and ongoing revitalization, this is a chance to get in at a price point that leaves room for strong returns. (Curb Offers Only!) Opportunities like this don't last--priced for a quick sale and sold as-is.
-
2026-04-07status Active 810-char remark
Show marketing remark (810 chars)
This is the one seasoned investors and visionaries have been waiting for. Located at 712 Clegg St, this property is a true blank canvas--a full renovation project ready for transformation. Whether you're looking for your next flip, rental conversion, or long-term hold, the upside here is undeniable. The home offers 2 bedrooms, 1 bath, and over 1,100 square feet, sitting on a generous lot with room to reimagine both the structure and exterior. The current condition requires a complete rehab, making it ideal for buyers ready to bring their contractor and creativity. Surrounded by steady rental demand and ongoing revitalization, this is a chance to get in at a price point that leaves room for strong returns. (Curb Offers Only!) Opportunities like this don't last--priced for a quick sale and sold as-is.
-
2026-04-07price $25,000 810-char remark
Show marketing remark (810 chars)
This is the one seasoned investors and visionaries have been waiting for. Located at 712 Clegg St, this property is a true blank canvas--a full renovation project ready for transformation. Whether you're looking for your next flip, rental conversion, or long-term hold, the upside here is undeniable. The home offers 2 bedrooms, 1 bath, and over 1,100 square feet, sitting on a generous lot with room to reimagine both the structure and exterior. The current condition requires a complete rehab, making it ideal for buyers ready to bring their contractor and creativity. Surrounded by steady rental demand and ongoing revitalization, this is a chance to get in at a price point that leaves room for strong returns. (Curb Offers Only!) Opportunities like this don't last--priced for a quick sale and sold as-is.
-
2026-04-06status Pending 810-char remark
Show marketing remark (810 chars)
This is the one seasoned investors and visionaries have been waiting for. Located at 712 Clegg St, this property is a true blank canvas--a full renovation project ready for transformation. Whether you're looking for your next flip, rental conversion, or long-term hold, the upside here is undeniable. The home offers 2 bedrooms, 1 bath, and over 1,100 square feet, sitting on a generous lot with room to reimagine both the structure and exterior. The current condition requires a complete rehab, making it ideal for buyers ready to bring their contractor and creativity. Surrounded by steady rental demand and ongoing revitalization, this is a chance to get in at a price point that leaves room for strong returns. (Curb Offers Only!) Opportunities like this don't last--priced for a quick sale and sold as-is.
-
2026-03-28$39,000 Active 810-char remark
Show marketing remark (810 chars)
This is the one seasoned investors and visionaries have been waiting for. Located at 712 Clegg St, this property is a true blank canvas--a full renovation project ready for transformation. Whether you're looking for your next flip, rental conversion, or long-term hold, the upside here is undeniable. The home offers 2 bedrooms, 1 bath, and over 1,100 square feet, sitting on a generous lot with room to reimagine both the structure and exterior. The current condition requires a complete rehab, making it ideal for buyers ready to bring their contractor and creativity. Surrounded by steady rental demand and ongoing revitalization, this is a chance to get in at a price point that leaves room for strong returns. (Curb Offers Only!) Opportunities like this don't last--priced for a quick sale and sold as-is.
ⓘ Source: listings_history table (triggers on properties + properties_extension) + one-shot
backfill from property_details.listing_events for pre-trigger history.
Tax reassessment forecast OH · Partial reset (capped growth)
- Current annual tax
- $823 · $69/mo
- Projected year-2 tax
- $823 · $69/mo
- Expected delta
- $0/yr ($0/mo · 0.0%)
ⓘ Screening estimate from a state-policy table — verify with the county assessor before closing.
Climate risk First Street
- Flood 1/10 Low FEMA zone X (unshaded) · 0% chance over 30 yrs
- Wildfire 1/10 Low
- Heat 4/10 Moderate 7 d/yr ≥102°F today · 18 d/yr by 30 yrs out
- Wind 2/10 Low 0% chance of damaging wind over 30 yrs
- Air quality 3/10 Moderate 3 unhealthy d/yr today · 5 by 30 yrs out
Nearby sold comps map
Loading sold comps map…
Walkable amenities ~0.75 mi
Loading nearby amenities…
Taxation est. · year 1
- Rental income
- $15,193
- − Mortgage interest
- −$1,064
- − Property taxes
- −$823
- − Insurance
- −$95
- − Repairs & maintenance
- −$1,215
- − Management
- −$1,215
- − Depreciation
- −$553
- Taxable income
- $10,227
- Est. tax owed @ 24.0%
- −$2,455
- After-tax cash flow
- $7,435/yr
For passive investors: Depreciation is non-cash, so a rental often shows a tax loss while cash-flowing — sheltering income. Rental losses are passive: they offset passive income freely, and up to $25,000/yr can offset ordinary (W-2) income if you actively participate and your MAGI is under $100k (phasing out to $0 by $150k); unused losses carry forward. On sale, claimed depreciation is recaptured at up to 25%, and gains may owe capital-gains tax (a 1031 exchange can defer both). Figures are a year-1 estimate at your 24.0% rate — not tax advice; consult a CPA.
Schools (NCES district)
- District
- Dayton City
- NCES district ID
- 3904384
- Math proficiency
- 12% ▼ -12.00%
- Reading proficiency
- 21% ▼ -11.00%
- Median HH income
- $28,688
- Composite
- 12.94/100
- National rank
- #9579
- State rank
- #641 of 656 in OH
Livability — Dayton
- Score
- 65/100
- State rank
- #716
- US rank
- #12895
Category grades
Schools grade is shown separately in the Schools card above.
Census & demographics
- Census place
- Dayton, OH
- County
- Montgomery County · 459,541 people
- City population
- 164,387
- Metro
- Dayton-Kettering, OH
- Population (ZIP)
- 28,186
- Household income
- $36,945
- Rent vs Own
- Severe rent burden
- 1822.0
Population outlook (Montgomery County) Hauer SSP2
- Today (2025)
- 523,241 people
- By 2030
- 514,948 · -1.6%
- By 2040
- 493,378 · -5.7%
- By 2050
- 469,639 · -10.2%
- By 2075
- 418,360 · -20.0%
- By 2100
- 353,315 · -32.5%
Race, ethnicity, and origin ACS 2023
- Neighborhood character
- Predominantly Black (71%)
- Race & ethnicity
- Black 71% White 20% Two or more races 8% Hispanic / Latino 3%
- Common ancestry
- Romanian 0%
- Foreign-born
- 3% · Canada
- Languages at home
- 96% English-only · Spanish 2% French/Haitian/Cajun 1%
Political lean MEDSL · Montgomery
- 2024 margin
- Toss-up / Even · D 49.8% · R 49.3%
- 2008→2024 swing
- -5.8pp toward R · 2008: 6.2pp · 2024: 0.5pp
- All cycles
- 2024: D+0.5 2020: D+2.2 2016: R+1.2 2012: D+3.1 2008: D+6.2
Not yet ingested
- Civics
- —
Market trends
- HPI YoY
- ▼ -92.43%
- Current HPI
- 193.4175
- Rent YoY
- ▲ 4.06%
- Metro
- Dayton-Kettering, OH
- State GDP YoY
- ▲ 1.98%
- F500 in state
- 48
Industry mix (Fortune 500 HQ in OH)
| Industry | F500 HQs | Revenue |
|---|---|---|
| Insurance | 3 | $145B |
|
||
| Industrial Machinery | 3 | $49B |
|
||
| Financial Services | 3 | $24B |
|
||
| Consumer Goods | 2 | $93B |
|
||
| Aerospace / Defense | 2 | $47B |
|
||
| Utilities | 2 | $33B |
|
||
Price history
-51.3% since first listed5 events — show timeline
- 2026-04-13 Price Changed $19,000 CBRMLS
- 2026-04-07 Relisted — CBRMLS
- 2026-04-07 Price Changed $25,000 CBRMLS
- 2026-04-06 Pending — CBRMLS
- 2026-03-28 Listed $39,000 CBRMLS
Property tax history
+0.2%/yrLatest (2025): $823 · +4.7% YoY. Source: county tax records.
Cash-flow waterfall
monthlySold comps — $/sqft
last 12 mo · ≤1 miLoading sold comps…