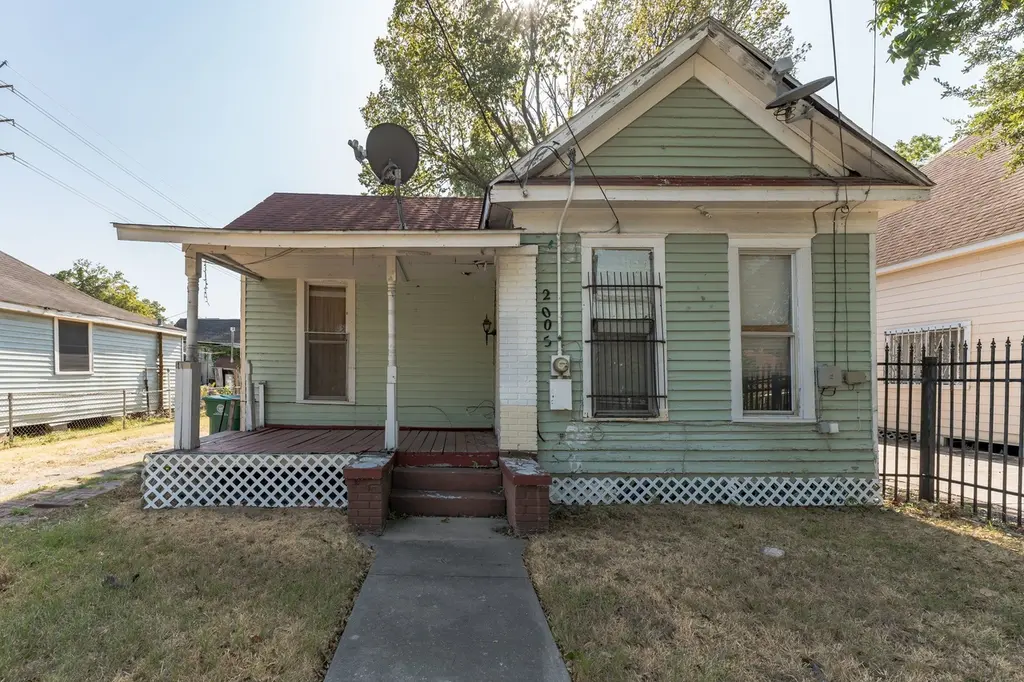
2005 Chestnut St · Houston, TX
Flood risk 1/10 · Minimal
- FEMA flood zone
- X (unshaded)
- Chance of flooding over 30 yrs
- 0.0%
- Est. flood insurance / yr
- $507 – $1,088
Fire risk 1/10 · Minimal
- Est. fire insurance / yr
- $1,222 – $2,270
Heat risk 9/10 · Severe
- Hot days now (above 109°F)
- 7 days/yr
- Hot days in 30 yrs
- 23 days/yr
Wind risk 9/10 · Severe
- Chance of severe wind over 30 yrs
- 99.0%
Air-quality risk 3/10 · Minor
- Unhealthy air days now
- 2 days/yr
- Unhealthy air days in 30 yrs
- 3 days/yr
Risk factors via First Street. Map © Google.
Why this score? — see what drove the C- grade
The composite is a weighted blend of 9 inputs, each scored 0–100. Each bar is that input's sub-score; the figure is the points it added to the 100-point composite (weight × sub-score).
- ARV discount +15.0/15.0
- Cash flow +14.6/30.0
- 1% rule +5.0/10.0
- DSCR +4.5/10.0
- Livability +3.7/5.0
- Rent growth +2.7/5.0
- Schools +2.7/10.0
- Condition / age +2.5/5.0
- Appreciation +0.0/10.0
$199,999
🖨 Deal sheet 📄 Offer letter ✓ Due diligence
Listing remarks MLS
Looking for your next investment property? Look no further! Check out this property located in the Allen subdivision. Two bedrooms, one bathroom and 1,255 square feet. Walking distance to Ketelsen Elementary, Marshall Middle and Northside High. Minutes from Woodland Park. Convenient to I-45. Roughly 10 minutes from downtown Houston. You don't want to miss this opportunity!
Key facts
- Convenient to i-45
- 5,000 sq ft lot
- Built 1910
Tags
Neighborhood map
What this means for you Summary
Snapshot
- This is a 2-bed/1.0-bath single-family listed at $200k.
Deal economics
- At list price, monthly cash flow is $48 ($574/yr) — positive.
- The deal already cash-flows at list — no discount required.
- To meet the 1% rule (rent ≥ 1% of price), the offer needs to be $200k (0.1% below list).
- Recommended offer: $188k (6.0% below list) — sets the bar for market timing.
- Cap rate 6.6% vs local median 3.2% in Houston — top-decile yield for the area; either an underpriced asset or a hidden risk that comps aren't pricing in. Stress-test before assuming the spread holds.
Location & tenants
- Location reads 74/100 on livability (#184 in TX, #4,771 nationally) — a middle-class / working-renter tenant base. Strengths: amenities A+, cost of living A+, housing A+; Watch: schools D, crime F.
- Houston ISD (urban): math 27% / reading 35% proficiency, ranked #593 of 826 in TX (top 72%) — families likely to look elsewhere, expect single-tenant / working-renter base with shorter leases; 71% free/reduced lunch — lower-income household profile, screen leases tightly.
- Market conditions: Rents flat; 595 active listings in the ZIP; 40 comparable units currently listed for rent nearby; rentals lingering (median 44d on market — plan ~5-8 weeks vacancy on turnover, expect pricing pressure); 52% of comp listings sitting > 30 days — soft ceiling on asking rent; solid renter incomes; 29,883 units permitted in Harris County in 2024 (8,621 in 5+ unit buildings).
Forward outlook
- Local home prices are declining (-3.0%/yr); year-one equity from $1k of loan paydown is wiped out by about $6k of value loss. Plan a longer hold.
- Harris County population projected at +47% by 2050 — long-run rental-demand tailwind backs the buy-and-hold thesis.
Negotiation context
- It's been on market 76 days — a 6% lower offer ($188k) is reasonable based on typical stale-listing flexibility.
- 7 sale attempts since 3y ago with the ask held roughly flat each time — persistent listings suggest the price (not the market) is what's stuck; bring a comps-based counter.
Risks & watch-outs
- Watch-outs: built in 1910 — expect roof / HVAC / electrical / plumbing capex.
- Climate carrying-cost: severe wind risk, 99% chance of damaging wind over 30y; extreme-heat days projected 7→23/yr by 2055 (HVAC capex compounding) — expect insurance premiums to compound above CPI over the hold.
Questions for the listing agent
- It's been on market 76 days. Have you received any prior offers? Is the seller open to a 6% concession, seller financing, or rate buy-down credit?
- Built in 1910 — when were the roof, HVAC, electrical panel, plumbing, and water heater last replaced?
- Why hasn't it sold? Are there any deal-killer items the seller is aware of (foundation, flood, title, zoning, code violations)?
- Is there a deadline driving the sale (1031 exchange, divorce, estate, relocation)? That informs how much negotiation room exists.
- Schools are D-rated, which usually means shorter tenancies and higher turnover. Who's the typical renter profile here, and what's been the actual vacancy rate?
- Crime grade is F in this area — have there been break-ins, vandalism, or insurance claims at this property in the last 3 years? What carrier currently insures it and at what premium?
- What's the average days-on-market for RENTAL listings here right now (not sales)? A rising rental-DOM trend means longer vacancies and softer asking-rent achievability than the comps imply.
- What's the recent tenant-quality profile in this submarket — average credit score on applications, eviction rate, late-payment / NSF rate, and stable-employment percentage? A property-management company in the area should have these aggregated.
- How much new for-sale + rental construction is in the pipeline within 1–3 miles? Heavy new supply typically softens prices + rents 12–24 months out; constrained supply supports both.
Investment metrics
- 1% rule
- 1.00% ✗
- Cap rate
- 6.58%
- Cash-on-cash
- 1.03%
- DSCR
- 1.05
- GRM
- 8.3
CMA / ARV
- ARV (median comp)
- $322,787
- List price
- $199,999
- Delta
- -38.04%
- Verdict
- UNDERPRICED
- Comps
- 20 within 1.0 mi
Show comp detail 12 sales within ~0.75 mi
| Address | Dist | Beds/Ba | Sqft | Sold | Price | $/sf | Match |
|---|---|---|---|---|---|---|---|
| 2109 Gentry St | 0.11mi | 3/1.5 (+1) | 1,292 (+3%) | 2mo | $215,000 | $166 | 81 |
| 2309 Chestnut St | 0.28mi | 2/1.0 | 1,192 (-5%) | 3mo | $225,000 | $189 | 76 |
| 1118 Hammock St | 0.53mi | 3/1.5 (+1) | 1,252 (-0%) | 7mo | $280,000 | $224 | 62 |
| 1804 Fletcher St | 0.31mi | 2/1.0 | 1,080 (-14%) | 3mo | $315,000 | $292 | 60 |
| 2715 Chapman St | 0.64mi | 2/2.0 | 1,214 (-3%) | 2mo | $175,997 | $145 | 59 |
| 2710 Gano St | 0.62mi | 3/2.0 (+1) | 1,265 (+1%) | 2mo | $325,000 | $257 | 59 |
| 2827 Robertson St | 0.67mi | 2/1.0 | 1,317 (+5%) | 2mo | $235,000 | $178 | 59 |
| 1816 Mckee St | 0.49mi | 3/1.0 (+1) | 1,170 (-7%) | 5mo | $200,000 | $171 | 57 |
| 2112 Terry St | 0.47mi | 3/1.0 (+1) | 1,132 (-10%) | 2mo | $119,500 | $106 | 55 |
| 2602 Atlantic St | 0.49mi | 2/1.0 | 1,108 (-12%) | 4mo | $95,000 | $86 | 54 |
| 1409 Morris St | 0.59mi | 3/3.0 (+1) | 1,148 (-8%) | 0mo | $315,000 | $274 | 45 |
| 1912 Semmes St | 0.74mi | 2/1.0 | 1,104 (-12%) | 2mo | $65,000 | $59 | 44 |
Match score weights: distance 35% · size 25% · config 20% · recency 20%. Top-matched comps best support the ARV.
Projected returns pro-forma
-3.0% appreciation · 0.84% rent growth · sell at horizon
- IRR
- -17.3%
- Equity multiple
- 0.40×
- Total profit
- $-33,490
- Equity at exit
- $29,821
- IRR
- -14.4%
- Equity multiple
- 0.26×
- Total profit
- $-41,443
- Equity at exit
- $17,292
Cash invested: $56,000 (down + closing). Projections, not guarantees.
Landlord ↔ Tenant lean methodology
- Overall (STATE)
- 87 Strongly Landlord-Friendly
- State Texas
- 87 Strongly Landlord-Friendly · R+5
- County
- — inherits STATE
- City
- — inherits STATE
ZIP-level market 77009
- Rents YoY
- 0.8%
- Active inventory
- 595
- Price-to-rent
- 8.3×
Monthly cashflow live
- Estimated rent
- $1,997 high interval (Pro) →
- Mortgage (P&I)
- −$1,049
- Tax from tax record
- −$398 /mo · $4,772/yr
- Insurance
- −$83
- HOA
- −$0
- Vacancy / Maint / Mgmt
- −$419
- Net cashflow
- $48
Break-even live
UW: 25.0% down · 7.5% · 30yr · 1.5% tax · 5.0% vac · 8.0% maint · 8.0% mgmt
Financing live
Cash to close
- Down payment
- $50,000
- Closing costs
- $6,000
- Reserves months
- —
- Total cash needed
- —
Loan-product check · same deal, 3 products live
Conventional
25% down · 7.5% · 30yr
- Down + closing
- —
- Monthly P&I
- —
- Monthly cashflow
- —
- DSCR
- —
- Eligible?
- —
Personal DTI + credit; lowest rate.
DSCR
20% down · 8.5% · 30yr
- Down + closing
- —
- Monthly P&I
- —
- Monthly cashflow
- —
- DSCR
- —
- Eligible?
- —
No personal income docs; deal must DSCR.
Hard money
10% down · 12.0% · 12mo
- Down + closing
- —
- Monthly P&I
- —
- Monthly cashflow
- —
- DSCR
- —
- Eligible?
- —
Short-term bridge; refi at stabilization.
Rent comps 40 comps
| Address | Beds | Baths | Sqft | Rent | $/sqft | DOM | Units | Dist |
|---|---|---|---|---|---|---|---|---|
| 2016 N Main St Houston, TX | 2.0 | 2.0 | 1169 | $2,200 | $1.88 | 43d | 1 | 0.14mi |
| 410 James St Unit 1031793P Houston, TX | 3.0 | 2.0 | 1593 | $7,554 | $4.74 | 16d | 1 | 0.22mi |
| 410 James St Houston, TX | 3.0 | 2.0 | 1602 | $6,750 | $4.21 | 43d | 1 | 0.22mi |
| 1725 N Main St Houston, TX | 2.0 | 2.0 | 988 | $2,263 | $2.29 | 43d | 1 | 0.22mi |
| 412 Paschall St Unit 1316398P Houston, TX | 3.0 | 2.0 | 1130 | $4,840 | $4.28 | 12d | 1 | 0.23mi |
| 1625 N Main St Houston, TX | 3.0 | 1.0–3.0 | 994 | $2,007 | $2.02 | 3d | 42 | 0.28mi |
| 1514 Everett St Houston, TX | 2.0 | 1.0 | 970 | $1,840 | $1.90 | 19d | 1 | 0.32mi |
| 2310 N Main St Houston, TX | 2.0 | 2.0 | 997 | $1,687 | $1.69 | 43d | 1 | 0.32mi |
| 200 Hogan St Houston, TX | 2.0 | 2.0 | 1058 | $1,904 | $1.80 | 12d | 1 | 0.39mi |
| 207 Carl St Houston, TX | 2.0 | 2.0 | 1230 | $2,250 | $1.83 | 43d | 1 | 0.51mi |
| 1250 Leona St Houston, TX | 2.0 | 1.0–2.0 | 885 | $1,990 | $2.25 | 2d | 16 | 0.51mi |
| 2623 Keene St Apt 514 Houston, TX | 1.0 | 1.0 | 1178 | $1,949 | $1.65 | 43d | 1 | 0.52mi |
| 2623 Keene St Houston, TX | 2.0 | 1.0–2.0 | 965 | $3,280 | $3.40 | 16d | 44 | 0.52mi |
| 1550 Leona St Unit 1587 Houston, TX | 2.0 | 2.0 | 1131 | $1,942 | $1.72 | 43d | 1 | 0.56mi |
| 1550 Leona St Houston, TX | 1.0–2.0 | 1.0–2.0 | 835 | $1,905 | $2.28 | 1d | 19 | 0.57mi |
| 1556 Leona St Houston, TX | 1.0 | 1.0 | 905 | $1,505 | $1.66 | 43d | 1 | 0.60mi |
| 2706 Cochran St Houston, TX | 3.0 | 3.5 | 1791 | $2,700 | $1.51 | 19d | 1 | 0.61mi |
| 306 North St Houston, TX | 2.0 | 1.0 | 950 | $1,150 | $1.21 | 43d | 1 | 0.72mi |
| 1499 Crockett St Houston, TX | 2.0 | 2.0 | 1062 | $2,424 | $2.28 | 24d | 1 | 0.80mi |
| 1714 Mary St Houston, TX | 2.0 | 2.0 | 1100 | $2,400 | $2.18 | 43d | 1 | 0.82mi |
| 1512 Crockett St Unit A Houston, TX | 2.0 | 2.5 | 1808 | $2,800 | $1.55 | 43d | 1 | 0.83mi |
| 711 William St Houston, TX | 1.0 | 1.0 | 1340 | $2,250 | $1.68 | 43d | 1 | 0.84mi |
| 711 William St Houston, TX | 1.0 | 1.0 | 960 | $1,700 | $1.77 | 18d | 1 | 0.84mi |
| 6 N Main St Houston, TX | 2.0 | 2.0 | 1248 | $2,453 | $1.97 | 20d | 1 | 0.84mi |
| 6 N Main St Houston, TX | 2.0 | 2.0 | 1248 | $2,453 | $1.97 | 43d | 1 | 0.84mi |
| 650 McKee St Unit 3174 Houston, TX | 3.0 | 2.0 | 1136 | $2,114 | $1.86 | 11d | 1 | 0.97mi |
| 650 McKee St Unit 424 Houston, TX | 2.0 | 2.0 | 966 | $1,690 | $1.75 | 5d | 1 | 0.97mi |
| 650 McKee St Unit 683 Houston, TX | 3.0 | 2.0 | 1136 | $2,125 | $1.87 | 43d | 1 | 0.97mi |
| 650 McKee St Unit 2148 Houston, TX | 2.0 | 2.0 | 966 | $1,682 | $1.74 | 3d | 1 | 0.97mi |
| 650 McKee St Unit 3112 Houston, TX | 3.0 | 2.0 | 1136 | $2,082 | $1.83 | 3d | 1 | 0.97mi |
| 650 McKee St Unit 687 Houston, TX | 2.0 | 2.0 | 966 | $1,715 | $1.78 | 43d | 1 | 0.97mi |
| 650 McKee St Apt 422 Houston, TX | 2.0 | 2.0 | 966 | $1,690 | $1.75 | 7d | 1 | 0.97mi |
| 650 McKee St Unit 2174 Houston, TX | 2.0 | 2.0 | 966 | $1,714 | $1.77 | 11d | 1 | 0.97mi |
| 650 McKee St Apt 425 Houston, TX | 2.0 | 2.0 | 966 | $1,725 | $1.79 | 5d | 1 | 0.97mi |
| 915 Franklin St Unit 3-324 Houston, TX | 2.0 | 2.0 | 1158 | $2,498 | $2.16 | 43d | 1 | 0.98mi |
| 915 Franklin St Unit ID51118 Houston, TX | 2.0 | 2.0 | 1342 | $2,000 | $1.49 | 43d | 1 | 0.98mi |
| 915 Franklin St Unit 1-349 Houston, TX | 1.0 | 1.0 | 950 | $1,785 | $1.88 | 43d | 1 | 0.98mi |
| 915 Franklin St Unit 312202 Houston, TX | 2.0 | 2.0 | 1398 | $1,987 | $1.42 | 43d | 1 | 0.98mi |
| 201 Main St Unit 12258 Houston, TX | 2.0 | 2.0 | 1308 | $2,250 | $1.72 | 43d | 1 | 1.04mi |
| 201 Main St Unit 10225 Houston, TX | 1.0 | 1.0 | 910 | $1,458 | $1.60 | 43d | 1 | 1.04mi |
Listing history 29 events
-
2026-06-18days on market $199,999 Active 76 DOM
-
2026-06-17days on market $199,999 Active 75 DOM
-
2026-06-16days on market $199,999 Active 74 DOM
-
2026-06-15days on market $199,999 Active 73 DOM
-
2026-06-13days on market $199,999 Active 71 DOM
-
2026-06-10days on market $199,999 Active 67 DOM
-
2026-06-08days on market $199,999 Active 66 DOM
-
2026-06-07days on market $199,999 Active 65 DOM
-
2026-06-04days on market $199,999 Active 62 DOM
-
2026-06-01days on market $199,999 Active 59 DOM
-
2026-05-31days on market $199,999 Active 58 DOM
-
2026-04-03$199,999 Active 375-char remark
Show marketing remark (375 chars)
Looking for your next investment property? Look no further! Check out this property located in the Allen subdivision. Two bedrooms, one bathroom and 1,255 square feet. Walking distance to Ketelsen Elementary, Marshall Middle and Northside High. Minutes from Woodland Park. Convenient to I-45. Roughly 10 minutes from downtown Houston. You don't want to miss this opportunity!
-
2025-12-04historical
-
2025-10-02price $179,000
-
2025-05-20$250,000 Active
-
2025-03-30historical
-
2024-11-05status Active
-
2024-09-28status Pending
-
2024-09-12price $240,000
-
2024-05-09$270,000 Active
-
2024-01-29historical
-
2024-01-17price $269,999
-
2023-11-02price $279,999
-
2023-10-31status Active
-
2023-10-27status Pending
-
2023-10-12status Active
-
2023-09-28status Pending
-
2023-08-30$289,999 Active
-
1991-10-18soldstatus
ⓘ Source: listings_history table (triggers on properties + properties_extension) + one-shot
backfill from property_details.listing_events for pre-trigger history.
Tax reassessment forecast TX · Resets to sale price
- Current annual tax
- $4,772 · $398/mo
- Projected year-2 tax
- $4,772 · $398/mo
- Expected delta
- $0/yr ($0/mo · 0.0%)
ⓘ Screening estimate from a state-policy table — verify with the county assessor before closing.
Climate risk First Street
- Flood 1/10 Low FEMA zone X (unshaded) · 0% chance over 30 yrs
- Wildfire 1/10 Low
- Heat 9/10 Extreme 7 d/yr ≥109°F today · 23 d/yr by 30 yrs out
- Wind 9/10 Extreme 99% chance of damaging wind over 30 yrs
- Air quality 3/10 Moderate 2 unhealthy d/yr today · 3 by 30 yrs out
Nearby sold comps map
Loading sold comps map…
Walkable amenities ~0.75 mi
Loading nearby amenities…
Taxation est. · year 1
- Rental income
- $23,965
- − Mortgage interest
- −$11,203
- − Property taxes
- −$4,772
- − Insurance
- −$1,000
- − Repairs & maintenance
- −$1,917
- − Management
- −$1,917
- − Depreciation
- −$5,818
- Taxable loss
- −$2,663
- Est. tax savings @ 24.0%
- +$639
- After-tax cash flow
- $1,213/yr
For passive investors: Depreciation is non-cash, so a rental often shows a tax loss while cash-flowing — sheltering income. Rental losses are passive: they offset passive income freely, and up to $25,000/yr can offset ordinary (W-2) income if you actively participate and your MAGI is under $100k (phasing out to $0 by $150k); unused losses carry forward. On sale, claimed depreciation is recaptured at up to 25%, and gains may owe capital-gains tax (a 1031 exchange can defer both). Figures are a year-1 estimate at your 24.0% rate — not tax advice; consult a CPA.
Schools (NCES district)
- District
- Houston ISD
- NCES district ID
- 4823640
- Math proficiency
- 27% ▼ -18.00%
- Reading proficiency
- 35% ▼ -6.00%
- Median HH income
- $46,054
- Composite
- 26.63/100
- National rank
- #7173
- State rank
- #593 of 826 in TX
Livability — Houston
- Score
- 74/100
- State rank
- #184
- US rank
- #4771
Category grades
Schools grade is shown separately in the Schools card above.
Census & demographics
- Census place
- Houston, TX
- County
- Harris County · 4,702,590 people
- City population
- 3,226,434
- Metro
- Houston-The Woodlands-Sugar Land, TX
- Population (ZIP)
- 35,769
- Household income
- $83,148
- Rent vs Own
- Severe rent burden
- 994.0
Population outlook (Harris County) Hauer SSP2
- Today (2025)
- 5,571,493 people
- By 2030
- 6,089,821 · +9.3%
- By 2040
- 7,142,806 · +28.2%
- By 2050
- 8,185,864 · +46.9%
- By 2075
- 10,574,329 · +89.8%
- By 2100
- 12,109,958 · +117.4%
Race, ethnicity, and origin ACS 2023
- Neighborhood character
- Diverse neighborhood (Simpson 0.60)
- Race & ethnicity
- Hispanic / Latino 53% White 33% Two or more races 22% Black 8% Asian 3%
- Hispanic origin (detail)
- Mexican 46%
- Common ancestry
- Italian 2% Lithuanian 2% Slovak 1%
- Foreign-born
- 20% · Canada
- Languages at home
- 55% English-only · Spanish 40% Other Indo-European 2% Other Asian/Pacific 1%
Political lean MEDSL · Harris
- 2024 margin
- Lean D (+5.5) · D 52.0% · R 46.4% · Other 1.6%
- 2008→2024 swing
- +3.9pp toward D · 2008: 1.6pp · 2024: 5.5pp
- All cycles
- 2024: D+5.5 2020: D+13.3 2016: D+12.4 2012: D+0.1 2008: D+1.6
Not yet ingested
- Civics
- —
Market trends
- HPI YoY
- ▼ -533.57%
- Current HPI
- 219.5037
- Rent YoY
- ▲ 0.84%
- Metro
- Houston-The Woodlands-Sugar Land, TX
- State GDP YoY
- ▲ 3.95%
- F500 in state
- 110
Industry mix (Fortune 500 HQ in TX)
| Industry | F500 HQs | Revenue |
|---|---|---|
| Energy | 16 | $1,198B |
|
||
| Technology | 5 | $198B |
|
||
| Engineering / Construction | 4 | $72B |
|
||
| Energy Services | 3 | $60B |
|
||
| Utilities | 3 | $41B |
|
||
| Healthcare | 2 | $330B |
|
||
Price history
-31.0% since first listed18 events — show timeline
- 2026-04-03 Listed $199,999 HARMLS
- 2025-12-04 Listing Removed — HARMLS
- 2025-10-02 Price Changed $179,000 HARMLS
- 2025-05-20 Listed $250,000 HARMLS
- 2025-03-30 Listing Removed — HARMLS
- 2024-11-05 Relisted — HARMLS
- 2024-09-28 Pending — HARMLS
- 2024-09-12 Price Changed $240,000 HARMLS
- 2024-05-09 Listed $270,000 HARMLS
- 2024-01-29 Listing Removed — HARMLS
- 2024-01-17 Price Changed $269,999 HARMLS
- 2023-11-02 Price Changed $279,999 HARMLS
- 2023-10-31 Relisted — HARMLS
- 2023-10-27 Pending — HARMLS
- 2023-10-12 Relisted — HARMLS
- 2023-09-28 Pending — HARMLS
- 2023-08-30 Listed $289,999 HARMLS
- 1991-10-18 Sold (Public Records) — Public Records
Property tax history
+10.0%/yrLatest (2025): $4,772 · +1.4% YoY. Source: county tax records.
Cash-flow waterfall
monthlySold comps — $/sqft
last 12 mo · ≤1 miLoading sold comps…