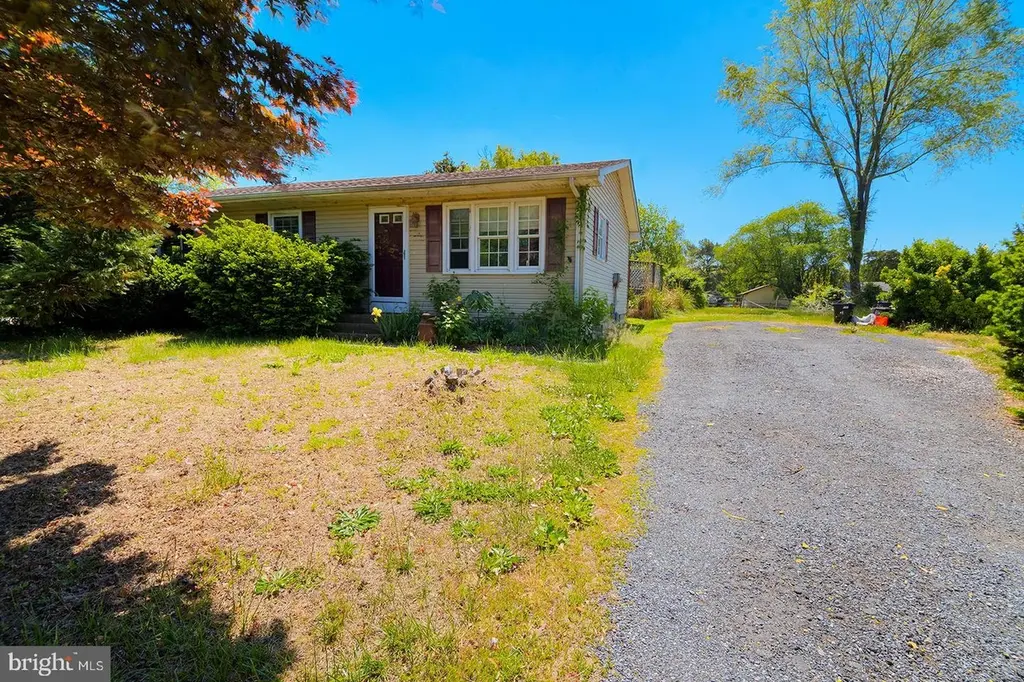
9186 E Mayhew Dr · Milford, DE
Flood risk 1/10 · Minimal
- FEMA flood zone
- X (unshaded)
- Chance of flooding over 30 yrs
- 0.0%
- Est. flood insurance / yr
- $473 – $860
Fire risk 2/10 · Minimal
- Est. fire insurance / yr
- $476 – $884
Heat risk 8/10 · Major
- Hot days now (above 101°F)
- 7 days/yr
- Hot days in 30 yrs
- 17 days/yr
Wind risk 8/10 · Major
- Chance of severe wind over 30 yrs
- 80.0%
Air-quality risk 2/10 · Minimal
- Unhealthy air days now
- 1 days/yr
- Unhealthy air days in 30 yrs
- 1 days/yr
Risk factors via First Street. Map © Google.
Why this score? — see what drove the C+ grade
The composite is a weighted blend of 9 inputs, each scored 0–100. Each bar is that input's sub-score; the figure is the points it added to the 100-point composite (weight × sub-score).
- Cash flow +16.9/30.0
- ARV discount +15.0/15.0
- Appreciation +10.0/10.0
- DSCR +5.2/10.0
- Schools +4.2/10.0
- 1% rule +3.2/10.0
- Livability +3.1/5.0
- Rent growth +2.5/5.0
- Condition / age +2.5/5.0
$249,000
🖨 Deal sheet (PDF) 📄 Offer letter ✓ Due diligence
Listing remarks
Charming detached ranch home situated on a west-facing corner lot, offering a functional layout and plenty of potential. Built in 1971, the home features approximately 1,344 square feet on the main level, along with a full basement providing additional space for storage or future finishing. The main level includes 3 bedrooms and 1 full bathroom, featuring a mix of carpet and vinyl/linoleum flooring throughout. An architectural shingle roof and private well add to the home’s practicality. Enjoy outdoor living with an above-ground pool, perfect for seasonal relaxation. A crushed stone driveway provides off-street parking for up to four vehicles, and a rear ramp enhances accessibility. P
Key facts
- Rear ramp
- Full basement
- Above-ground pool
Tags
Property features AI
Finance
- Other: Fee simple ownership; No pet restrictions (pets allowed)
Exterior
- Parking: Driveway parking with six spaces; Crushed stone driveway
- Utilities: Well water; Private septic tank; Electric heating and cooling; Multi-tank hot water
- Home design: Detached home; Estimated above-grade and below-grade finished living areas; Not in a federal flood zone
- Construction: Block construction; Block foundation; Architectural shingle roof; Built year per assessor
- Exterior features: Corner lot; Above-ground personal pool; Shed; Ramp to main level (accessibility)
Interior
- Kitchen: Gas range; Oven; Refrigerator; Icemaker; Dishwasher; Microwave; Exhaust fan
- Bedrooms: Three bedrooms on the main level
- Flooring: Carpet; Vinyl
- Bathrooms: One full bathroom on the main level
- Heating & cooling: Heat pump heating; Central air conditioning (electric)
- Interior features: Ceiling fans; Storm door; Storm and screened windows; Full basement
- Laundry & utility: Washer and dryer; Laundry on lower floor; Multi-tank hot water system
Neighborhood map
What this means for you Summary
Snapshot
- This is a 3-bed/1.0-bath single-family listed at $249k.
Deal economics
- At list price, monthly cash flow is $163 ($2k/yr) — positive.
- The deal already cash-flows at list — no discount required.
- To meet the 1% rule (rent ≥ 1% of price), the offer needs to be $205k (17.6% below list).
- Recommended offer: $205k (17.6% below list) — sets the bar for 1% rule.
- Cap rate 7.1% vs local median 3.7% in Milford — top-decile yield for the area; either an underpriced asset or a hidden risk that comps aren't pricing in. Stress-test before assuming the spread holds.
Location & tenants
- Location reads 62/100 on livability (#61 in DE) — a middle-class / working-renter tenant base. Strengths: cost of living A+, health & safety A+, housing A-; Watch: crime F, amenities F, commute F.
- Cape Henlopen School District (town): math 42% / reading 55% proficiency, ranked #5 of 26 in DE (top 19%) — families likely to look elsewhere, expect single-tenant / working-renter base with shorter leases.
- Zoned schools: Cape Henlopen High School (math 26% / reading 51%, grade F, #14 of 40 statewide, top 33%, 1,813 students, 0% FRL) — zoned schools average 0% FRL vs 41% district-wide (41 pts lower); this property's tenant base skews higher-income than the district average.
- Market conditions: 88 active listings in the ZIP; 4,354 units permitted in Sussex County in 2024 (344 in 5+ unit buildings).
Forward outlook
- In year one you build about $27k of equity ($2k loan paydown + $25k appreciation (10.0% local appreciation)).
- Sussex County population projected at +25% by 2050 — long-run rental-demand tailwind backs the buy-and-hold thesis.
- At projected returns (10.0% appreciation + 3.0% rent growth), your $70k cash investment doubles in ~3 years — after that, you're playing with house money.
- By year 2, paydown + projected appreciation supports a ~$43k cash-out refi (75% LTV) — recoverable capital for the next deal without selling this one.
Negotiation context
- It's been on market 35 days — a 3% lower offer ($242k) is reasonable based on typical stale-listing flexibility.
Risks & watch-outs
- Climate carrying-cost: severe wind risk, 80% chance of damaging wind over 30y; extreme-heat days projected 7→17/yr by 2055 (HVAC capex compounding) — expect insurance premiums to compound above CPI over the hold.
Questions for the listing agent
- It's been on market 35 days. Have you received any prior offers? Is the seller open to a 18% concession, seller financing, or rate buy-down credit?
- Built in 1971 — when were the roof, HVAC, electrical panel, plumbing, and water heater last replaced?
- Is there a deadline driving the sale (1031 exchange, divorce, estate, relocation)? That informs how much negotiation room exists.
- Schools are D-rated, which usually means shorter tenancies and higher turnover. Who's the typical renter profile here, and what's been the actual vacancy rate?
- Crime grade is F in this area — have there been break-ins, vandalism, or insurance claims at this property in the last 3 years? What carrier currently insures it and at what premium?
- What's the average days-on-market for RENTAL listings here right now (not sales)? A rising rental-DOM trend means longer vacancies and softer asking-rent achievability than the comps imply.
- What's the recent tenant-quality profile in this submarket — average credit score on applications, eviction rate, late-payment / NSF rate, and stable-employment percentage? A property-management company in the area should have these aggregated.
- How much new for-sale + rental construction is in the pipeline within 1–3 miles? Heavy new supply typically softens prices + rents 12–24 months out; constrained supply supports both.
Investment metrics
- 1% rule
- 0.82% ✗
- Cap rate
- 7.08%
- Cash-on-cash
- 2.81%
- DSCR
- 1.12
- GRM
- 10.1
CMA / ARV
- ARV (median comp)
- $452,963
- List price
- $249,000
- Delta
- -45.03%
- Verdict
- UNDERPRICED
- Comps
- 11 within 1.0 mi
Show comp detail 6 sales within ~0.75 mi
| Address | Dist | Beds/Ba | Sqft | Sold | Price | $/sf | Match |
|---|---|---|---|---|---|---|---|
| 21146 Adams Cir | 0.08mi | 3/1.0 | 1,000 (-5%) | 4mo | $245,000 | $245 | 84 |
| 20764 Fleatown Rd | 0.10mi | 3/1.0 | 1,056 (0%) | 15mo | $265,000 | $251 | 83 |
| 20999 Cubbage Pond Rd | 0.20mi | 3/1.0 | 1,056 (0%) | 20mo | $270,000 | $256 | 74 |
| 20991 Mayhew Dr | 0.18mi | 3/1.5 | 1,056 (0%) | 22mo | $275,000 | $260 | 71 |
| 21039 Cubbage Pond Rd | 0.24mi | 3/1.0 | 1,056 (0%) | 23mo | $285,000 | $270 | 70 |
| 20774 Fleatown Rd | 0.08mi | 4/1.0 (+1) | 1,152 (+9%) | 23mo | $235,000 | $204 | 57 |
Match score weights: distance 35% · size 25% · config 20% · recency 20%. Top-matched comps best support the ARV.
Projected returns pro-forma
10.0% appreciation · 3.0% rent growth · sell at horizon
- IRR
- 26.3%
- Equity multiple
- 3.09×
- Total profit
- $145,876
- Equity at exit
- $224,319
- IRR
- 23.0%
- Equity multiple
- 7.04×
- Total profit
- $421,148
- Equity at exit
- $483,752
Cash invested: $69,720 (down + closing). Projections, not guarantees.
Landlord ↔ Tenant lean methodology
- Overall (STATE)
- 70 Landlord-Friendly
- State Delaware
- 70 Landlord-Friendly · D+7
- County
- — inherits STATE
- City
- — inherits STATE
ZIP-level market 19960
- Home prices YoY
- 23.9%
- Active inventory
- 88
- Price-to-rent
- 10.1×
Monthly cashflow live
- Estimated rent
- $2,053 medium interval (Pro) →
- Mortgage (P&I)
- −$1,306
- Tax from tax record
- −$49 /mo · $586/yr
- Insurance
- −$104
- HOA
- −$0
- Vacancy / Maint / Mgmt
- −$431
- Net cashflow
- $163
Break-even live
Sensitivity live
| Price | -10% $304 | -5% $234 | +0% $163 | +5% $93 | +10% $22 |
|---|---|---|---|---|---|
| Rent | -10% $1 | -5% $82 | +0% $163 | +5% $244 | +10% $325 |
| Rate | -1.0pp $289 | -0.5pp $227 | base $163 | +0.5pp $99 | +1.0pp $33 |
UW: 25.0% down · 7.5% · 30yr · 1.5% tax · 5.0% vac · 8.0% maint · 8.0% mgmt
Financing live
Cash to close
- Down payment
- $62,250
- Closing costs
- $7,470
- Reserves months
- —
- Total cash needed
- —
Loan-product check · same deal, 3 products live
Conventional
25% down · 7.5% · 30yr
- Down + closing
- —
- Monthly P&I
- —
- Monthly cashflow
- —
- DSCR
- —
- Eligible?
- —
Personal DTI + credit; lowest rate.
DSCR
20% down · 8.5% · 30yr
- Down + closing
- —
- Monthly P&I
- —
- Monthly cashflow
- —
- DSCR
- —
- Eligible?
- —
No personal income docs; deal must DSCR.
Hard money
10% down · 12.0% · 12mo
- Down + closing
- —
- Monthly P&I
- —
- Monthly cashflow
- —
- DSCR
- —
- Eligible?
- —
Short-term bridge; refi at stabilization.
Listing history 17 events
-
2026-06-18days on market $249,000 Active 35 DOM
-
2026-06-17days on market $249,000 Active 34 DOM
-
2026-06-16days on market $249,000 Active 33 DOM
-
2026-06-15days on market $249,000 Active 32 DOM
-
2026-06-14days on market $249,000 Active 30 DOM
-
2026-06-13days on market $249,000 Active 29 DOM
-
2026-06-10days on market $249,000 Active 27 DOM
-
2026-06-09days on market $249,000 Active 26 DOM
-
2026-06-08days on market $249,000 Active 25 DOM
-
2026-06-07days on market $249,000 Active 24 DOM
-
2026-06-05days on market $249,000 Active 21 DOM
-
2026-06-03days on market $249,000 Active 20 DOM
-
2026-06-02days on market $249,000 Active 19 DOM
-
2026-06-01days on market $249,000 Active 18 DOM
-
2026-05-31days on market $249,000 Active 17 DOM
-
2026-05-30days on market $249,000 Active 16 DOM
-
2026-05-14$249,000 Active 753-char remark
ⓘ Source: listings_history table (triggers on properties + properties_extension) + one-shot
backfill from property_details.listing_events for pre-trigger history.
Tax reassessment forecast DE · Partial reset (capped growth)
- Current annual tax
- $586 · $49/mo
- Projected year-2 tax
- $1,015 · $85/mo
- Expected delta
- +$429/yr (+$36/mo · 73.2%)
ⓘ Screening estimate from a state-policy table — verify with the county assessor before closing.
Climate risk First Street
- Flood 1/10 Low FEMA zone X (unshaded) · 0% chance over 30 yrs
- Wildfire 2/10 Low
- Heat 8/10 Severe 7 d/yr ≥101°F today · 17 d/yr by 30 yrs out
- Wind 8/10 Severe 80% chance of damaging wind over 30 yrs
- Air quality 2/10 Low 1 unhealthy d/yr today · 1 by 30 yrs out
Nearby sold comps map
Loading sold comps map…
Walkable amenities ~0.75 mi
Loading nearby amenities…
Taxation est. · year 1
- Rental income
- $24,632
- − Mortgage interest
- −$13,948
- − Property taxes
- −$586
- − Insurance
- −$1,245
- − Repairs & maintenance
- −$1,971
- − Management
- −$1,971
- − Depreciation
- −$7,244
- Taxable loss
- −$2,332
- Est. tax savings @ 24.0%
- +$560
- After-tax cash flow
- $2,518/yr
For passive investors: Depreciation is non-cash, so a rental often shows a tax loss while cash-flowing — sheltering income. Rental losses are passive: they offset passive income freely, and up to $25,000/yr can offset ordinary (W-2) income if you actively participate and your MAGI is under $100k (phasing out to $0 by $150k); unused losses carry forward. On sale, claimed depreciation is recaptured at up to 25%, and gains may owe capital-gains tax (a 1031 exchange can defer both). Figures are a year-1 estimate at your 24.0% rate — not tax advice; consult a CPA.
Schools (NCES district)
- District
- Cape Henlopen School District
- NCES district ID
- 1000170
- Math proficiency
- 42% ▼ -14.00%
- Reading proficiency
- 55% ▼ -10.00%
- Median HH income
- $60,196
- Composite
- 42.47/100
- National rank
- #3214
- State rank
- #5 of 26 in DE
Livability — Milford
- Score
- 62/100
- State rank
- #61
- US rank
- #16211
Category grades
Schools grade is shown separately in the Schools card above.
Census & demographics
- Population (ZIP)
- 7,083
Population outlook (Sussex County) Hauer SSP2
- Today (2025)
- 248,853 people
- By 2030
- 264,464 · +6.3%
- By 2040
- 290,980 · +16.9%
- By 2050
- 311,259 · +25.1%
- By 2075
- 352,488 · +41.6%
- By 2100
- 367,406 · +47.6%
Race, ethnicity, and origin ACS 2023
- Neighborhood character
- Diverse neighborhood (Simpson 0.55)
- Race & ethnicity
- White 61% Black 23% Hispanic / Latino 14% Two or more races 10%
- Hispanic origin (detail)
- Mexican 7% Puerto Rican 3%
- Common ancestry
- Italian 4% Scandinavian 2% Romanian 2%
- Foreign-born
- 12% · Canada
- Languages at home
- 82% English-only · Spanish 14% Other Indo-European 2% Other Asian/Pacific 1%
Political lean MEDSL · Sussex
- 2024 margin
- R (+11.0) · D 43.9% · R 54.9% · Other 1.2%
- 2008→2024 swing
- -2.4pp toward R · 2008: -8.6pp · 2024: -11.0pp
- All cycles
- 2024: R+11.0 2020: R+11.2 2016: R+22.0 2012: R+13.0 2008: R+8.6
Not yet ingested
- Civics
- —
Market trends
- HPI YoY
- ▲ 71.02%
- Current HPI
- 367.6248
- Rent YoY
- —
- Metro
- —
- State GDP YoY
- —
- F500 in state
- 0
Price history
1 event — show timeline
- 2026-05-14 Listed $249,000 BRIGHT MLS
Property tax history
+3.5%/yrLatest (2025): $586 · +13.8% YoY. Source: county tax records.
Cash-flow waterfall
monthlySold comps — $/sqft
last 12 mo · ≤1 miLoading sold comps…