 🏗️ New Construction
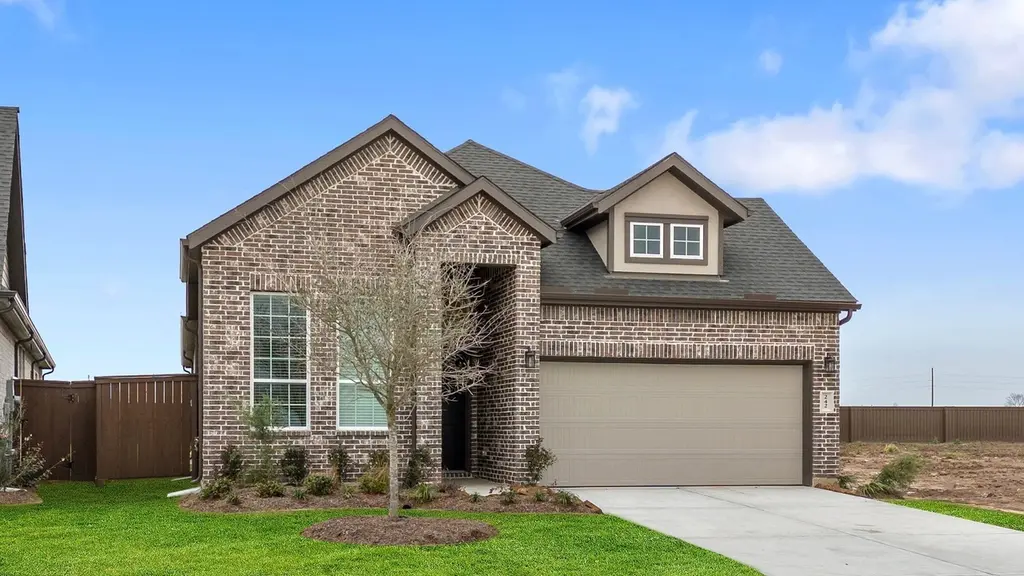
Oakley Plan · Sienna, TX
Flood risk 1/10 · Minimal
- FEMA flood zone
- X
- Chance of flooding over 30 yrs
- 0.0%
- Est. flood insurance / yr
- $507 – $1,088
Fire risk 4/10 · Minor
- Est. fire insurance / yr
- $1,222 – $2,270
Heat risk 9/10 · Severe
- Hot days now (above 111°F)
- 7 days/yr
- Hot days in 30 yrs
- 24 days/yr
Wind risk 9/10 · Severe
- Chance of severe wind over 30 yrs
- 99.0%
Air-quality risk 2/10 · Minimal
- Unhealthy air days now
- 2 days/yr
- Unhealthy air days in 30 yrs
- 2 days/yr
Risk factors via First Street. Map © Google.
Why this score? — see what drove the B- grade
The composite is a weighted blend of 9 inputs, each scored 0–100. Each bar is that input's sub-score; the figure is the points it added to the 100-point composite (weight × sub-score).
- Cash flow +26.6/30.0
- DSCR +9.1/10.0
- ARV discount +7.5/15.0
- 1% rule +7.1/10.0
- Schools +4.5/10.0
- Appreciation +4.2/10.0
- Condition / age +4.0/5.0
- Rent growth +2.5/5.0
- Livability +2.5/5.0
$419,990
🖨 Deal sheet (PDF) 📄 Offer letter ✓ Due diligence
Listing remarks
Plan #3594 | Single-story | 3 bedrooms | 2.5 baths | study/flex room option | 2-car attached garage |covered patio |Spacious family room with adjacent island kitchen and casual dining area. Master-suite located at the back of the home for privacy, includes bath with tub and shower, separate sinks as well as his and her walk-in closets. Utility room centrally located near secondary bedrooms. * * Photos are representative, selections & features may vary with community * *
Key facts
- Master suite
- Utility room
- Island kitchen
Tags
Property features AI
Finance
- Other: Address: 8730 Azalea Crossing Ct, Missouri City TX 77459
- Financial info: List price $419,990
Exterior
- Home design: Single-family home (Plan); Active listing
- Construction: New construction (2026 listing year implied)
- Exterior features: Living area approximately 2143
Interior
- Bedrooms: 3 bedrooms
- Bathrooms: 2 bathrooms
- Interior features: Plan: Oakley (new construction)
Neighborhood map
What this means for you Summary
Snapshot
- This is a 3-bed/2.0-bath single-family listed at $420k. Condition is rated good.
Deal economics
- At list price, monthly cash flow is $1k ($13k/yr) — positive.
- The deal already cash-flows at list — no discount required.
- Meets the 1% rule at list price ($5k rent vs $420k).
- Recommended offer: $414k (1.5% below list) — sets the bar for market timing.
- Cap rate 9.5% vs local median 3.3% in Sienna — top-decile yield for the area; either an underpriced asset or a hidden risk that comps aren't pricing in. Stress-test before assuming the spread holds.
Location & tenants
- Location reads: area grade B — affects rentability + tenant quality, not the cash-flow math above.
- Fort Bend ISD (suburban): math 44% / reading 53% proficiency, ranked #140 of 826 in TX (top 17%) — families likely to look elsewhere, expect single-tenant / working-renter base with shorter leases.
- Market conditions: Rents soft (-0.1%/yr); 1215 active listings in the ZIP; 3 comparable units currently listed for rent nearby; rentals at typical pace (median 23d on market — plan ~3-4 weeks tenant-placement turnaround); high-income renter base; 12,093 units permitted in Fort Bend County in 2024 (815 in 5+ unit buildings).
- This rent runs 45% of the median local income ($129k/yr) — at the standard rent-burdened threshold; future hikes will face affordability resistance.
Forward outlook
- Local home prices are declining (-1.7%/yr); year-one equity from $3k of loan paydown is wiped out by about $7k of value loss. Plan a longer hold.
- Fort Bend County population projected at +75% by 2050 — long-run rental-demand tailwind backs the buy-and-hold thesis.
Negotiation context
- It's been on market 29 days — a 2% lower offer ($414k) is reasonable based on typical stale-listing flexibility.
Risks & watch-outs
- Climate carrying-cost: severe wind risk, 99% chance of damaging wind over 30y; extreme-heat days projected 7→24/yr by 2055 (HVAC capex compounding) — expect insurance premiums to compound above CPI over the hold.
Questions for the listing agent
- Is there a deadline driving the sale (1031 exchange, divorce, estate, relocation)? That informs how much negotiation room exists.
- What's the average days-on-market for RENTAL listings here right now (not sales)? A rising rental-DOM trend means longer vacancies and softer asking-rent achievability than the comps imply.
- What's the recent tenant-quality profile in this submarket — average credit score on applications, eviction rate, late-payment / NSF rate, and stable-employment percentage? A property-management company in the area should have these aggregated.
- How much new for-sale + rental construction is in the pipeline within 1–3 miles? Heavy new supply typically softens prices + rents 12–24 months out; constrained supply supports both.
Investment metrics
- 1% rule
- 1.21% ✓
- Cap rate
- 9.50%
- Cash-on-cash
- 11.46%
- DSCR
- 1.51
- GRM
- 6.9
CMA / ARV
- ARV (on-the-fly)
- $398,598
- Comps found
- 12
Show comp detail 12 sales within ~0.75 mi
| Address | Dist | Beds/Ba | Sqft | Sold | Price | $/sf | Match |
|---|---|---|---|---|---|---|---|
| 1743 Country Air Ln | 0.29mi | 3/2.5 | 2,290 (+7%) | 6mo | $385,000 | $168 | 68 |
| 8723 Arbor Trail Dr | 0.24mi | 4/3.0 (+1) | 2,381 (+11%) | 3mo | $365,000 | $153 | 59 |
| 1610 Country Air Ln | 0.40mi | 4/3.0 (+1) | 2,388 (+11%) | 0mo | $369,900 | $155 | 53 |
| 9451 Garden Gate Dr | 0.63mi | 3/2.5 | 1,901 (-11%) | 1mo | $352,990 | $186 | 49 |
| 9447 Garden Gate Dr | 0.63mi | 3/2.5 | 1,866 (-13%) | 1mo | $354,990 | $190 | 46 |
| 9422 Autumn Vale Dr | 0.58mi | 3/2.5 | 1,878 (-12%) | 6mo | $355,000 | $189 | 46 |
| 9431 Garden Gate Dr | 0.60mi | 3/2.5 | 1,835 (-14%) | 1mo | $350,000 | $191 | 45 |
| 9439 Garden Gate Dr | 0.61mi | 3/2.5 | 1,878 (-12%) | 4mo | $349,990 | $186 | 45 |
| 9426 Spring Rain Dr | 0.58mi | 3/2.5 | 1,866 (-13%) | 6mo | $338,990 | $182 | 45 |
| 9454 Spring Rain Dr | 0.63mi | 3/2.5 | 1,878 (-12%) | 6mo | $349,990 | $186 | 43 |
| 9446 Spring Rain Dr | 0.61mi | 3/2.5 | 1,835 (-14%) | 4mo | $348,990 | $190 | 42 |
| 1456 Shaded Rock Dr | 0.70mi | 3/2.5 | 1,838 (-14%) | 3mo | $330,000 | $180 | 40 |
Match score weights: distance 35% · size 25% · config 20% · recency 20%. Top-matched comps best support the ARV.
Projected returns pro-forma
-1.67% appreciation · 0.0% rent growth · sell at horizon
- IRR
- 2.6%
- Equity multiple
- 1.11×
- Total profit
- $11,920
- Equity at exit
- $83,597
- IRR
- 7.2%
- Equity multiple
- 1.57×
- Total profit
- $63,938
- Equity at exit
- $77,431
Cash invested: $111,607 (down + closing). Projections, not guarantees.
Landlord ↔ Tenant lean methodology
- Overall (STATE)
- 87 Strongly Landlord-Friendly
- State Texas
- 87 Strongly Landlord-Friendly · R+5
- County
- — inherits STATE
- City
- — inherits STATE
ZIP-level market 77459
- Home prices YoY
- -0.8%
- Rents YoY
- -0.1%
- Active inventory
- 1215
- Price-to-rent
- 7.2×
Monthly cashflow live
- Estimated rent
- $4,836 medium interval (Pro) →
- Mortgage (P&I)
- −$2,090
- Tax est. 1.5%
- −$498 /mo · $5,979/yr
- Insurance
- −$166
- HOA
- −$0
- Vacancy / Maint / Mgmt
- −$1,016
- Net cashflow
- $1,066
Break-even live
Sensitivity live
| Price | -10% $1,341 | -5% $1,204 | +0% $1,066 | +5% $928 | +10% $791 |
|---|---|---|---|---|---|
| Rent | -10% $684 | -5% $875 | +0% $1,066 | +5% $1,257 | +10% $1,448 |
| Rate | -1.0pp $1,267 | -0.5pp $1,167 | base $1,066 | +0.5pp $963 | +1.0pp $858 |
UW: 25.0% down · 7.5% · 30yr · 1.5% tax · 5.0% vac · 8.0% maint · 8.0% mgmt
Financing live
Cash to close
- Down payment
- $99,650
- Closing costs
- $11,958
- Reserves months
- —
- Total cash needed
- —
Loan-product check · same deal, 3 products live
Conventional
25% down · 7.5% · 30yr
- Down + closing
- —
- Monthly P&I
- —
- Monthly cashflow
- —
- DSCR
- —
- Eligible?
- —
Personal DTI + credit; lowest rate.
DSCR
20% down · 8.5% · 30yr
- Down + closing
- —
- Monthly P&I
- —
- Monthly cashflow
- —
- DSCR
- —
- Eligible?
- —
No personal income docs; deal must DSCR.
Hard money
10% down · 12.0% · 12mo
- Down + closing
- —
- Monthly P&I
- —
- Monthly cashflow
- —
- DSCR
- —
- Eligible?
- —
Short-term bridge; refi at stabilization.
Rent comps 3 comps
| Address | Beds | Baths | Sqft | Rent | $/sqft | DOM | Units | Dist |
|---|---|---|---|---|---|---|---|---|
| 8719 Fox Trail Dr Missouri City, TX | 4.0 | 3.5 | 2143 | $6,000 | $2.80 | 22d | 1 | 0.15mi |
| 2142 Ironwood Pass Dr Missouri City, TX | 4.0 | 3.0 | 2140 | $6,000 | $2.80 | 1d | 1 | 0.16mi |
| 1714 Forest Mist Dr Missouri City, TX | 3.0 | 3.0 | 1979 | $3,000 | $1.52 | 44d | 1 | 0.91mi |
Listing history 12 events
-
2026-06-18days on market $419,990 Active 29 DOM
-
2026-06-17days on market $419,990 Active 28 DOM
-
2026-06-16days on market $419,990 Active 27 DOM
-
2026-06-15days on market $419,990 Active 26 DOM
-
2026-06-13days on market $419,990 Active 24 DOM
-
2026-06-09days on market $419,990 Active 20 DOM
-
2026-06-07days on market $419,990 Active 18 DOM
-
2026-06-04days on market $419,990 Active 15 DOM
-
2026-06-03days on market $419,990 Active 14 DOM
-
2026-06-02days on market $419,990 Active 13 DOM
-
2026-06-01days on market $419,990 Active 12 DOM
-
2026-05-31days on market $419,990 Active 11 DOM
ⓘ Source: listings_history table (triggers on properties + properties_extension) + one-shot
backfill from property_details.listing_events for pre-trigger history.
Climate risk First Street
- Flood 1/10 Low FEMA zone X · 0% chance over 30 yrs
- Wildfire 4/10 Moderate
- Heat 9/10 Extreme 7 d/yr ≥111°F today · 24 d/yr by 30 yrs out
- Wind 9/10 Extreme 99% chance of damaging wind over 30 yrs
- Air quality 2/10 Low 2 unhealthy d/yr today · 2 by 30 yrs out
Nearby sold comps map
Loading sold comps map…
Walkable amenities ~0.75 mi
Loading nearby amenities…
Taxation est. · year 1
- Rental income
- $58,035
- − Mortgage interest
- −$22,328
- − Property taxes
- −$5,979
- − Insurance
- −$1,993
- − Repairs & maintenance
- −$4,643
- − Management
- −$4,643
- − Depreciation
- −$11,596
- Taxable income
- $6,854
- Est. tax owed @ 24.0%
- −$1,645
- After-tax cash flow
- $11,147/yr
For passive investors: Depreciation is non-cash, so a rental often shows a tax loss while cash-flowing — sheltering income. Rental losses are passive: they offset passive income freely, and up to $25,000/yr can offset ordinary (W-2) income if you actively participate and your MAGI is under $100k (phasing out to $0 by $150k); unused losses carry forward. On sale, claimed depreciation is recaptured at up to 25%, and gains may owe capital-gains tax (a 1031 exchange can defer both). Figures are a year-1 estimate at your 24.0% rate — not tax advice; consult a CPA.
Condition & rehab AI · 9 photos
This single-story home is in excellent condition with modern finishes and a well-maintained exterior. It offers a spacious floor plan with a covered patio and a study/flex room option. The property is move-in ready and would benefit from minor updates to enhance curb appeal and energy efficiency.
Value-add opportunities
- Both Paint exterior brick — Enhances curb appeal and value
- Both Replace blinds with energy-efficient shades — Improves energy efficiency and aesthetics
- Both Install smart home devices — Enhances convenience and marketability
Renovation cost estimate screening
Value-add ROI direction
- Both Paint exterior brick — Enhances curb appeal and value ↑
- Both Replace blinds with energy-efficient shades — Improves energy efficiency and aesthetics ↑
- Both Install smart home devices — Enhances convenience and marketability ↑
ⓘ Cost ranges are severity-bucket heuristics (US national rule-of-thumb). Get contractor quotes + a written scope before underwriting a rehab budget.
Schools (NCES district)
- District
- Fort Bend ISD
- NCES district ID
- 4819650
- Math proficiency
- 44% ▼ -15.00%
- Reading proficiency
- 53% ▼ -4.00%
- Median HH income
- $82,360
- Composite
- 44.61/100
- National rank
- #2779
- State rank
- #140 of 826 in TX
Livability — Sienna
No livability data for this city. (Only ~50 U.S. cities are tracked.)
Census & demographics
- Census place
- Sienna, TX
- County
- Fort Bend County · 836,777 people
- Metro
- Houston-The Woodlands-Sugar Land, TX
- Population (ZIP)
- 84,221
- Household income
- $129,151
- Rent vs Own
- Severe rent burden
- 1004.0
Population outlook (Fort Bend County) Hauer SSP2
- Today (2025)
- 1,004,526 people
- By 2030
- 1,153,104 · +14.8%
- By 2040
- 1,453,718 · +44.7%
- By 2050
- 1,753,781 · +74.6%
- By 2075
- 2,455,772 · +144.5%
- By 2100
- 2,930,528 · +191.7%
Race, ethnicity, and origin ACS 2023
- Neighborhood character
- Highly diverse neighborhood (Simpson 0.75)
- Race & ethnicity
- White 34% Black 26% Asian 22% Hispanic / Latino 13% Two or more races 10%
- Hispanic origin (detail)
- Mexican 7%
- Common ancestry
- Lithuanian 2% Slovak 1% Italian 1%
- Foreign-born
- 21% · Canada, China, Vietnam
- Languages at home
- 73% English-only · Other Asian/Pacific 8% Spanish 7% Other Indo-European 5%
Political lean MEDSL · Fort Bend
- 2024 margin
- Toss-up / Even · D 49.5% · R 47.9% · Other 2.6%
- 2008→2024 swing
- +4.0pp toward D · 2008: -2.4pp · 2024: 1.6pp
- All cycles
- 2024: D+1.6 2020: D+10.6 2016: D+6.6 2012: R+6.8 2008: R+2.4
Not yet ingested
- Civics
- —
Market trends
- HPI YoY
- ▼ -1.67%
- Current HPI
- 212.3573
- Rent YoY
- ▼ -0.15%
- Metro
- Houston-The Woodlands-Sugar Land, TX
- State GDP YoY
- ▲ 3.95%
- F500 in state
- 110
Industry mix (Fortune 500 HQ in TX)
| Industry | F500 HQs | Revenue |
|---|---|---|
| Energy | 16 | $1,198B |
|
||
| Technology | 5 | $198B |
|
||
| Engineering / Construction | 4 | $72B |
|
||
| Energy Services | 3 | $60B |
|
||
| Utilities | 3 | $41B |
|
||
| Healthcare | 2 | $330B |
|
||
Cash-flow waterfall
monthlySold comps — $/sqft
last 12 mo · ≤1 miLoading sold comps…