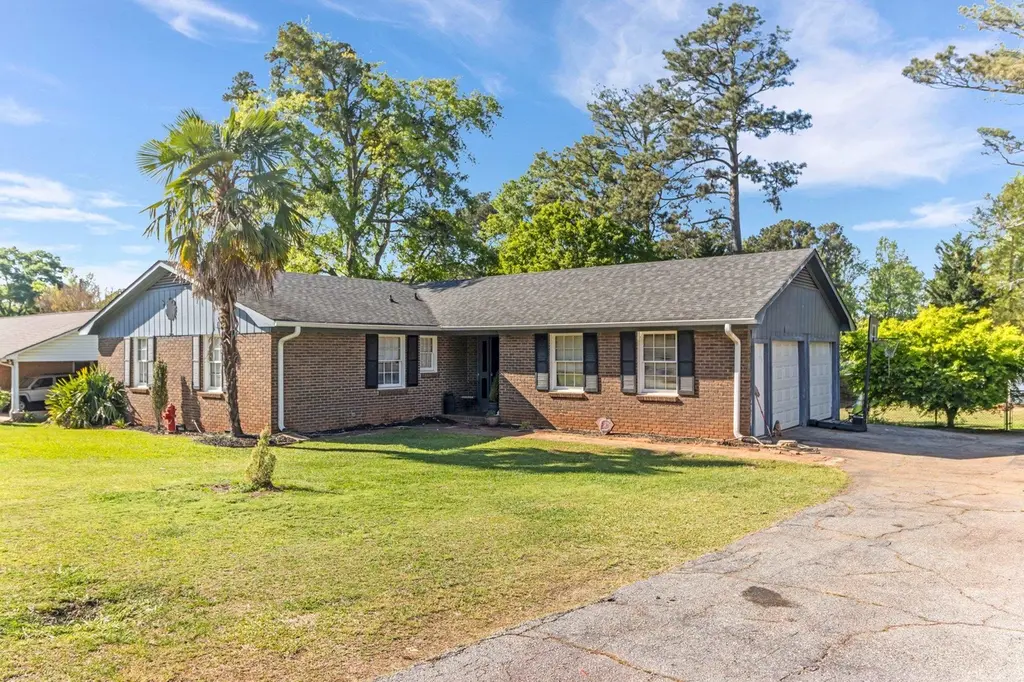
118 Wren Ln · Boiling Springs, SC
Flood risk 1/10 · Minimal
- FEMA flood zone
- X (unshaded)
- Chance of flooding over 30 yrs
- 0.0%
- Est. flood insurance / yr
- $507 – $1,088
Fire risk 4/10 · Minor
- Est. fire insurance / yr
- $783 – $1,453
Heat risk 6/10 · Moderate
- Hot days now (above 104°F)
- 7 days/yr
- Hot days in 30 yrs
- 17 days/yr
Wind risk 2/10 · Minimal
- Chance of severe wind over 30 yrs
- 1.0%
Air-quality risk 4/10 · Minor
- Unhealthy air days now
- 4 days/yr
- Unhealthy air days in 30 yrs
- 4 days/yr
Risk factors via First Street. Map © Google.
Why this score? — see what drove the D grade
The composite is a weighted blend of 9 inputs, each scored 0–100. Each bar is that input's sub-score; the figure is the points it added to the 100-point composite (weight × sub-score).
- ARV discount +12.2/15.0
- Cash flow +10.3/30.0
- Schools +4.5/10.0
- Livability +3.9/5.0
- DSCR +2.9/10.0
- Rent growth +2.9/5.0
- Condition / age +2.5/5.0
- 1% rule +2.0/10.0
- Appreciation +0.0/10.0
$225,000
🖨 Deal sheet 📄 Offer letter ✓ Due diligence
Listing remarks
Located at 118 Wren Ln in Inman, this 3 bedroom, 2 full bath home sits on a spacious 0.493-acre lot with NO HOA, giving you the freedom and space that’s hard to find—while still being conveniently located near Asheville Hwy, major highways, shopping, dining, and just 15–20 minutes to downtown Spartanburg. Inside, you’ll find a well-built layout featuring a large eat-in kitchen with and plenty of cabinets, plus appliances. The living room offers great space with gas log fireplace, creating a strong foundation to make it your own. Including it's very own 2 Car garage for all of your parking and storage needs. Situated in highly desirable District 2 schools, this proper
Key facts
- Large eat-in kitchen
- Spacious lot
- Gas log fireplace
Tags
Property features AI
Exterior
- Parking: Attached garage; 2-car garage
- Security: Smoke detectors
- Utilities: Public water; Public sewer
- Home design: Single-family residence; One story
- Construction: Brick veneer construction; Composition roof
- Exterior features: Deck; Level lot; See remarks for additional lot details
Interior
- Kitchen: Electric cooktop; Electric oven; Dishwasher; Refrigerator
- Flooring: Hardwood; Vinyl
- Bathrooms: 2 full bathrooms
- Heating & cooling: Ceiling fan(s) for cooling
- Interior features: Ceiling fans; Insulated windows; Fireplace
- Laundry & utility: Main-level laundry; Gas dryer hookup
Neighborhood map
What this means for you Summary
Snapshot
- This is a 2-bed/2.0-bath single-family listed at $225k.
Deal economics
- At list price, monthly cash flow is $-124 ($-1k/yr) — negative.
- To cash-flow at today's rent, offer at most $203k (9.7% below list).
- To meet the 1% rule (rent ≥ 1% of price), the offer needs to be $157k (30.2% below list).
- Recommended offer: $157k (30.2% below list) — sets the bar for 1% rule.
- Cap rate 5.6% vs local median 3.7% in Boiling Springs — top-decile yield for the area; either an underpriced asset or a hidden risk that comps aren't pricing in. Stress-test before assuming the spread holds.
Location & tenants
- Location reads 78/100 on livability (#17 in SC, #2,429 nationally) — a middle-class / working-renter tenant base. Strengths: cost of living A+, housing A+, health & safety A+; Watch: commute F.
- Spartanburg 02 (suburban): math 49% / reading 56% proficiency, ranked #6 of 80 in SC (top 8%) — acceptable for families but not a draw, mixed tenant base, ~2y average lease.
- Zoned schools: Sugar Ridge Elementary (813 students, 60% FRL); Boiling Springs Middle (math 39% / reading 50%, grade D, #52 of 229 statewide, top 23%, 1,068 students, 70% FRL); Boiling Springs High (math 62% / reading 88%, grade A-, #37 of 196 statewide, top 18%, 2,671 students, 60% FRL) — zoned schools average 63% FRL vs 44% district-wide (19 pts higher); higher-poverty schools than district average — tighter screening recommended.
- Market conditions: Rents rising (+1.8%/yr); 693 active listings in the ZIP; 1 comparable units currently listed for rent nearby; solid renter incomes; 3,129 units permitted in Spartanburg County in 2024 (40 in 5+ unit buildings).
Forward outlook
- Local home prices are declining (-3.0%/yr); year-one equity from $2k of loan paydown is wiped out by about $7k of value loss. Plan a longer hold.
- Spartanburg County population projected at +18% by 2050 — long-run rental-demand tailwind backs the buy-and-hold thesis.
Negotiation context
- It's been on market 66 days — a 6% lower offer ($212k) is reasonable based on typical stale-listing flexibility.
- 2 sale attempts since 24y ago with the ask held roughly flat each time — persistent listings suggest the price (not the market) is what's stuck; bring a comps-based counter.
- Current owner paid $103k; list at $225k implies a 119% gain — meaningful room to come down on a strong offer.
Risks & watch-outs
- Climate carrying-cost: extreme-heat days projected 7→17/yr by 2055 (HVAC capex compounding) — expect insurance premiums to compound above CPI over the hold.
Questions for the listing agent
- What do current leases actually rent for vs. the listed asking? Can we see a recent rent roll and the last 12 months of T-12 income?
- It's been on market 66 days. Have you received any prior offers? Is the seller open to a 30% concession, seller financing, or rate buy-down credit?
- Built in 1973 — when were the roof, HVAC, electrical panel, plumbing, and water heater last replaced?
- Why hasn't it sold? Are there any deal-killer items the seller is aware of (foundation, flood, title, zoning, code violations)?
- Is there a deadline driving the sale (1031 exchange, divorce, estate, relocation)? That informs how much negotiation room exists.
- Schools are B-rated — typically a magnet for longer-tenancy family renters. What's the average tenant stay here, and is there a school-zone premium baked into asking?
- The area grade is low — what's the realistic commute time and amenity access for the typical tenant pool here? Any planned neighborhood developments (good or bad) we should know about?
- What's the average days-on-market for RENTAL listings here right now (not sales)? A rising rental-DOM trend means longer vacancies and softer asking-rent achievability than the comps imply.
- What's the recent tenant-quality profile in this submarket — average credit score on applications, eviction rate, late-payment / NSF rate, and stable-employment percentage? A property-management company in the area should have these aggregated.
- How much new for-sale + rental construction is in the pipeline within 1–3 miles? Heavy new supply typically softens prices + rents 12–24 months out; constrained supply supports both.
Investment metrics
- 1% rule
- 0.70% ✗
- Cap rate
- 5.63%
- Cash-on-cash
- -2.37%
- DSCR
- 0.89
- GRM
- 11.9
CMA / ARV
- ARV (on-the-fly)
- $251,524
- Comps found
- 12
Show comp detail 12 sales within ~0.75 mi
| Address | Dist | Beds/Ba | Sqft | Sold | Price | $/sf | Match |
|---|---|---|---|---|---|---|---|
| 116 Hickory Hill Dr Dr | 0.23mi | 3/2.0 (+1) | 1,268 (-8%) | 1mo | $250,000 | $197 | 70 |
| 12142 Lansbury Dr Unit Homesite 36 | 0.52mi | 3/2.5 (+1) | 1,369 (-1%) | 0mo | $249,000 | $182 | 67 |
| 2030 Wexley Dr | 0.53mi | 3/2.0 (+1) | 1,380 (-0%) | 5mo | $251,000 | $182 | 66 |
| 12123 Lansbury Dr Unit Homesite 69 | 0.56mi | 3/2.5 (+1) | 1,369 (-1%) | 0mo | $248,000 | $181 | 65 |
| 12130 Lansbury Dr Unit Homesite 33 | 0.52mi | 3/2.5 (+1) | 1,369 (-1%) | 4mo | $239,000 | $175 | 64 |
| 118 Cypress Dr | 0.09mi | 3/2.0 (+1) | 1,571 (+14%) | 6mo | $270,000 | $172 | 64 |
| 12111 Lansbury Dr | 0.56mi | 3/2.5 (+1) | 1,369 (-1%) | 5mo | $251,000 | $183 | 61 |
| 12111 Lansbury Dr Unit Homesite 72 | 0.56mi | 3/2.5 (+1) | 1,369 (-1%) | 5mo | $251,000 | $183 | 61 |
| 3012 Hillgate Trl | 0.70mi | 3/2.0 (+1) | 1,296 (-6%) | 2mo | $252,544 | $195 | 50 |
| 12146 Lansbury Dr Unit Homesite 37 | 0.52mi | 3/2.0 (+1) | 1,548 (+12%) | 3mo | $257,000 | $166 | 48 |
| 12146 Lansbury Dr Lot 37 | 0.52mi | 3/2.0 (+1) | 1,548 (+12%) | 3mo | $257,000 | $166 | 48 |
| 310 Old Furnace Rd | 0.69mi | 3/2.0 (+1) | 1,196 (-14%) | 1mo | $179,000 | $150 | 40 |
Match score weights: distance 35% · size 25% · config 20% · recency 20%. Top-matched comps best support the ARV.
Projected returns pro-forma
-3.0% appreciation · 1.79% rent growth · sell at horizon
- IRR
- -21.5%
- Equity multiple
- 0.26×
- Total profit
- $-46,351
- Equity at exit
- $33,548
- IRR
- -17.9%
- Equity multiple
- 0.07×
- Total profit
- $-58,489
- Equity at exit
- $19,454
Cash invested: $63,000 (down + closing). Projections, not guarantees.
Landlord ↔ Tenant lean methodology
- Overall (STATE)
- 90 Strongly Landlord-Friendly
- State South Carolina
- 90 Strongly Landlord-Friendly · R+6
- County
- — inherits STATE
- City
- — inherits STATE
ZIP-level market 29349
- Home prices YoY
- -31.8%
- Rents YoY
- 1.8%
- Active inventory
- 693
- Price-to-rent
- 11.9×
Monthly cashflow live
- Estimated rent
- $1,571 medium interval (Pro) →
- Mortgage (P&I)
- −$1,180
- Tax from tax record
- −$91 /mo · $1,096/yr
- Insurance
- −$94
- HOA
- −$0
- Vacancy / Maint / Mgmt
- −$330
- Net cashflow
- $-124
Break-even live
UW: 25.0% down · 7.5% · 30yr · 1.5% tax · 5.0% vac · 8.0% maint · 8.0% mgmt
Financing live
Cash to close
- Down payment
- $56,250
- Closing costs
- $6,750
- Reserves months
- —
- Total cash needed
- —
Loan-product check · same deal, 3 products live
Conventional
25% down · 7.5% · 30yr
- Down + closing
- —
- Monthly P&I
- —
- Monthly cashflow
- —
- DSCR
- —
- Eligible?
- —
Personal DTI + credit; lowest rate.
DSCR
20% down · 8.5% · 30yr
- Down + closing
- —
- Monthly P&I
- —
- Monthly cashflow
- —
- DSCR
- —
- Eligible?
- —
No personal income docs; deal must DSCR.
Hard money
10% down · 12.0% · 12mo
- Down + closing
- —
- Monthly P&I
- —
- Monthly cashflow
- —
- DSCR
- —
- Eligible?
- —
Short-term bridge; refi at stabilization.
Rent comps 1 comps
| Address | Beds | Baths | Sqft | Rent | $/sqft | DOM | Units | Dist |
|---|---|---|---|---|---|---|---|---|
| 1202 Chelsey Ln Unit 1430 Inman, SC | 3.0 | 2.5 | 1366 | $1,650 | $1.21 | 20d | 1 | 0.24mi |
Listing history 20 events
-
2026-06-18days on market $225,000 Active 66 DOM
-
2026-06-17days on market $225,000 Active 65 DOM
-
2026-06-16days on market $225,000 Active 64 DOM
-
2026-06-15days on market $225,000 Active 63 DOM
-
2026-06-14days on market $225,000 Active 61 DOM
-
2026-06-13days on market $225,000 Active 60 DOM
-
2026-06-10days on market $225,000 Active 58 DOM
-
2026-06-09days on market $225,000 Active 57 DOM
-
2026-06-08days on market $225,000 Active 56 DOM
-
2026-06-07days on market $225,000 Active 55 DOM
-
2026-06-05days on market $225,000 Active 52 DOM
-
2026-06-02days on market $225,000 Active 50 DOM
-
2026-06-01days on market $225,000 Active 49 DOM
-
2026-05-31days on market $225,000 Active 48 DOM
-
2026-05-30days on market $225,000 Active 47 DOM
-
2026-04-13$225,000 Active
-
2004-11-15soldstatus $102,900
-
2003-02-14soldstatus $81,621
-
2002-12-17$94,900
-
1991-05-01soldstatus $67,000
ⓘ Source: listings_history table (triggers on properties + properties_extension) + one-shot
backfill from property_details.listing_events for pre-trigger history.
Tax reassessment forecast SC · Resets to sale price
- Current annual tax
- $1,096 · $91/mo
- Projected year-2 tax
- $1,282 · $107/mo
- Expected delta
- +$187/yr (+$16/mo · 17.0%)
ⓘ Screening estimate from a state-policy table — verify with the county assessor before closing.
Climate risk First Street
- Flood 1/10 Low FEMA zone X (unshaded) · 0% chance over 30 yrs
- Wildfire 4/10 Moderate
- Heat 6/10 Major 7 d/yr ≥104°F today · 17 d/yr by 30 yrs out
- Wind 2/10 Low 100% chance of damaging wind over 30 yrs
- Air quality 4/10 Moderate 4 unhealthy d/yr today · 4 by 30 yrs out
Nearby sold comps map
Loading sold comps map…
Walkable amenities ~0.75 mi
Loading nearby amenities…
Taxation est. · year 1
- Rental income
- $18,848
- − Mortgage interest
- −$12,603
- − Property taxes
- −$1,096
- − Insurance
- −$1,125
- − Repairs & maintenance
- −$1,508
- − Management
- −$1,508
- − Depreciation
- −$6,545
- Taxable loss
- −$5,537
- Est. tax savings @ 24.0%
- +$1,329
- After-tax cash flow
- $-161/yr
For passive investors: Depreciation is non-cash, so a rental often shows a tax loss while cash-flowing — sheltering income. Rental losses are passive: they offset passive income freely, and up to $25,000/yr can offset ordinary (W-2) income if you actively participate and your MAGI is under $100k (phasing out to $0 by $150k); unused losses carry forward. On sale, claimed depreciation is recaptured at up to 25%, and gains may owe capital-gains tax (a 1031 exchange can defer both). Figures are a year-1 estimate at your 24.0% rate — not tax advice; consult a CPA.
Schools (NCES district)
- District
- Spartanburg 02
- NCES district ID
- 4503510
- Math proficiency
- 49% ▼ -7.00%
- Reading proficiency
- 56% ▲ 2.00%
- Median HH income
- $49,591
- Composite
- 44.79/100
- National rank
- #2742
- State rank
- #6 of 80 in SC
Livability — Boiling Springs
- Score
- 78/100
- State rank
- #17
- US rank
- #2429
Category grades
Schools grade is shown separately in the Schools card above.
Census & demographics
- County
- Spartanburg County · 258,607 people
- City population
- 33,104
- Metro
- Spartanburg, SC
- Population (ZIP)
- 39,083
- Household income
- $76,168
- Rent vs Own
- Severe rent burden
- 271.0
Population outlook (Spartanburg County) Hauer SSP2
- Today (2025)
- 325,495 people
- By 2030
- 338,800 · +4.1%
- By 2040
- 363,471 · +11.7%
- By 2050
- 384,156 · +18.0%
- By 2075
- 430,137 · +32.1%
- By 2100
- 442,733 · +36.0%
Race, ethnicity, and origin ACS 2023
- Neighborhood character
- Predominantly White (80%)
- Race & ethnicity
- White 80% Black 9% Hispanic / Latino 6% Two or more races 4% Asian 2%
- Hispanic origin (detail)
- Mexican 5%
- Common ancestry
- Subsaharan African 6% Serbian 3% Scotch-Irish 3%
- Foreign-born
- 9% · Canada
- Languages at home
- 86% English-only · Russian/Polish/Slavic 7% Spanish 3% Other Asian/Pacific 2%
Political lean MEDSL · Spartanburg
- 2024 margin
- Solid R (+33.6) · D 32.6% · R 66.2% · Other 1.2%
- 2008→2024 swing
- -12.0pp toward R · 2008: -21.6pp · 2024: -33.6pp
- All cycles
- 2024: R+33.6 2020: R+27.3 2016: R+30.0 2012: R+23.1 2008: R+21.6
Not yet ingested
- Civics
- —
Market trends
- HPI YoY
- ▼ -113.67%
- Current HPI
- 244.0359
- Rent YoY
- ▲ 1.79%
- Metro
- Spartanburg, SC
- State GDP YoY
- ▲ 4.51%
- F500 in state
- 2
Industry mix (Fortune 500 HQ in SC)
| Industry | F500 HQs | Revenue |
|---|---|---|
| Packaging | 1 | $7B |
|
||
Price history
+235.8% since first listed5 events — show timeline
- 2026-04-13 Listed $225,000 SPMLS
- 2004-11-15 Sold (Public Records) $102,900 Public Records
- 2003-02-14 Sold (MLS) $81,621 SPMLS
- 2002-12-17 Listed $94,900 SPMLS
- 1991-05-01 Sold (Public Records) $67,000 Public Records
Property tax history
+2.8%/yrLatest (2025): $1,096 · +0.9% YoY. Source: county tax records.
Cash-flow waterfall
monthlySold comps — $/sqft
last 12 mo · ≤1 miLoading sold comps…