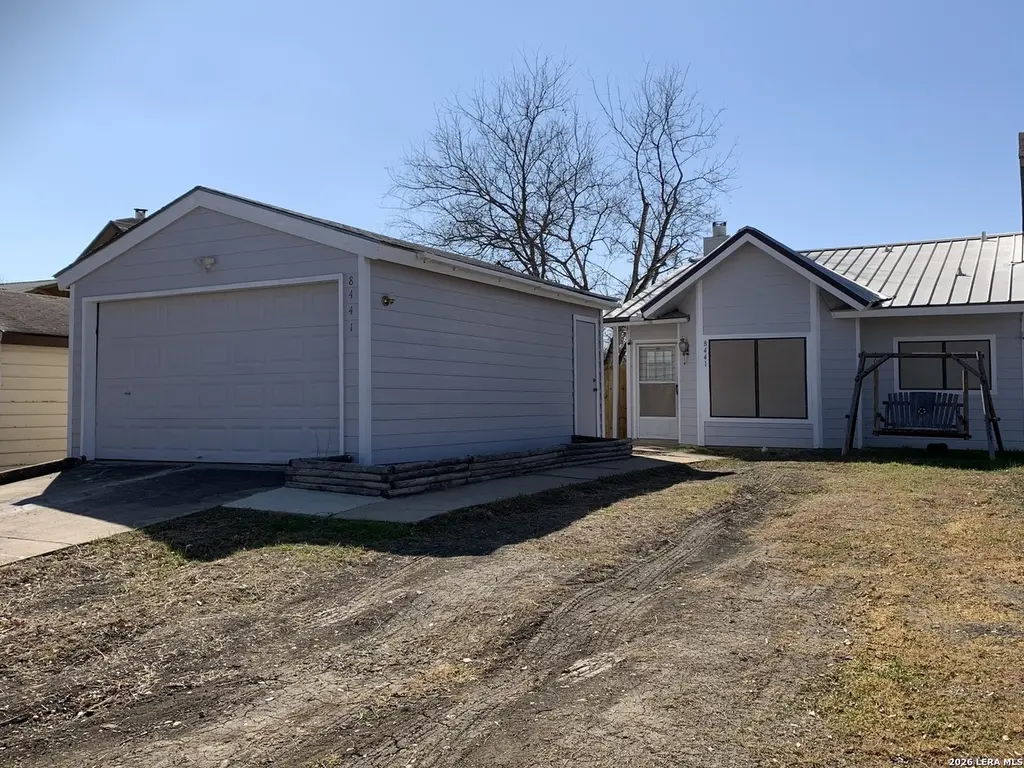
8441 Forest Ridge Dr · San Antonio, TX
Flood risk 1/10 · Minimal
- FEMA flood zone
- X (unshaded)
- Chance of flooding over 30 yrs
- 0.0%
- Est. flood insurance / yr
- $507 – $1,088
Fire risk 2/10 · Minimal
- Est. fire insurance / yr
- $1,222 – $2,270
Heat risk 8/10 · Major
- Hot days now (above 108°F)
- 7 days/yr
- Hot days in 30 yrs
- 23 days/yr
Wind risk 8/10 · Major
- Chance of severe wind over 30 yrs
- 80.0%
Air-quality risk 1/10 · Minimal
- Unhealthy air days now
- 0 days/yr
- Unhealthy air days in 30 yrs
- 0 days/yr
Risk factors via First Street. Map © Google.
Why this score? — see what drove the C- grade
The composite is a weighted blend of 9 inputs, each scored 0–100. Each bar is that input's sub-score; the figure is the points it added to the 100-point composite (weight × sub-score).
- Cash flow +16.5/30.0
- ARV discount +13.2/15.0
- DSCR +5.1/10.0
- 1% rule +4.9/10.0
- Livability +4.0/5.0
- Condition / age +2.5/5.0
- Schools +2.4/10.0
- Rent growth +2.2/5.0
- Appreciation +0.0/10.0
$124,900
🖨 Deal sheet 📄 Offer letter ✓ Due diligence
Listing remarks
This one-story townhouse features dramatic vaulted ceilings in the living room, two bedrooms, a full bath, a nicely sized kitchen, and an adjacent dining area. Outside, the home offers a private, fully fenced backyard and a detached one-car garage. The property is currently leased through the end of May 2026.
Key facts
- Vaulted ceilings
- Garage
- Built 1984
Tags
Property features AI
Finance
- Financial info: Currently being leased (lease expires May 31, 2026); For sale
- HOA & community: Located in the CROWNWOOD subdivision
Exterior
- Parking: 1-car garage
- Utilities: City water and sewer
- Home design: Pre-owned property; Approximately 42 years old
- Construction: Metal roof; Slab foundation
- Exterior features: Siding exterior
Interior
- Kitchen: Microwave; Refrigerator; Island kitchen; Eat-in kitchen
- Bedrooms: Master bedroom on lower level with ceiling fan; Second bedroom
- Flooring: Ceramic tile; Vinyl flooring
- Bathrooms: 1 full bathroom
- Heating & cooling: Central heating (electric); Central air conditioning
- Interior features: Ceiling fans; Smoke alarm; Open floor plan; Living/dining room combination; Eat-in kitchen with island; Ground level / no steps; Cable TV available; High-speed internet; All window coverings remain
- Laundry & utility: Washer connection; Dryer connection; Laundry on main level
Neighborhood map
What this means for you Summary
Snapshot
- This is a 2-bed/1.0-bath townhouse listed at $125k.
Deal economics
- At list price, monthly cash flow is $74 ($884/yr) — positive.
- The deal already cash-flows at list — no discount required.
- To meet the 1% rule (rent ≥ 1% of price), the offer needs to be $123k (1.5% below list).
- Recommended offer: $121k (3.0% below list) — sets the bar for market timing.
- Cap rate 7.0% vs local median 3.8% in San Antonio — top-decile yield for the area; either an underpriced asset or a hidden risk that comps aren't pricing in. Stress-test before assuming the spread holds.
Location & tenants
- Location reads 80/100 on livability (#31 in TX, #1,616 nationally) — a professional / high-income tenant draw. Strengths: amenities A+, commute A+, cost of living A+; Watch: crime F.
- Judson ISD (suburban): math 21% / reading 33% proficiency, ranked #660 of 826 in TX (top 80%) — low school quality limits family demand, transient renter base, plan for 1-2y turnover.
- Zoned schools: Miller Point El (math 26% / reading 41%, grade F, #2,174 of 4,322 statewide, top 51%, 606 students, 79% FRL); Judson H S (math 19% / reading 38%, grade F, #1,157 of 1,632 statewide, top 72%, 2,666 students, 62% FRL).
- Market conditions: Rents soft (-1.1%/yr); 202 active listings in the ZIP; 38 comparable units currently listed for rent nearby; rentals leasing fast (median 13d on market — plan ~1-2 weeks tenant-placement turnaround); 8,308 units permitted in Bexar County in 2024 (2,506 in 5+ unit buildings).
Forward outlook
- Local home prices are declining (-3.0%/yr); year-one equity from $864 of loan paydown is wiped out by about $4k of value loss. Plan a longer hold.
- Bexar County population projected at +50% by 2050 — long-run rental-demand tailwind backs the buy-and-hold thesis.
Negotiation context
- It's been on market 42 days — a 3% lower offer ($121k) is reasonable based on typical stale-listing flexibility.
- 3 sale attempts since 19y ago with the ask held roughly flat each time — persistent listings suggest the price (not the market) is what's stuck; bring a comps-based counter.
Risks & watch-outs
- Climate carrying-cost: severe wind risk, 80% chance of damaging wind over 30y; extreme-heat days projected 7→23/yr by 2055 (HVAC capex compounding) — expect insurance premiums to compound above CPI over the hold.
Questions for the listing agent
- It's been on market 42 days. Have you received any prior offers? Is the seller open to a 3% concession, seller financing, or rate buy-down credit?
- Is there a deadline driving the sale (1031 exchange, divorce, estate, relocation)? That informs how much negotiation room exists.
- Crime grade is F in this area — have there been break-ins, vandalism, or insurance claims at this property in the last 3 years? What carrier currently insures it and at what premium?
- What's the average days-on-market for RENTAL listings here right now (not sales)? A rising rental-DOM trend means longer vacancies and softer asking-rent achievability than the comps imply.
- What's the recent tenant-quality profile in this submarket — average credit score on applications, eviction rate, late-payment / NSF rate, and stable-employment percentage? A property-management company in the area should have these aggregated.
- How much new for-sale + rental construction is in the pipeline within 1–3 miles? Heavy new supply typically softens prices + rents 12–24 months out; constrained supply supports both.
Investment metrics
- 1% rule
- 0.99% ✗
- Cap rate
- 7.00%
- Cash-on-cash
- 2.53%
- DSCR
- 1.11
- GRM
- 8.5
CMA / ARV
- ARV (median comp)
- $143,093
- List price
- $124,900
- Delta
- -12.71%
- Verdict
- UNDERPRICED
- Comps
- 5 within 1.0 mi
Show comp detail 1 sale within ~0.75 mi
| Address | Dist | Beds/Ba | Sqft | Sold | Price | $/sf | Match |
|---|---|---|---|---|---|---|---|
| 7918 Falcon Rdg | 0.08mi | 2/1.0 | 800 (-6%) | 6mo | $149,000 | $186 | 81 |
Match score weights: distance 35% · size 25% · config 20% · recency 20%. Top-matched comps best support the ARV.
Projected returns pro-forma
-3.0% appreciation · 0.0% rent growth · sell at horizon
- IRR
- -15.8%
- Equity multiple
- 0.45×
- Total profit
- $-19,115
- Equity at exit
- $18,623
- IRR
- -14.1%
- Equity multiple
- 0.30×
- Total profit
- $-24,379
- Equity at exit
- $10,799
Cash invested: $34,972 (down + closing). Projections, not guarantees.
Landlord ↔ Tenant lean methodology
- Overall (STATE)
- 87 Strongly Landlord-Friendly
- State Texas
- 87 Strongly Landlord-Friendly · R+5
- County
- — inherits STATE
- City
- — inherits STATE
ZIP-level market 78239
- Home prices YoY
- -5.9%
- Rents YoY
- -1.1%
- Active inventory
- 202
- Price-to-rent
- 8.5×
Monthly cashflow live
- Estimated rent
- $1,231 high interval (Pro) →
- Mortgage (P&I)
- −$655
- Tax from tax record
- −$192 /mo · $2,299/yr
- Insurance
- −$52
- HOA
- −$0
- Vacancy / Maint / Mgmt
- −$258
- Net cashflow
- $74
Break-even live
UW: 25.0% down · 7.5% · 30yr · 1.5% tax · 5.0% vac · 8.0% maint · 8.0% mgmt
Financing live
Cash to close
- Down payment
- $31,225
- Closing costs
- $3,747
- Reserves months
- —
- Total cash needed
- —
Loan-product check · same deal, 3 products live
Conventional
25% down · 7.5% · 30yr
- Down + closing
- —
- Monthly P&I
- —
- Monthly cashflow
- —
- DSCR
- —
- Eligible?
- —
Personal DTI + credit; lowest rate.
DSCR
20% down · 8.5% · 30yr
- Down + closing
- —
- Monthly P&I
- —
- Monthly cashflow
- —
- DSCR
- —
- Eligible?
- —
No personal income docs; deal must DSCR.
Hard money
10% down · 12.0% · 12mo
- Down + closing
- —
- Monthly P&I
- —
- Monthly cashflow
- —
- DSCR
- —
- Eligible?
- —
Short-term bridge; refi at stabilization.
Rent comps 38 comps
| Address | Beds | Baths | Sqft | Rent | $/sqft | DOM | Units | Dist |
|---|---|---|---|---|---|---|---|---|
| 8439 Forest Ridge Dr San Antonio, TX | 2.0 | 1.0 | 945 | $1,095 | $1.16 | 44d | 1 | 0.03mi |
| 8448 Dixon Ridge Dr San Antonio, TX | 2.0 | 1.0 | 800 | $1,150 | $1.44 | 4d | 1 | 0.09mi |
| 8416 Dixon Ridge Dr San Antonio, TX | 3.0 | 2.0 | 1104 | $1,225 | $1.11 | 3d | 1 | 0.14mi |
| 8406 Forest Ridge Dr San Antonio, TX | 3.0 | 2.0 | 1121 | $1,500 | $1.34 | 43d | 1 | 0.15mi |
| 531 Erna Dr Converse, TX | 3.0 | 2.0 | 1002 | $1,350 | $1.35 | 11d | 1 | 0.57mi |
| 509 Meadow Frg Unit A Converse, TX | 3.0 | 1.5 | 950 | $925 | $0.97 | 14d | 1 | 0.84mi |
| 509 Meadow Frg Unit B Converse, TX | 3.0 | 1.0 | 950 | $925 | $0.97 | 14d | 1 | 0.84mi |
| 7467 Kitty Hawk Rd Converse, TX | 1.0 | 1.0 | 735 | $1,020 | $1.39 | 43d | 1 | 0.89mi |
| 7115 Glen Ter Apt 3 San Antonio, TX | 2.0 | 1.0 | 625 | $825 | $1.32 | 12d | 1 | 0.91mi |
| 7115 Glen Ter Apt 3 San Antonio, TX | 2.0 | 1.0 | 625 | $825 | $1.32 | 43d | 1 | 0.91mi |
| 7115 Glen Ter Unit 4 San Antonio, TX | 1.0 | 1.0 | 576 | $700 | $1.22 | 4d | 1 | 0.91mi |
| 7347 Kitty Hawk Rd Converse, TX | 1.0–4.0 | 1.0–2.0 | 990 | $1,323 | $1.34 | 4d | 1 | 0.97mi |
| 7461 Kitty Hawk Rd Converse, TX | 1.0–3.0 | 1.0–2.0 | 873 | $1,342 | $1.54 | 1d | 27 | 0.98mi |
| 517 Oak Dr Converse, TX | 3.0 | 1.5 | 894 | $1,500 | $1.68 | 24d | 1 | 1.06mi |
| 115 N Meadow St Converse, TX | 3.0 | 2.0 | 1048 | $1,650 | $1.57 | 43d | 1 | 1.11mi |
| 320 Station St Unit 101 Converse, TX | 2.0 | 2.0 | 877 | $825 | $0.94 | 12d | 1 | 1.12mi |
| 7006 Glen Grv San Antonio, TX | 3.0 | 2.0 | 1036 | $1,495 | $1.44 | 43d | 1 | 1.19mi |
| 8355 Crestway Dr Unit 610 Converse, TX | 1.0 | 1.0 | 556 | $747 | $1.34 | 3d | 1 | 1.19mi |
| 8355 Crestway Dr Unit 710 Converse, TX | 2.0 | 2.0 | 865 | $947 | $1.09 | 3d | 1 | 1.19mi |
| 7614 Glen Hurst San Antonio, TX | 3.0 | 1.0 | 1100 | $1,400 | $1.27 | 2d | 1 | 1.20mi |
| 7643 Glen Shire San Antonio, TX | 3.0 | 2.0 | 868 | $1,475 | $1.70 | 24d | 1 | 1.21mi |
| 7923 Langport San Antonio, TX | 3.0 | 2.0 | 1095 | $1,800 | $1.64 | 43d | 1 | 1.25mi |
| 202 Ash Dr Unit 103 Converse, TX | 2.0 | 2.0 | 900 | $995 | $1.11 | 24d | 1 | 1.28mi |
| 7855 Kitty Hawk Rd Converse, TX | 1.0–2.0 | 1.0–2.0 | 875 | $1,425 | $1.63 | 20d | 17 | 1.30mi |
| 7855 Kitty Hawk Rd Unit 610 Converse, TX | 1.0 | 1.0 | 702 | $1,067 | $1.52 | 2d | 1 | 1.31mi |
| 7855 Kitty Hawk Rd Unit 710 Converse, TX | 2.0 | 2.0 | 948 | $1,177 | $1.24 | 2d | 1 | 1.31mi |
| 7603 Glen Vis San Antonio, TX | 3.0 | 2.0 | 980 | $1,200 | $1.22 | 7d | 1 | 1.31mi |
| 301 Converse Center St Converse, TX | 1.0–3.0 | 1.0–2.0 | 975 | $1,184 | $1.21 | 43d | 1 | 1.32mi |
| 810 Station St Unit 1 Converse, TX | 2.0 | 2.0 | 1088 | $899 | $0.83 | 24d | 1 | 1.33mi |
| 810 Station St Apt 3 Converse, TX | 2.0 | 2.0 | 1088 | $825 | $0.76 | 4d | 1 | 1.33mi |
| 7128 Elm Cv San Antonio, TX | 2.0 | 2.0 | 661 | $1,097 | $1.66 | 4d | 1 | 1.33mi |
| 812 Station St Converse, TX | 2.0 | 1.0 | 1100 | $975 | $0.89 | 24d | 1 | 1.34mi |
| 7037 Elm Cv San Antonio, TX | 2.0 | 2.0 | 661 | $1,203 | $1.82 | 4d | 1 | 1.35mi |
| 9205 Farm to Market Road 78 Unit 610 Converse, TX | 1.0 | 1.0 | 597 | $941 | $1.58 | 3d | 1 | 1.35mi |
| 9205 Farm to Market Road 78 Unit 710 Converse, TX | 2.0 | 2.0 | 896 | $1,051 | $1.17 | 3d | 1 | 1.35mi |
| 7125 Elm Cv San Antonio, TX | 2.0 | 2.0 | 664 | $1,150 | $1.73 | 11d | 1 | 1.36mi |
| 7861 Kitty Hawk Rd Unit 6102 Universal City, TX | 1.0 | 1.0 | 748 | $1,069 | $1.43 | 43d | 1 | 1.45mi |
| 7812 Broadwick San Antonio, TX | 2.0 | 1.0 | 884 | $1,075 | $1.22 | 17d | 1 | 1.47mi |
Listing history 24 events
-
2026-06-18days on market $124,900 Active 42 DOM
-
2026-06-17days on market $124,900 Active 41 DOM
-
2026-06-16days on market $124,900 Active 40 DOM
-
2026-06-15days on market $124,900 Active 39 DOM
-
2026-06-13days on market $124,900 Active 37 DOM
-
2026-06-09days on market $124,900 Active 33 DOM
-
2026-06-08days on market $124,900 Active 32 DOM
-
2026-06-07days on market $124,900 Active 31 DOM
-
2026-06-04days on market $124,900 Active 28 DOM
-
2026-06-03days on market $124,900 Active 27 DOM
-
2026-06-02days on market $124,900 Active 26 DOM
-
2026-06-01days on market $124,900 Active 25 DOM
-
2026-05-31days on market $124,900 Active 24 DOM
-
2026-05-07$124,900 New 310-char remark
-
2023-02-02soldstatus
-
2022-09-30soldstatus
-
2020-04-27soldstatus
-
2020-04-15historical
-
2020-03-17price $87,500
-
2020-02-29price $89,500
-
2020-01-29$89,999 New
-
2008-02-29historical
-
2007-08-29$49,900
-
1991-09-01soldstatus
ⓘ Source: listings_history table (triggers on properties + properties_extension) + one-shot
backfill from property_details.listing_events for pre-trigger history.
Tax reassessment forecast TX · Resets to sale price
- Current annual tax
- $2,299 · $192/mo
- Projected year-2 tax
- $2,299 · $192/mo
- Expected delta
- $0/yr ($0/mo · 0.0%)
ⓘ Screening estimate from a state-policy table — verify with the county assessor before closing.
Climate risk First Street
- Flood 1/10 Low FEMA zone X (unshaded) · 0% chance over 30 yrs
- Wildfire 2/10 Low
- Heat 8/10 Severe 7 d/yr ≥108°F today · 23 d/yr by 30 yrs out
- Wind 8/10 Severe 80% chance of damaging wind over 30 yrs
- Air quality 1/10 Low 0 unhealthy d/yr today · 0 by 30 yrs out
Nearby sold comps map
Loading sold comps map…
Walkable amenities ~0.75 mi
Loading nearby amenities…
Taxation est. · year 1
- Rental income
- $14,768
- − Mortgage interest
- −$6,996
- − Property taxes
- −$2,299
- − Insurance
- −$624
- − Repairs & maintenance
- −$1,181
- − Management
- −$1,181
- − Depreciation
- −$3,633
- Taxable loss
- −$1,148
- Est. tax savings @ 24.0%
- +$275
- After-tax cash flow
- $1,159/yr
For passive investors: Depreciation is non-cash, so a rental often shows a tax loss while cash-flowing — sheltering income. Rental losses are passive: they offset passive income freely, and up to $25,000/yr can offset ordinary (W-2) income if you actively participate and your MAGI is under $100k (phasing out to $0 by $150k); unused losses carry forward. On sale, claimed depreciation is recaptured at up to 25%, and gains may owe capital-gains tax (a 1031 exchange can defer both). Figures are a year-1 estimate at your 24.0% rate — not tax advice; consult a CPA.
Schools (NCES district)
- District
- Judson ISD
- NCES district ID
- 4824990
- Math proficiency
- 21% ▼ -21.00%
- Reading proficiency
- 33% ▼ -7.00%
- Median HH income
- $57,542
- Composite
- 24.39/100
- National rank
- #7689
- State rank
- #660 of 826 in TX
Livability — San Antonio
- Score
- 80/100
- State rank
- #31
- US rank
- #1616
Category grades
Schools grade is shown separately in the Schools card above.
Census & demographics
- County
- Bexar County · 1,990,555 people
- City population
- 1,806,925
- Metro
- San Antonio-New Braunfels, TX
- Population (ZIP)
- 28,609
- Household income
- $70,098
- Rent vs Own
- Severe rent burden
- 488.0
Population outlook (Bexar County) Hauer SSP2
- Today (2025)
- 2,336,851 people
- By 2030
- 2,560,728 · +9.6%
- By 2040
- 3,020,569 · +29.3%
- By 2050
- 3,493,522 · +49.5%
- By 2075
- 4,668,459 · +99.8%
- By 2100
- 5,533,242 · +136.8%
Race, ethnicity, and origin ACS 2023
- Neighborhood character
- Diverse neighborhood (Simpson 0.66)
- Race & ethnicity
- Hispanic / Latino 47% White 30% Two or more races 20% Black 16% Asian 4% Pacific Islander 2%
- Hispanic origin (detail)
- Mexican 38% Puerto Rican 4%
- Common ancestry
- Lithuanian 2% Romanian 1% Slovak 1%
- Foreign-born
- 13% · Canada, Vietnam, Jamaica
- Languages at home
- 72% English-only · Spanish 24% Vietnamese 1% Chinese 1%
Political lean MEDSL · Bexar
- 2024 margin
- Lean D (+9.8) · D 54.3% · R 44.6% · Other 1.1%
- 2008→2024 swing
- +4.2pp toward D · 2008: 5.6pp · 2024: 9.8pp
- All cycles
- 2024: D+9.8 2020: D+18.2 2016: D+13.5 2012: D+4.6 2008: D+5.6
Not yet ingested
- Civics
- —
Market trends
- HPI YoY
- ▼ -15.13%
- Current HPI
- 242.1272
- Rent YoY
- ▼ -1.05%
- Metro
- San Antonio-New Braunfels, TX
- State GDP YoY
- ▲ 3.95%
- F500 in state
- 110
Industry mix (Fortune 500 HQ in TX)
| Industry | F500 HQs | Revenue |
|---|---|---|
| Energy | 16 | $1,198B |
|
||
| Technology | 5 | $198B |
|
||
| Engineering / Construction | 4 | $72B |
|
||
| Energy Services | 3 | $60B |
|
||
| Utilities | 3 | $41B |
|
||
| Healthcare | 2 | $330B |
|
||
Price history
+150.3% since first listed11 events — show timeline
- 2026-05-07 Listed $124,900 LERA
- 2023-02-02 Sold (Public Records) — Public Records
- 2022-09-30 Sold (Public Records) — Public Records
- 2020-04-27 Sold (Public Records) — Public Records
- 2020-04-15 Listing Removed — LERA
- 2020-03-17 Price Changed $87,500 LERA
- 2020-02-29 Price Changed $89,500 LERA
- 2020-01-29 Listed $89,999 LERA
- 2008-02-29 Listing Removed — LERA
- 2007-08-29 Listed $49,900 LERA
- 1991-09-01 Sold (Public Records) — Public Records
Property tax history
+15.1%/yrLatest (2025): $2,299 · +2.4% YoY. Source: county tax records.
Cash-flow waterfall
monthlySold comps — $/sqft
last 12 mo · ≤1 miLoading sold comps…