 🌊 Lakefront
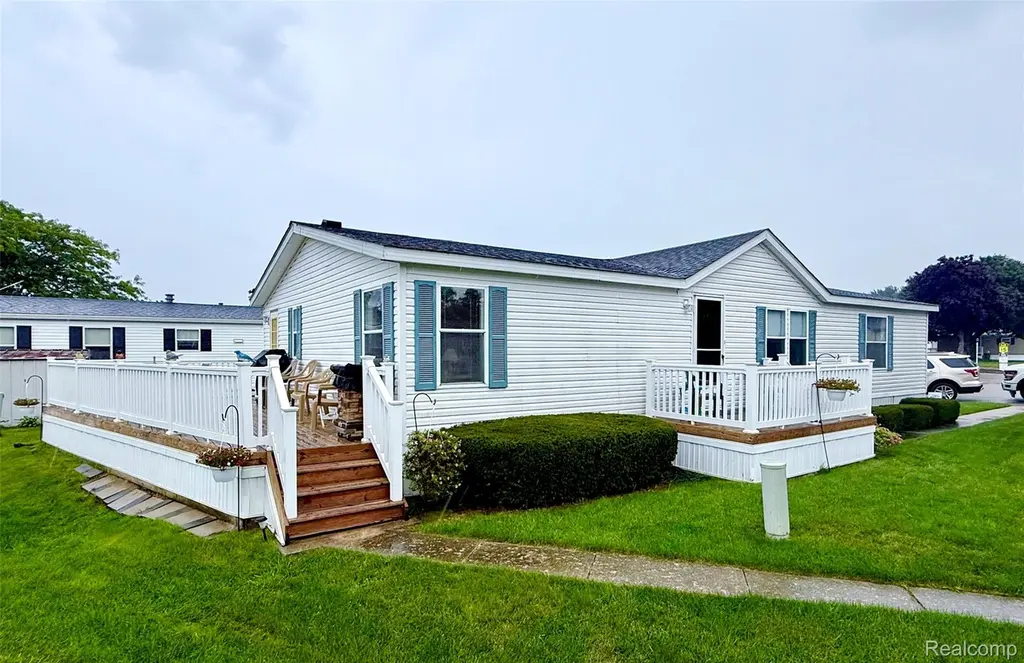
104 Shoreline Dr E · Port Sanilac, MI
Flood risk No data
- FEMA flood zone
- —
- Chance of flooding over 30 yrs
- —
- Est. flood insurance / yr
- —
Fire risk No data
- Est. fire insurance / yr
- —
Heat risk No data
- Hot days now (above threshold)
- —
- Hot days in 30 yrs
- —
Wind risk No data
- Chance of severe wind over 30 yrs
- —
Air-quality risk No data
- Unhealthy air days now
- —
- Unhealthy air days in 30 yrs
- —
Risk factors via First Street. Map © Google.
Why this score? — see what drove the D+ grade
The composite is a weighted blend of 9 inputs, each scored 0–100. Each bar is that input's sub-score; the figure is the points it added to the 100-point composite (weight × sub-score).
- 1% rule +10.0/10.0
- Appreciation +7.9/10.0
- ARV discount +7.5/15.0
- Cash flow +6.8/30.0
- Condition / age +4.0/5.0
- Livability +3.1/5.0
- Schools +3.0/10.0
- Rent growth +2.5/5.0
- DSCR +1.0/10.0
$74,900
🖨 Deal sheet 📄 Offer letter ✓ Due diligence
Listing remarks MLS
JUST STEPS AWAY FROM LAKE HURON! Check out this well kept 3 bedroom 2 bath home located in the beautiful Huron Shores Manufactured Home lake front community. Move right into this open concept home located on a corner lot. The roof was replaced within the last 10 years as well as the hot water tank. The primary bathroom is updated and has a walk in shower. The large back deck is great for entertaining and has views of Lake Huron. Storage shed makes for great storage space. Appliances stay as well many other furnishings. Lakeside living without the carrying cost and maintenance. $573 monthly lot rent includes Water, Sewer, and Garbage.
Key facts
- Large back deck
- Open concept home
- Corner lot
Tags
Neighborhood map
What this means for you Summary
Snapshot
- This is a 3-bed/2.0-bath single-family listed at $75k. Condition is rated good.
Deal economics
- At list price, monthly cash flow is $-118 ($-1k/yr) — negative.
- To cash-flow at today's rent, offer at most $58k (22.8% below list).
- Meets the 1% rule at list price ($1k rent vs $75k).
- Recommended offer: $58k (22.8% below list) — sets the bar for cash-flow.
Location & tenants
- Location reads 61/100 on livability (#576 in MI) — a middle-class / working-renter tenant base. Strengths: cost of living A+, housing A+; Watch: crime D+, schools F, amenities F.
- Carsonville-Port Sanilac School District (rural): math 25% / reading 40% proficiency, ranked #498 of 760 in MI (top 66%) — families likely to look elsewhere, expect single-tenant / working-renter base with shorter leases.
- Market conditions: 23 active listings in the ZIP; 63 units permitted in Sanilac County in 2024 (0 in 5+ unit buildings).
Forward outlook
- In year one you build about $5k of equity ($518 loan paydown + $4k appreciation (5.8% local appreciation)).
- Sanilac County population projected at -31% by 2050 — secular population decline; favor cash flow + early exit over multi-decade hold.
- By year 7, paydown + projected appreciation supports a ~$32k cash-out refi (75% LTV) — recoverable capital for the next deal without selling this one.
Negotiation context
- It's been on market 45 days — a 3% lower offer ($73k) is reasonable based on typical stale-listing flexibility.
- 4 sale attempts with the ask held roughly flat each time — persistent listings suggest the price (not the market) is what's stuck; bring a comps-based counter.
Risks & watch-outs
- Watch-outs: HOA is 47% of rent.
Questions for the listing agent
- What do current leases actually rent for vs. the listed asking? Can we see a recent rent roll and the last 12 months of T-12 income?
- It's been on market 45 days. Have you received any prior offers? Is the seller open to a 23% concession, seller financing, or rate buy-down credit?
- What does the HOA fee cover, when was the last increase, and are there any pending special assessments or reserve-fund shortfalls?
- Is there a deadline driving the sale (1031 exchange, divorce, estate, relocation)? That informs how much negotiation room exists.
- Schools are F-rated, which usually means shorter tenancies and higher turnover. Who's the typical renter profile here, and what's been the actual vacancy rate?
- Crime grade is D in this area — have there been break-ins, vandalism, or insurance claims at this property in the last 3 years? What carrier currently insures it and at what premium?
- The area grade is low — what's the realistic commute time and amenity access for the typical tenant pool here? Any planned neighborhood developments (good or bad) we should know about?
- This sits on a lake — are riparian / water-frontage rights deeded with the parcel? Any dock permits, shoreline easements, or HOA water-use restrictions?
- What's the documented flood / surge / shoreline-erosion history here (FEMA AND non-FEMA — e.g., storm surge, creek backup, septic-field saturation)?
- Any water-quality or seasonal algae-bloom issues that affect tenant satisfaction or short-term-rental demand?
- What's the average days-on-market for RENTAL listings here right now (not sales)? A rising rental-DOM trend means longer vacancies and softer asking-rent achievability than the comps imply.
- What's the recent tenant-quality profile in this submarket — average credit score on applications, eviction rate, late-payment / NSF rate, and stable-employment percentage? A property-management company in the area should have these aggregated.
- How much new for-sale + rental construction is in the pipeline within 1–3 miles? Heavy new supply typically softens prices + rents 12–24 months out; constrained supply supports both.
Investment metrics
- 1% rule
- 1.64% ✓
- Cap rate
- 4.40%
- Cash-on-cash
- -6.76%
- DSCR
- 0.70
- GRM
- 5.1
CMA / ARV
- ARV (median comp)
- $285,501
- List price
- $74,900
- Delta
- -73.77%
- Verdict
- UNDERPRICED
- Comps
- 8 within 1.0 mi
Show comp detail 2 sales within ~0.75 mi
| Address | Dist | Beds/Ba | Sqft | Sold | Price | $/sf | Match |
|---|---|---|---|---|---|---|---|
| 1083 Lakeside Dr | 0.13mi | 3/2.0 | 1,600 (0%) | 10mo | $275,000 | $172 | 85 |
| 6963 Hillside Pl | 0.43mi | 3/1.5 | 1,680 (+5%) | 17mo | $315,000 | $188 | 55 |
Match score weights: distance 35% · size 25% · config 20% · recency 20%. Top-matched comps best support the ARV.
Projected returns pro-forma
5.84% appreciation · 3.0% rent growth · sell at horizon
- IRR
- 9.7%
- Equity multiple
- 1.66×
- Total profit
- $13,744
- Equity at exit
- $46,310
- IRR
- 11.2%
- Equity multiple
- 3.25×
- Total profit
- $47,256
- Equity at exit
- $83,319
Cash invested: $20,972 (down + closing). Projections, not guarantees.
Landlord ↔ Tenant lean methodology
- Overall (STATE)
- 62 Landlord-Friendly
- State Michigan
- 62 Landlord-Friendly · EVEN
- County
- — inherits STATE
- City
- — inherits STATE
ZIP-level market 48469
- Home prices YoY
- 2.6%
- Active inventory
- 23
- Price-to-rent
- 5.1×
Monthly cashflow live
- Estimated rent
- $1,231 medium interval (Pro) →
- Mortgage (P&I)
- −$393
- Tax est. 1.5%
- −$94 /mo · $1,124/yr
- Insurance
- −$31
- HOA
- −$573
- Vacancy / Maint / Mgmt
- −$259
- Net cashflow
- $-118
Break-even live
UW: 25.0% down · 7.5% · 30yr · 1.5% tax · 5.0% vac · 8.0% maint · 8.0% mgmt
Financing live
Cash to close
- Down payment
- $18,725
- Closing costs
- $2,247
- Reserves months
- —
- Total cash needed
- —
Loan-product check · same deal, 3 products live
Conventional
25% down · 7.5% · 30yr
- Down + closing
- —
- Monthly P&I
- —
- Monthly cashflow
- —
- DSCR
- —
- Eligible?
- —
Personal DTI + credit; lowest rate.
DSCR
20% down · 8.5% · 30yr
- Down + closing
- —
- Monthly P&I
- —
- Monthly cashflow
- —
- DSCR
- —
- Eligible?
- —
No personal income docs; deal must DSCR.
Hard money
10% down · 12.0% · 12mo
- Down + closing
- —
- Monthly P&I
- —
- Monthly cashflow
- —
- DSCR
- —
- Eligible?
- —
Short-term bridge; refi at stabilization.
HOA detail
- Monthly dues
- $573 · $6,876/yr
- Likely covers
- watersewertrash
Listing history 15 events
-
2026-06-07statusdays on market $74,900 Pending 45 DOM
-
2026-06-04days on market $74,900 Active 43 DOM
-
2026-06-02days on market $74,900 Active 42 DOM
-
2026-06-01days on market $74,900 Active 41 DOM
-
2026-05-31days on market $74,900 Active 40 DOM
-
2026-05-31days on market $74,900 Active 39 DOM
-
2026-04-21$74,900 Active 641-char remark
Show marketing remark (641 chars)
JUST STEPS AWAY FROM LAKE HURON! Check out this well kept 3 bedroom 2 bath home located in the beautiful Huron Shores Manufactured Home lake front community. Move right into this open concept home located on a corner lot. The roof was replaced within the last 10 years as well as the hot water tank. The primary bathroom is updated and has a walk in shower. The large back deck is great for entertaining and has views of Lake Huron. Storage shed makes for great storage space. Appliances stay as well many other furnishings. Lakeside living without the carrying cost and maintenance. $573 monthly lot rent includes Water, Sewer, and Garbage.
-
2025-10-30historical
-
2025-10-13price $73,900
-
2025-10-13price $73,900
-
2025-09-24price $77,900
-
2025-09-24price $77,900
-
2025-08-28$79,900 Active
-
2025-08-28$79,900 Active
ⓘ Source: listings_history table (triggers on properties + properties_extension) + one-shot
backfill from property_details.listing_events for pre-trigger history.
Nearby sold comps map
Loading sold comps map…
Walkable amenities ~0.75 mi
Loading nearby amenities…
Taxation est. · year 1
- Rental income
- $14,772
- − Mortgage interest
- −$4,196
- − Property taxes
- −$1,124
- − Insurance
- −$374
- − Repairs & maintenance
- −$1,182
- − Management
- −$1,182
- − HOA
- −$6,876
- − Depreciation
- −$2,179
- Taxable loss
- −$2,340
- Est. tax savings @ 24.0%
- +$562
- After-tax cash flow
- $-856/yr
For passive investors: Depreciation is non-cash, so a rental often shows a tax loss while cash-flowing — sheltering income. Rental losses are passive: they offset passive income freely, and up to $25,000/yr can offset ordinary (W-2) income if you actively participate and your MAGI is under $100k (phasing out to $0 by $150k); unused losses carry forward. On sale, claimed depreciation is recaptured at up to 25%, and gains may owe capital-gains tax (a 1031 exchange can defer both). Figures are a year-1 estimate at your 24.0% rate — not tax advice; consult a CPA.
Condition & rehab AI · 12 photos
This well-maintained 3-bedroom 2-bath home in Huron Shores is in good condition with a good roof and exterior. It has a good location near Lake Huron and is move-in ready with minor kitchen updates and painting needed.
Repairs flagged
- Minor kitchen cabinets — dated and could be replaced
- Minor kitchen countertops — dated and could be replaced
- Minor kitchen appliances — dated and could be replaced
Value-add opportunities
- Both update kitchen cabinets, countertops, and appliances — modernizing the kitchen would increase both resale and rental value
- Both paint interior walls — fresh paint would improve the home's curb appeal and interior aesthetics
- Both install new flooring — new flooring would improve the home's appearance and increase its value
- Both update bathrooms — updating the bathrooms would improve the home's overall appearance and increase its value
Renovation cost estimate screening
| Repair item | Severity | Est. cost |
|---|---|---|
| kitchen cabinets · dated and could be replaced | Minor | $500–3,000 |
| kitchen countertops · dated and could be replaced | Minor | $500–3,000 |
| kitchen appliances · dated and could be replaced | Minor | $500–3,000 |
| Total estimated repair cost · 3 items | $1,500–9,000 |
Value-add ROI direction
- Both update kitchen cabinets, countertops, and appliances — modernizing the kitchen would increase both resale and rental value ↑
- Both paint interior walls — fresh paint would improve the home's curb appeal and interior aesthetics ↑
- Both install new flooring — new flooring would improve the home's appearance and increase its value ↑
- Both update bathrooms — updating the bathrooms would improve the home's overall appearance and increase its value ↑
ⓘ Cost ranges are severity-bucket heuristics (US national rule-of-thumb). Get contractor quotes + a written scope before underwriting a rehab budget.
Schools (NCES district)
- District
- Carsonville-Port Sanilac School District
- NCES district ID
- 2608160
- Math proficiency
- 25% ▬ 0.00%
- Reading proficiency
- 40% ▲ 15.00%
- Median HH income
- $40,981
- Composite
- 30.12/100
- National rank
- #11603
- State rank
- #498 of 760 in MI
Livability — Port Sanilac
- Score
- 61/100
- State rank
- #576
- US rank
- #18389
Category grades
Schools grade is shown separately in the Schools card above.
Census & demographics
- Population (ZIP)
- 1,253
Population outlook (Sanilac County) Hauer SSP2
- Today (2025)
- 37,948 people
- By 2030
- 35,772 · -5.7%
- By 2040
- 30,996 · -18.3%
- By 2050
- 26,280 · -30.7%
- By 2075
- 17,471 · -54.0%
- By 2100
- 10,572 · -72.1%
Race, ethnicity, and origin ACS 2023
- Neighborhood character
- Predominantly White (95%)
- Race & ethnicity
- White 95% Hispanic / Latino 3% Two or more races 3%
- Common ancestry
- Romanian 10% Lithuanian 3% Slovak 3%
- Foreign-born
- 1% · Canada
Political lean MEDSL · Sanilac
- 2024 margin
- Solid R (+47.7) · D 25.5% · R 73.2% · Other 1.3%
- 2008→2024 swing
- -39.6pp toward R · 2008: -8.1pp · 2024: -47.7pp
- All cycles
- 2024: R+47.7 2020: R+45.6 2016: R+44.5 2012: R+20.4 2008: R+8.1
Not yet ingested
- Civics
- —
Market trends
- HPI YoY
- ▲ 5.84%
- Current HPI
- 228.2528
- Rent YoY
- —
- Metro
- —
- State GDP YoY
- ▲ 1.37%
- F500 in state
- 28
Industry mix (Fortune 500 HQ in MI)
| Industry | F500 HQs | Revenue |
|---|---|---|
| Automotive Parts | 3 | $48B |
|
||
| Automotive | 2 | $372B |
|
||
| Chemicals | 1 | $45B |
|
||
| Automotive Retail | 1 | $29B |
|
||
| Healthcare / Medical Devices | 1 | $23B |
|
||
| Automotive Technology | 1 | $20B |
|
||
Price history
-6.3% since first listed9 events — show timeline
- 2026-04-21 Listed $74,900 MiRealSource-MiMLS
- 2026-04-21 Listed $74,900 REALCOMP
- 2025-10-30 Listing Removed — MiRealSource-MiMLS
- 2025-10-13 Price Changed $73,900 MiRealSource-MiMLS
- 2025-10-13 Price Changed $73,900 REALCOMP
- 2025-09-24 Price Changed $77,900 MiRealSource-MiMLS
- 2025-09-24 Price Changed $77,900 REALCOMP
- 2025-08-28 Listed $79,900 REALCOMP
- 2025-08-28 Listed $79,900 MiRealSource-MiMLS
Cash-flow waterfall
monthlySold comps — $/sqft
last 12 mo · ≤1 miLoading sold comps…