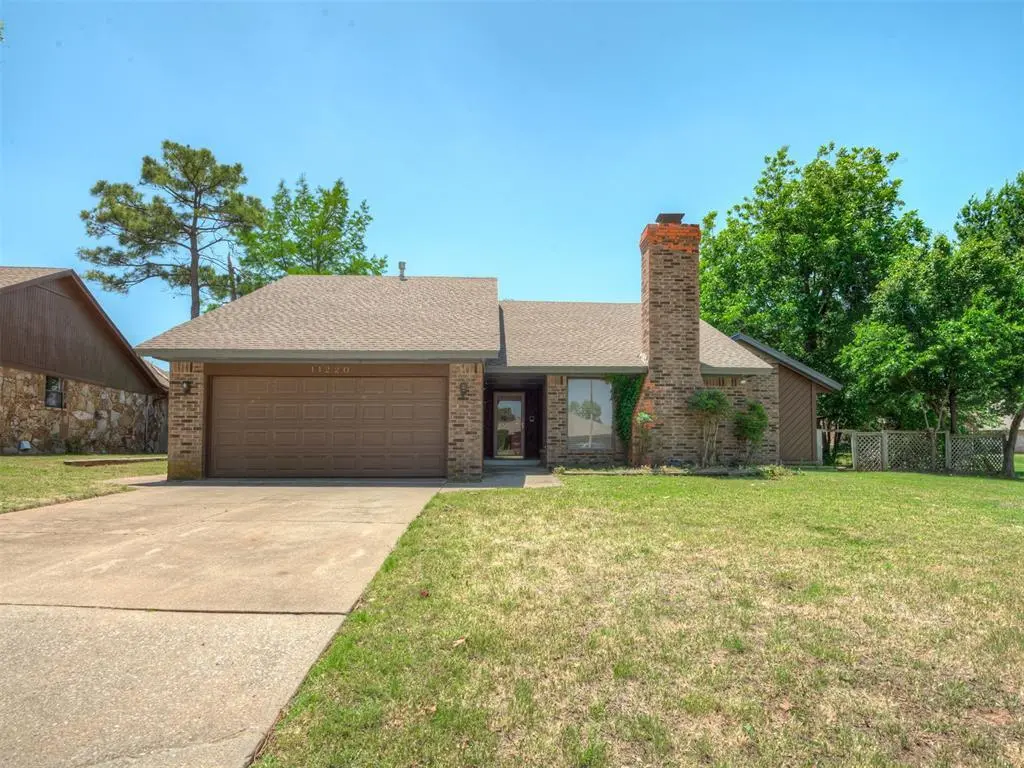
11220 NW 112th St · Oklahoma City, OK
Flood risk 1/10 · Minimal
- FEMA flood zone
- X (unshaded)
- Chance of flooding over 30 yrs
- 0.0%
- Est. flood insurance / yr
- $507 – $1,088
Fire risk 3/10 · Minor
- Est. fire insurance / yr
- $2,463 – $4,575
Heat risk 6/10 · Moderate
- Hot days now (above 106°F)
- 7 days/yr
- Hot days in 30 yrs
- 20 days/yr
Wind risk 2/10 · Minimal
- Chance of severe wind over 30 yrs
- 4.0%
Air-quality risk 1/10 · Minimal
- Unhealthy air days now
- 0 days/yr
- Unhealthy air days in 30 yrs
- 0 days/yr
Risk factors via First Street. Map © Google.
Why this score? — see what drove the C- grade
The composite is a weighted blend of 9 inputs, each scored 0–100. Each bar is that input's sub-score; the figure is the points it added to the 100-point composite (weight × sub-score).
- Cash flow +15.3/30.0
- ARV discount +14.3/15.0
- DSCR +4.7/10.0
- Livability +4.0/5.0
- 1% rule +3.6/10.0
- Rent growth +2.8/5.0
- Schools +2.8/10.0
- Condition / age +2.5/5.0
- Appreciation +0.0/10.0
$194,900
🖨 Deal sheet (PDF) 📄 Offer letter ✓ Due diligence
Listing remarks
This is your opportunity to renovate a wonderful home in sought after Surrey Hills! Although it needs quite a bit of work, the roof is around 5 years old and the dishwasher was replaced a couple of years ago! Along with the soaring high ceilings, the location is on a cul-de-sac surrounded by a greenbelt and within walking distance to Surrey Hills Elementary School! The home is surrounded by the Surrey Hills Golf Course and there is a neighborhood swimming pool just in time for summer!!! Schedule your showing today!! The home is offered in AS-IS condition and is part of a probate but has been cleared to sell. Will NOT go FHA or VA financing.
Key facts
- Cut-de-sac
- 7,022 sq ft lot
- 2 garage spots
Tags
Property features AI
Finance
- Other: Homestead exempt; No storm shelter; Vacant/Not occupied; No home warranty; Property is existing (not new construction)
- Financial info: Listing terms: Cash or Conventional
- HOA & community: Mandatory association dues; Association fee of $300 (covers common area maintenance)
Exterior
- Parking: Concrete driveway; 2-car garage
- Utilities: Cable available; Electricity available; Natural gas available; Public water/sewer
- Home design: Single-family residence; Residential property; Entry level: One
- Construction: Brick and frame construction; Heavy composition roof (replaced/updated 2021); Slab foundation
- Exterior features: Covered porch; Located on a cul-de-sac; Greenbelt lot; Interior lot
Interior
- Bedrooms: 3 bedrooms
- Bathrooms: 2 full bathrooms
- Interior features: One-level floor plan; Living area; Dining area; Gas log fireplace
- Laundry & utility: Garage door lift
Neighborhood map
What this means for you Summary
Snapshot
- This is a 3-bed/2.0-bath single-family listed at $195k.
Deal economics
- At list price, monthly cash flow is $70 ($845/yr) — positive.
- The deal already cash-flows at list — no discount required.
- To meet the 1% rule (rent ≥ 1% of price), the offer needs to be $168k (13.8% below list).
- Recommended offer: $168k (13.8% below list) — sets the bar for 1% rule.
- Cap rate 6.7% vs local median 3.7% in Oklahoma City — top-decile yield for the area; either an underpriced asset or a hidden risk that comps aren't pricing in. Stress-test before assuming the spread holds.
Location & tenants
- Location reads 80/100 on livability (#3 in OK, #1,635 nationally) — a professional / high-income tenant draw. Strengths: amenities A+, commute A+, cost of living A+; Watch: crime F.
- Yukon (suburban): math 30% / reading 32% proficiency, ranked #47 of 270 in OK (top 17%) — families likely to look elsewhere, expect single-tenant / working-renter base with shorter leases.
- Zoned schools: Surrey Hills Es (math 37% / reading 27%, grade F, #213 of 845 statewide, top 28%, 725 students, 0% FRL); Yukon Ms (math 21% / reading 26%, grade F, #113 of 345 statewide, top 34%, 1,407 students, 0% FRL); Yukon Hs (math 26% / reading 38%, grade F, #67 of 447 statewide, top 16%, 2,833 students, 0% FRL) — zoned schools average 0% FRL vs 32% district-wide (32 pts lower); this property's tenant base skews higher-income than the district average.
- Market conditions: Rents rising (+1.2%/yr); 1574 active listings in the ZIP; 36 comparable units currently listed for rent nearby; rentals leasing fast (median 14d on market — plan ~1-2 weeks tenant-placement turnaround); solid renter incomes; 260 units permitted in Canadian County in 2024 (0 in 5+ unit buildings).
Forward outlook
- Local home prices are declining (-3.0%/yr); year-one equity from $1k of loan paydown is wiped out by about $6k of value loss. Plan a longer hold.
- Canadian County population projected at +64% by 2050 — long-run rental-demand tailwind backs the buy-and-hold thesis.
Negotiation context
- Only 4 days on market — expect competitive offers; lowballing is unlikely to land.
- Current owner paid $85k; list at $195k implies a 129% gain — meaningful room to come down on a strong offer.
Risks & watch-outs
- Climate carrying-cost: extreme-heat days projected 7→20/yr by 2055 (HVAC capex compounding) — expect insurance premiums to compound above CPI over the hold.
Questions for the listing agent
- What does the HOA fee cover, when was the last increase, and are there any pending special assessments or reserve-fund shortfalls?
- Is there a deadline driving the sale (1031 exchange, divorce, estate, relocation)? That informs how much negotiation room exists.
- Schools are F-rated, which usually means shorter tenancies and higher turnover. Who's the typical renter profile here, and what's been the actual vacancy rate?
- Crime grade is F in this area — have there been break-ins, vandalism, or insurance claims at this property in the last 3 years? What carrier currently insures it and at what premium?
- What's the average days-on-market for RENTAL listings here right now (not sales)? A rising rental-DOM trend means longer vacancies and softer asking-rent achievability than the comps imply.
- What's the recent tenant-quality profile in this submarket — average credit score on applications, eviction rate, late-payment / NSF rate, and stable-employment percentage? A property-management company in the area should have these aggregated.
- How much new for-sale + rental construction is in the pipeline within 1–3 miles? Heavy new supply typically softens prices + rents 12–24 months out; constrained supply supports both.
Investment metrics
- 1% rule
- 0.86% ✗
- Cap rate
- 6.73%
- Cash-on-cash
- 1.55%
- DSCR
- 1.07
- GRM
- 9.7
CMA / ARV
- ARV (on-the-fly)
- $229,740
- Comps found
- 12
Show comp detail 12 sales within ~0.75 mi
| Address | Dist | Beds/Ba | Sqft | Sold | Price | $/sf | Match |
|---|---|---|---|---|---|---|---|
| 11228 NW 109th St | 0.23mi | 3/2.0 | 1,655 (+1%) | 4mo | $220,000 | $133 | 84 |
| 11028 Folkstone Dr | 0.24mi | 3/2.0 | 1,674 (+2%) | 7mo | $150,000 | $90 | 80 |
| 11108 NW 112th St | 0.15mi | 3/2.0 | 1,762 (+7%) | 6mo | $255,000 | $145 | 76 |
| 11004 NW 115th St | 0.37mi | 3/2.0 | 1,712 (+4%) | 2mo | $225,000 | $131 | 74 |
| 11312 Ashford Dr | 0.35mi | 4/2.0 (+1) | 1,745 (+6%) | 5mo | $232,000 | $133 | 64 |
| 11525 Hastings Ave | 0.20mi | 3/2.0 | 1,873 (+14%) | 5mo | $220,000 | $117 | 63 |
| 11037 Coachman Rd | 0.27mi | 3/2.0 | 1,826 (+11%) | 7mo | $250,000 | $137 | 63 |
| 11912 W Wickford Pl | 0.59mi | 4/2.0 (+1) | 1,687 (+3%) | 2mo | $299,900 | $178 | 61 |
| 11900 Ashford Dr | 0.56mi | 3/2.0 | 1,782 (+9%) | 4mo | $250,000 | $140 | 56 |
| 10917 NW 118th St | 0.62mi | 3/2.0 | 1,780 (+8%) | 3mo | $249,000 | $140 | 54 |
| 10800 Mountain Fork Dr | 0.46mi | 4/2.0 (+1) | 1,866 (+14%) | 0mo | $330,000 | $177 | 50 |
| 11300 NW 101st St | 0.73mi | 3/2.0 | 1,775 (+8%) | 3mo | $262,500 | $148 | 50 |
Match score weights: distance 35% · size 25% · config 20% · recency 20%. Top-matched comps best support the ARV.
Projected returns pro-forma
-3.0% appreciation · 1.19% rent growth · sell at horizon
- IRR
- -15.8%
- Equity multiple
- 0.45×
- Total profit
- $-30,134
- Equity at exit
- $29,060
- IRR
- -10.6%
- Equity multiple
- 0.40×
- Total profit
- $-32,481
- Equity at exit
- $16,851
Cash invested: $54,572 (down + closing). Projections, not guarantees.
Landlord ↔ Tenant lean methodology
- Overall (STATE)
- 83 Strongly Landlord-Friendly
- State Oklahoma
- 83 Strongly Landlord-Friendly · R+20
- County
- — inherits STATE
- City
- — inherits STATE
ZIP-level market 73099
- Rents YoY
- 1.2%
- Active inventory
- 1574
- Price-to-rent
- 9.7×
Monthly cashflow live
- Estimated rent
- $1,680 high interval (Pro) →
- Mortgage (P&I)
- −$1,022
- Tax from tax record
- −$129 /mo · $1,543/yr
- Insurance
- −$81
- HOA
- −$25
- Vacancy / Maint / Mgmt
- −$353
- Net cashflow
- $70
Break-even live
Sensitivity live
| Price | -10% $181 | -5% $126 | +0% $70 | +5% $15 | +10% $-40 |
|---|---|---|---|---|---|
| Rent | -10% $-62 | -5% $4 | +0% $70 | +5% $137 | +10% $203 |
| Rate | -1.0pp $169 | -0.5pp $120 | base $70 | +0.5pp $20 | +1.0pp $-31 |
UW: 25.0% down · 7.5% · 30yr · 1.5% tax · 5.0% vac · 8.0% maint · 8.0% mgmt
Financing live
Cash to close
- Down payment
- $48,725
- Closing costs
- $5,847
- Reserves months
- —
- Total cash needed
- —
Loan-product check · same deal, 3 products live
Conventional
25% down · 7.5% · 30yr
- Down + closing
- —
- Monthly P&I
- —
- Monthly cashflow
- —
- DSCR
- —
- Eligible?
- —
Personal DTI + credit; lowest rate.
DSCR
20% down · 8.5% · 30yr
- Down + closing
- —
- Monthly P&I
- —
- Monthly cashflow
- —
- DSCR
- —
- Eligible?
- —
No personal income docs; deal must DSCR.
Hard money
10% down · 12.0% · 12mo
- Down + closing
- —
- Monthly P&I
- —
- Monthly cashflow
- —
- DSCR
- —
- Eligible?
- —
Short-term bridge; refi at stabilization.
Rent comps 36 comps
| Address | Beds | Baths | Sqft | Rent | $/sqft | DOM | Units | Dist |
|---|---|---|---|---|---|---|---|---|
| 11206 NW 114th St Yukon, OK | 3.0 | 2.0 | 1450 | $1,495 | $1.03 | 6d | 1 | 0.09mi |
| 11202 NW 114th St Yukon, OK | 3.0 | 2.0 | 1548 | $1,549 | $1.00 | 13d | 1 | 0.10mi |
| 11214 Coachmans Rd Yukon, OK | 3.0 | 2.0 | 1305 | $1,395 | $1.07 | 6d | 1 | 0.11mi |
| 11208 Coachmans Rd Yukon, OK | 3.0 | 2.0 | 1450 | $1,495 | $1.03 | 5d | 1 | 0.14mi |
| 11907 N Mustang Rd Yukon, OK | 3.0 | 2.0 | 1400 | $1,500 | $1.07 | 13d | 1 | 0.49mi |
| 11719 Surrey Hills Blvd Yukon, OK | 2.0 | 2.0 | 1100 | $1,350 | $1.23 | 23d | 1 | 0.58mi |
| 10421 Salt Fork Dr Yukon, OK | 3.0 | 2.0 | 1733 | $1,795 | $1.04 | 12d | 1 | 0.64mi |
| 10810 NW 119th Pl Yukon, OK | 3.0 | 2.5 | 1300 | $1,495 | $1.15 | 25d | 1 | 0.67mi |
| 11244 NW 102nd St Yukon, OK | 3.0 | 2.5 | 1935 | $2,500 | $1.29 | 3d | 1 | 0.70mi |
| 10801 NW 119th Pl Yukon, OK | 3.0 | 2.5 | 1300 | $1,545 | $1.19 | 5d | 1 | 0.71mi |
| 10805 NW 119th Pl Yukon, OK | 3.0 | 2.5 | 1300 | $1,495 | $1.15 | 13d | 1 | 0.71mi |
| 11409 NW 121st Pl Unit 11409 Yukon, OK | 3.0 | 2.0 | 1439 | $1,500 | $1.04 | 16d | 1 | 0.73mi |
| 11212 NW 101st St Yukon, OK | 3.0 | 2.0 | 1633 | $1,850 | $1.13 | 5d | 1 | 0.77mi |
| 11009 NW 100th St Yukon, OK | 3.0 | 2.0 | 1329 | $1,595 | $1.20 | 25d | 1 | 0.84mi |
| 10001 Glover River Dr Yukon, OK | 3.0 | 3.0 | 1812 | $1,950 | $1.08 | 18d | 1 | 0.85mi |
| 10004 Glover River Dr Yukon, OK | 4.0 | 2.0 | 2200 | $2,450 | $1.11 | 25d | 1 | 0.85mi |
| 11112 NW 99th St Yukon, OK | 3.0 | 2.0 | 1407 | $1,700 | $1.21 | 13d | 1 | 0.90mi |
| 10005 Blue Wing Trl Yukon, OK | 4.0 | 2.0 | 2022 | $1,840 | $0.91 | 25d | 1 | 1.00mi |
| 11008 NW 97th St Yukon, OK | 3.0 | 2.0 | 1350 | $1,595 | $1.18 | 6d | 1 | 1.02mi |
| 11744 NW 99th Ter Yukon, OK | 3.0 | 2.0 | 1713 | $1,720 | $1.00 | 16d | 1 | 1.10mi |
| 9633 Glover River Dr Yukon, OK | 3.0 | 2.0 | 1316 | $1,450 | $1.10 | 25d | 1 | 1.11mi |
| 9627 Glover River Dr Yukon, OK | 3.0 | 2.0 | 1316 | $1,450 | $1.10 | 6d | 1 | 1.13mi |
| 9627 Glover River Dr Yukon, OK | 3.0 | 2.0 | 1316 | $1,450 | $1.10 | 13d | 1 | 1.13mi |
| 10049 Appaloosa Ln Yukon, OK | 4.0 | 2.0 | 1459 | $1,695 | $1.16 | 4d | 1 | 1.15mi |
| 11624 NW 96th St Yukon, OK | 4.0 | 2.0 | 1917 | $1,795 | $0.94 | 23d | 1 | 1.15mi |
| 11713 NW 95th St Yukon, OK | 4.0 | 2.0 | 1691 | $1,699 | $1.00 | 16d | 1 | 1.16mi |
| 9517 Black Tail Cir Yukon, OK | 3.0 | 2.0 | 1316 | $1,450 | $1.10 | 25d | 1 | 1.17mi |
| 9501 Timberwind Ln Yukon, OK | 3.0 | 2.0 | 1848 | $1,795 | $0.97 | 18d | 1 | 1.17mi |
| 9513 Black Tail Cir Yukon, OK | 4.0 | 2.5 | 1816 | $1,595 | $0.88 | 5d | 1 | 1.18mi |
| 9513 Black Tail Cir Yukon, OK | 4.0 | 2.5 | 1816 | $1,595 | $0.88 | 6d | 1 | 1.18mi |
| 9724 Saddle Dr Yukon, OK | 3.0 | 2.0 | 1277 | $1,595 | $1.25 | 6d | 1 | 1.18mi |
| 10052 Blackjack Rd Yukon, OK | 3.0 | 2.0 | 1402 | $1,650 | $1.18 | 6d | 1 | 1.19mi |
| 12817 Double V Dr Piedmont, OK | 4.0 | 2.0 | 1704 | $1,995 | $1.17 | 16d | 1 | 1.22mi |
| 9613 Laredo Ln Yukon, OK | 3.0 | 2.0 | 1216 | $1,475 | $1.21 | 25d | 1 | 1.29mi |
| 11444 NW 130th St Piedmont, OK | 3.0 | 2.0 | 1243 | $1,595 | $1.28 | 25d | 1 | 1.32mi |
| 13112 Grass Plain Ave Yukon, OK | 3.0 | 2.0 | 1601 | $1,950 | $1.22 | 23d | 1 | 1.39mi |
HOA detail
- Monthly dues
- $25 · $300/yr
- Likely covers
- pool
Listing history 3 events
-
2026-05-17status Pending
-
2026-05-13$194,900 Active
-
1996-11-19soldstatus $85,000
ⓘ Source: listings_history table (triggers on properties + properties_extension) + one-shot
backfill from property_details.listing_events for pre-trigger history.
Tax reassessment forecast OK · Resets to sale price
- Current annual tax
- $1,543 · $129/mo
- Projected year-2 tax
- $1,754 · $146/mo
- Expected delta
- +$211/yr (+$18/mo · 13.7%)
ⓘ Screening estimate from a state-policy table — verify with the county assessor before closing.
Climate risk First Street
- Flood 1/10 Low FEMA zone X (unshaded) · 0% chance over 30 yrs
- Wildfire 3/10 Moderate
- Heat 6/10 Major 7 d/yr ≥106°F today · 20 d/yr by 30 yrs out
- Wind 2/10 Low 4% chance of damaging wind over 30 yrs
- Air quality 1/10 Low 0 unhealthy d/yr today · 0 by 30 yrs out
Nearby sold comps map
Loading sold comps map…
Walkable amenities ~0.75 mi
Loading nearby amenities…
Taxation est. · year 1
- Rental income
- $20,161
- − Mortgage interest
- −$10,917
- − Property taxes
- −$1,543
- − Insurance
- −$974
- − Repairs & maintenance
- −$1,613
- − Management
- −$1,613
- − HOA
- −$300
- − Depreciation
- −$5,670
- Taxable loss
- −$2,469
- Est. tax savings @ 24.0%
- +$593
- After-tax cash flow
- $1,437/yr
For passive investors: Depreciation is non-cash, so a rental often shows a tax loss while cash-flowing — sheltering income. Rental losses are passive: they offset passive income freely, and up to $25,000/yr can offset ordinary (W-2) income if you actively participate and your MAGI is under $100k (phasing out to $0 by $150k); unused losses carry forward. On sale, claimed depreciation is recaptured at up to 25%, and gains may owe capital-gains tax (a 1031 exchange can defer both). Figures are a year-1 estimate at your 24.0% rate — not tax advice; consult a CPA.
Schools (NCES district)
- District
- Yukon
- NCES district ID
- 4033480
- Math proficiency
- 30% ▼ -16.00%
- Reading proficiency
- 32% ▼ -10.00%
- Median HH income
- $63,741
- Composite
- 28.35/100
- National rank
- #6776
- State rank
- #47 of 270 in OK
Livability — Oklahoma City
- Score
- 80/100
- State rank
- #3
- US rank
- #1635
Category grades
Schools grade is shown separately in the Schools card above.
Census & demographics
- Census place
- Oklahoma City, OK
- County
- Canadian County · 154,341 people
- City population
- 498,656
- Metro
- Oklahoma City, OK
- Population (ZIP)
- 91,014
- Household income
- $88,030
- Rent vs Own
- Severe rent burden
- 1838.0
Population outlook (Canadian County) Hauer SSP2
- Today (2025)
- 174,062 people
- By 2030
- 195,170 · +12.1%
- By 2040
- 239,293 · +37.5%
- By 2050
- 285,457 · +64.0%
- By 2075
- 403,766 · +132.0%
- By 2100
- 498,766 · +186.5%
Race, ethnicity, and origin ACS 2023
- Neighborhood character
- Predominantly White (73%)
- Race & ethnicity
- White 73% Two or more races 11% Hispanic / Latino 10% Black 3% Asian 3% Native American 3%
- Hispanic origin (detail)
- Mexican 7%
- Common ancestry
- Italian 2% Slovak 1% Portuguese 1%
- Foreign-born
- 5% · Canada, Vietnam
- Languages at home
- 91% English-only · Spanish 5% Vietnamese 2% Other Asian/Pacific 1%
Political lean MEDSL · Canadian
- 2024 margin
- Solid R (+40.4) · D 28.8% · R 69.2% · Other 2.0%
- 2008→2024 swing
- +11.9pp toward D · 2008: -52.2pp · 2024: -40.4pp
- All cycles
- 2024: R+40.4 2020: R+43.3 2016: R+51.2 2012: R+54.4 2008: R+52.2
Not yet ingested
- Civics
- —
Market trends
- HPI YoY
- ▼ -206.04%
- Current HPI
- 244.6836
- Rent YoY
- ▲ 1.19%
- Metro
- Oklahoma City, OK
- State GDP YoY
- ▲ 1.55%
- F500 in state
- 6
Industry mix (Fortune 500 HQ in OK)
| Industry | F500 HQs | Revenue |
|---|---|---|
| Energy | 3 | $48B |
|
||
Price history
+129.3% since first listed3 events — show timeline
- 2026-05-17 Pending — MLSOK
- 2026-05-13 Listed $194,900 MLSOK
- 1996-11-19 Sold (Public Records) $85,000 Public Records
Property tax history
+0.8%/yrLatest (2025): $1,543 · +0.2% YoY. Source: county tax records.
Cash-flow waterfall
monthlySold comps — $/sqft
last 12 mo · ≤1 miLoading sold comps…