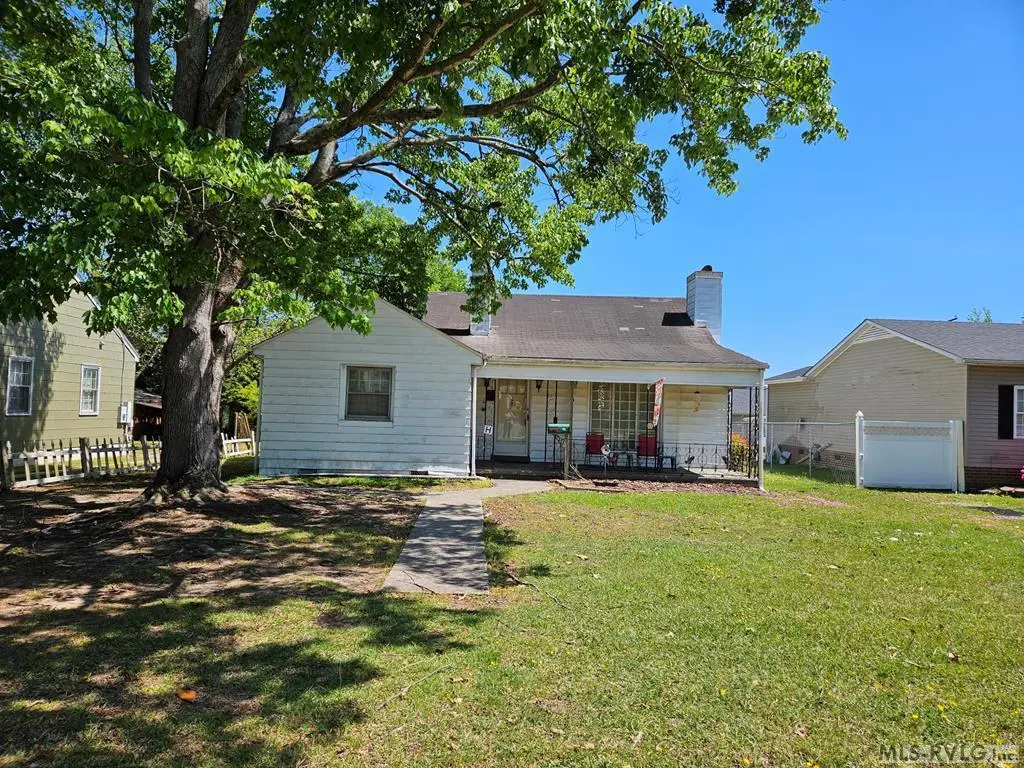
1026 Jefferson St · Roanoke Rapids, NC
Flood risk 1/10 · Minimal
- FEMA flood zone
- X (unshaded)
- Chance of flooding over 30 yrs
- 0.0%
- Est. flood insurance / yr
- $473 – $860
Fire risk 2/10 · Minimal
- Est. fire insurance / yr
- $906 – $1,684
Heat risk 8/10 · Major
- Hot days now (above 108°F)
- 7 days/yr
- Hot days in 30 yrs
- 16 days/yr
Wind risk 6/10 · Moderate
- Chance of severe wind over 30 yrs
- 64.0%
Air-quality risk 1/10 · Minimal
- Unhealthy air days now
- 0 days/yr
- Unhealthy air days in 30 yrs
- 0 days/yr
Risk factors via First Street. Map © Google.
Why this score? — see what drove the B- grade
The composite is a weighted blend of 9 inputs, each scored 0–100. Each bar is that input's sub-score; the figure is the points it added to the 100-point composite (weight × sub-score).
- Cash flow +26.0/30.0
- ARV discount +15.0/15.0
- DSCR +8.8/10.0
- 1% rule +7.0/10.0
- Schools +2.9/10.0
- Livability +2.8/5.0
- Rent growth +2.5/5.0
- Condition / age +2.5/5.0
- Appreciation +0.0/10.0
$95,500
🖨 Deal sheet 📄 Offer letter ✓ Due diligence
Listing remarks
Charming 3-Bedroom Home in the Manning School District This 3-bedroom, 1-bath home is full of character and potential, offering an affordable opportunity for a new homeowner or investor to make it their own. The spacious living room features a cozy fireplace, while the separate dining room showcases beautiful arched doorways that add timeless charm. With plenty of room to personalize and update, this home is ready for your vision. Conveniently located in the Manning School District, this property is being sold as-is. Conventional loans, rehabilitation loans, or cash offers only. Don't miss this opportunity—schedule your showing today!
Key facts
- Arched doorways
- Cozy fireplace
- 8,276 sq ft lot
Tags
Property features AI
Exterior
- Parking: No garage
- Utilities: Public water; Public sewer; DSL/Cable available
- Home design: One-story residential home; Residential/Vacation property type
- Construction: Aluminum siding; Composition roof
- Exterior features: Front porch; Deck; Has a view
Interior
- Kitchen: No appliances included
- Flooring: Wood flooring; Vinyl flooring
- Bathrooms: 1 full bathroom
- Heating & cooling: Central air; Has heating
- Interior features: Storm windows; Gas log fireplace in the living room; 6 total rooms; No basement
Neighborhood map
What this means for you Summary
Snapshot
- This is a 3-bed/1.0-bath single-family listed at $96k.
Deal economics
- At list price, monthly cash flow is $238 ($3k/yr) — positive.
- The deal already cash-flows at list — no discount required.
- Meets the 1% rule at list price ($1k rent vs $96k).
- Cap rate 9.3% vs local median 4.1% in Roanoke Rapids — top-decile yield for the area; either an underpriced asset or a hidden risk that comps aren't pricing in. Stress-test before assuming the spread holds.
Location & tenants
- Location reads 56/100 on livability (#631 in NC) — a working-class tenant base; expect higher turnover. Strengths: cost of living A+, health & safety A, housing B+; Watch: crime F, amenities F, commute F.
- Roanoke Rapids City Schools (town): math 31% / reading 37% proficiency, ranked #135 of 178 in NC (top 76%) — families likely to look elsewhere, expect single-tenant / working-renter base with shorter leases.
- Zoned schools: Manning Elementary School (math 28% / reading 36%, grade F, #908 of 1,410 statewide, top 67%, 647 students, 100% FRL); Chaloner Middle School (math 31% / reading 40%, grade F, #279 of 475 statewide, top 60%, 616 students, 100% FRL); Roanoke Rapids High School (math 52% / reading 37%, grade F, #352 of 535 statewide, top 68%, 783 students, 100% FRL) — zoned schools average 100% FRL vs 53% district-wide (46 pts higher); higher-poverty schools than district average — tighter screening recommended.
- Market conditions: 143 active listings in the ZIP; 5 comparable units currently listed for rent nearby; rentals lingering (median 44d on market — plan ~5-8 weeks vacancy on turnover, expect pricing pressure); 100% of comp listings sitting > 30 days — soft ceiling on asking rent; 55 units permitted in Halifax County in 2024 (0 in 5+ unit buildings).
Forward outlook
- Local home prices are declining (-3.0%/yr); year-one equity from $660 of loan paydown is wiped out by about $3k of value loss. Plan a longer hold.
- Halifax County population projected at -27% by 2050 — secular population decline; favor cash flow + early exit over multi-decade hold.
Negotiation context
- Only 9 days on market — expect competitive offers; lowballing is unlikely to land.
- Current owner paid $58k; list at $96k implies a 63% gain — meaningful room to come down on a strong offer.
Risks & watch-outs
- Watch-outs: built in 1948 — expect roof / HVAC / electrical / plumbing capex.
- Climate carrying-cost: major wind risk, 64% chance of damaging wind over 30y; extreme-heat days projected 7→16/yr by 2055 (HVAC capex compounding) — expect insurance premiums to compound above CPI over the hold.
Questions for the listing agent
- Built in 1948 — when were the roof, HVAC, electrical panel, plumbing, and water heater last replaced?
- Is there a deadline driving the sale (1031 exchange, divorce, estate, relocation)? That informs how much negotiation room exists.
- Schools are F-rated, which usually means shorter tenancies and higher turnover. Who's the typical renter profile here, and what's been the actual vacancy rate?
- Crime grade is F in this area — have there been break-ins, vandalism, or insurance claims at this property in the last 3 years? What carrier currently insures it and at what premium?
- What's the average days-on-market for RENTAL listings here right now (not sales)? A rising rental-DOM trend means longer vacancies and softer asking-rent achievability than the comps imply.
- What's the recent tenant-quality profile in this submarket — average credit score on applications, eviction rate, late-payment / NSF rate, and stable-employment percentage? A property-management company in the area should have these aggregated.
- How much new for-sale + rental construction is in the pipeline within 1–3 miles? Heavy new supply typically softens prices + rents 12–24 months out; constrained supply supports both.
Investment metrics
- 1% rule
- 1.20% ✓
- Cap rate
- 9.28%
- Cash-on-cash
- 10.68%
- DSCR
- 1.48
- GRM
- 7.0
CMA / ARV
- ARV (on-the-fly)
- $173,990
- Comps found
- 9
Show comp detail 9 sales within ~0.75 mi
| Address | Dist | Beds/Ba | Sqft | Sold | Price | $/sf | Match |
|---|---|---|---|---|---|---|---|
| 407 East 15th St | 0.55mi | 3/1.5 | 1,381 (+1%) | 8mo | $153,500 | $111 | 64 |
| 1312 Washington St | 0.37mi | 3/2.0 | 1,437 (+5%) | 13mo | $169,300 | $118 | 59 |
| 1022 E 9th St | 0.55mi | 3/1.5 | 1,395 (+2%) | 13mo | $175,500 | $126 | 59 |
| 910 Marshall St | 0.26mi | 3/2.0 | 1,240 (-10%) | 12mo | $158,000 | $127 | 58 |
| 815 Raleigh St | 0.42mi | 3/2.0 | 1,268 (-7%) | 13mo | $180,000 | $142 | 53 |
| 817 Allen Avene Ave | 0.61mi | 3/2.0 | 1,457 (+6%) | 10mo | $225,000 | $154 | 49 |
| 508 Jefferson St | 0.68mi | 3/2.0 | 1,450 (+6%) | 13mo | $212,500 | $147 | 44 |
| 936 Vance St | 0.62mi | 3/1.0 | 1,504 (+10%) | 13mo | $40,000 | $27 | 44 |
| 1103 E 7th St | 0.72mi | 3/2.0 | 1,523 (+11%) | 7mo | $220,000 | $144 | 38 |
Match score weights: distance 35% · size 25% · config 20% · recency 20%. Top-matched comps best support the ARV.
Projected returns pro-forma
-3.0% appreciation · 3.0% rent growth · sell at horizon
- IRR
- -0.3%
- Equity multiple
- 0.99×
- Total profit
- $-299
- Equity at exit
- $14,239
- IRR
- 9.4%
- Equity multiple
- 1.72×
- Total profit
- $19,339
- Equity at exit
- $8,257
Cash invested: $26,740 (down + closing). Projections, not guarantees.
Landlord ↔ Tenant lean methodology
- Overall (STATE)
- 85 Strongly Landlord-Friendly
- State North Carolina
- 85 Strongly Landlord-Friendly · R+3
- County
- — inherits STATE
- City
- — inherits STATE
ZIP-level market 27870
- Home prices YoY
- -21.1%
- Active inventory
- 143
- Price-to-rent
- 7.0×
Monthly cashflow live
- Estimated rent
- $1,144 high interval (Pro) →
- Mortgage (P&I)
- −$501
- Tax from tax record
- −$126 /mo · $1,507/yr
- Insurance
- −$40
- HOA
- −$0
- Vacancy / Maint / Mgmt
- −$240
- Net cashflow
- $238
Break-even live
UW: 25.0% down · 7.5% · 30yr · 1.5% tax · 5.0% vac · 8.0% maint · 8.0% mgmt
Financing live
Cash to close
- Down payment
- $23,875
- Closing costs
- $2,865
- Reserves months
- —
- Total cash needed
- —
Loan-product check · same deal, 3 products live
Conventional
25% down · 7.5% · 30yr
- Down + closing
- —
- Monthly P&I
- —
- Monthly cashflow
- —
- DSCR
- —
- Eligible?
- —
Personal DTI + credit; lowest rate.
DSCR
20% down · 8.5% · 30yr
- Down + closing
- —
- Monthly P&I
- —
- Monthly cashflow
- —
- DSCR
- —
- Eligible?
- —
No personal income docs; deal must DSCR.
Hard money
10% down · 12.0% · 12mo
- Down + closing
- —
- Monthly P&I
- —
- Monthly cashflow
- —
- DSCR
- —
- Eligible?
- —
Short-term bridge; refi at stabilization.
Rent comps 5 comps
| Address | Beds | Baths | Sqft | Rent | $/sqft | DOM | Units | Dist |
|---|---|---|---|---|---|---|---|---|
| 1215 Carolina Ave Roanoke Rapids, NC | 2.0 | 2.0 | 1465 | $1,200 | $0.82 | 44d | 1 | 0.67mi |
| 1028 Cleveland St Roanoke Rapids, NC | 3.0 | 1.5 | 1302 | $1,450 | $1.11 | 44d | 1 | 0.88mi |
| 617 E Littleton Rd Unit B Roanoke Rapids, NC | 2.0 | 1.5 | 1300 | $900 | $0.69 | 44d | 1 | 1.10mi |
| 236 E Littleton Rd Roanoke Rapids, NC | 2.0–3.0 | 1.0–2.0 | 1021 | $920 | $0.90 | 44d | 10 | 1.14mi |
| 101 Washington St Roanoke Rapids, NC | 2.0 | 1.0 | 1212 | $900 | $0.74 | 44d | 1 | 1.19mi |
Listing history 18 events
-
2026-06-19days on market $95,500 Active 9 DOM
-
2026-06-18days on market $95,500 Active 8 DOM
-
2026-06-17days on market $95,500 Active 7 DOM
-
2026-06-16days on market $95,500 Active 6 DOM
-
2026-06-15days on market $95,500 Active 5 DOM
-
2026-06-14days on market $95,500 Active 3 DOM
-
2026-06-12remarks 643-char remark
-
2026-06-12pricedays on market $95,500 Active 2 DOM
-
2026-06-07remarks 456-char remark
-
2026-06-07statusdays on market $99,000 Active 55 DOM
-
2026-06-02status $99,000 Pending 52 DOM
-
2026-06-01days on market $99,000 Active 52 DOM
-
2026-05-31days on market $99,000 Active 51 DOM
-
2026-05-30days on market $99,000 Active 50 DOM
-
2026-05-21price $99,000
-
2026-05-05price $105,000
-
2026-04-10$110,000 Active
-
2001-09-27soldstatus $58,500
ⓘ Source: listings_history table (triggers on properties + properties_extension) + one-shot
backfill from property_details.listing_events for pre-trigger history.
Tax reassessment forecast NC · Resets to sale price
- Current annual tax
- $1,507 · $126/mo
- Projected year-2 tax
- $1,507 · $126/mo
- Expected delta
- $0/yr ($0/mo · 0.0%)
ⓘ Screening estimate from a state-policy table — verify with the county assessor before closing.
Climate risk First Street
- Flood 1/10 Low FEMA zone X (unshaded) · 0% chance over 30 yrs
- Wildfire 2/10 Low
- Heat 8/10 Severe 7 d/yr ≥108°F today · 16 d/yr by 30 yrs out
- Wind 6/10 Major 64% chance of damaging wind over 30 yrs
- Air quality 1/10 Low 0 unhealthy d/yr today · 0 by 30 yrs out
Nearby sold comps map
Loading sold comps map…
Walkable amenities ~0.75 mi
Loading nearby amenities…
Taxation est. · year 1
- Rental income
- $13,734
- − Mortgage interest
- −$5,349
- − Property taxes
- −$1,507
- − Insurance
- −$478
- − Repairs & maintenance
- −$1,099
- − Management
- −$1,099
- − Depreciation
- −$2,778
- Taxable income
- $1,424
- Est. tax owed @ 24.0%
- −$342
- After-tax cash flow
- $2,514/yr
For passive investors: Depreciation is non-cash, so a rental often shows a tax loss while cash-flowing — sheltering income. Rental losses are passive: they offset passive income freely, and up to $25,000/yr can offset ordinary (W-2) income if you actively participate and your MAGI is under $100k (phasing out to $0 by $150k); unused losses carry forward. On sale, claimed depreciation is recaptured at up to 25%, and gains may owe capital-gains tax (a 1031 exchange can defer both). Figures are a year-1 estimate at your 24.0% rate — not tax advice; consult a CPA.
Schools (NCES district)
- District
- Roanoke Rapids City Schools
- NCES district ID
- 3703900
- Math proficiency
- 31% ▼ -8.00%
- Reading proficiency
- 37% ▲ 1.00%
- Median HH income
- $41,604
- Composite
- 28.7/100
- National rank
- #6689
- State rank
- #135 of 178 in NC
Livability — Roanoke Rapids
- Score
- 56/100
- State rank
- #631
- US rank
- #22900
Category grades
Schools grade is shown separately in the Schools card above.
Census & demographics
- Census place
- Roanoke Rapids, NC
- County
- Halifax County · 24,958 people
- Metro
- Roanoke Rapids, NC
- Population (ZIP)
- 24,958
- Household income
- $49,502
- Rent vs Own
- Severe rent burden
- 822.0
Population outlook (Halifax County) Hauer SSP2
- Today (2025)
- 47,976 people
- By 2030
- 45,450 · -5.3%
- By 2040
- 39,980 · -16.7%
- By 2050
- 34,863 · -27.3%
- By 2075
- 25,577 · -46.7%
- By 2100
- 18,365 · -61.7%
Race, ethnicity, and origin ACS 2023
- Neighborhood character
- Diverse neighborhood (Simpson 0.61)
- Race & ethnicity
- White 47% Black 40% Two or more races 7% Hispanic / Latino 5% Asian 1%
- Common ancestry
- Slovak 1% Italian 1% Serbian 1%
- Foreign-born
- 3% · Canada, Vietnam
- Languages at home
- 94% English-only · Spanish 4% Other Asian/Pacific 1%
Political lean MEDSL · Halifax
- 2024 margin
- D (+17.7) · D 58.5% · R 40.9%
- 2008→2024 swing
- -10.6pp toward R · 2008: 28.2pp · 2024: 17.7pp
- All cycles
- 2024: D+17.7 2020: D+21.2 2016: D+26.9 2012: D+32.0 2008: D+28.2
Not yet ingested
- Civics
- —
Market trends
- HPI YoY
- ▼ -47.78%
- Current HPI
- 179.1705
- Rent YoY
- —
- Metro
- Roanoke Rapids, NC
- State GDP YoY
- ▲ 3.28%
- F500 in state
- 26
Industry mix (Fortune 500 HQ in NC)
| Industry | F500 HQs | Revenue |
|---|---|---|
| Financial Services | 2 | $213B |
|
||
| Retail | 2 | $95B |
|
||
| Industrial Conglomerate | 1 | $38B |
|
||
| Metals / Steel | 1 | $35B |
|
||
| Utilities | 1 | $30B |
|
||
| Industrial Machinery | 1 | $19B |
|
||
Price history
+69.2% since first listed4 events — show timeline
- 2026-05-21 Price Changed $99,000 RVLG
- 2026-05-05 Price Changed $105,000 RVLG
- 2026-04-10 Listed $110,000 RVLG
- 2001-09-27 Sold (Public Records) $58,500 Public Records
Property tax history
+1.6%/yrLatest (2025): $1,507 · +1.3% YoY. Source: county tax records.
Cash-flow waterfall
monthlySold comps — $/sqft
last 12 mo · ≤1 miLoading sold comps…