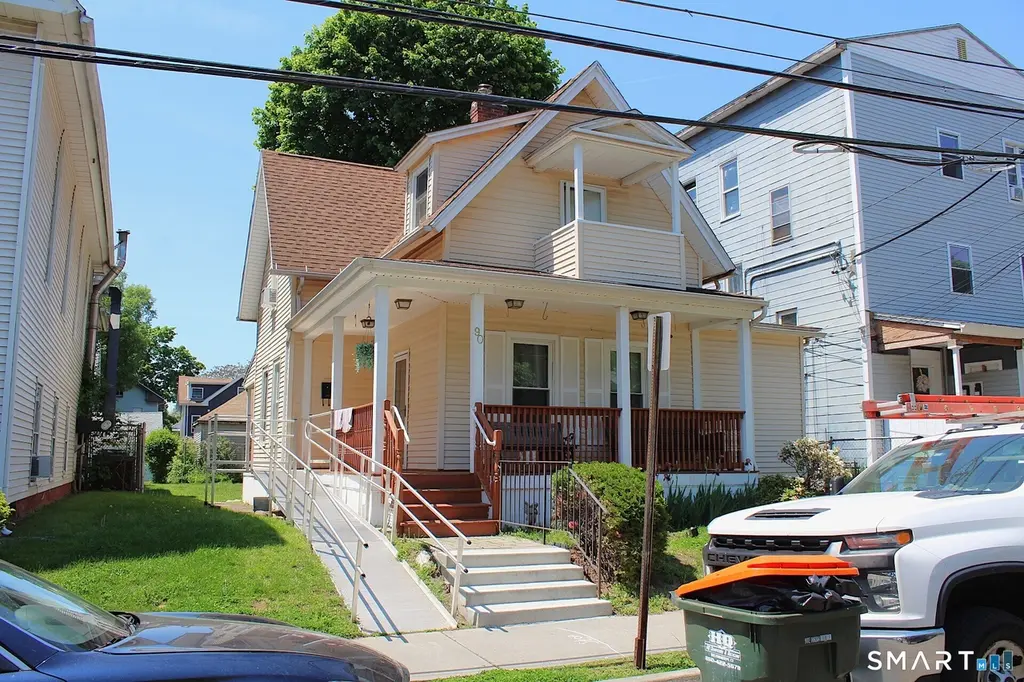
90 Franklin St · Meriden, CT
Flood risk 3/10 · Minor
- FEMA flood zone
- X (unshaded)
- Chance of flooding over 30 yrs
- 0.1%
- Est. flood insurance / yr
- $473 – $860
Fire risk 1/10 · Minimal
- Est. fire insurance / yr
- $829 – $1,539
Heat risk 6/10 · Moderate
- Hot days now (above 98°F)
- 7 days/yr
- Hot days in 30 yrs
- 17 days/yr
Wind risk 6/10 · Moderate
- Chance of severe wind over 30 yrs
- 27.0%
Air-quality risk 4/10 · Minor
- Unhealthy air days now
- 3 days/yr
- Unhealthy air days in 30 yrs
- 5 days/yr
Risk factors via First Street. Map © Google.
Why this score? — see what drove the D+ grade
The composite is a weighted blend of 9 inputs, each scored 0–100. Each bar is that input's sub-score; the figure is the points it added to the 100-point composite (weight × sub-score).
- Cash flow +13.9/30.0
- ARV discount +12.1/15.0
- DSCR +4.2/10.0
- Livability +4.2/5.0
- 1% rule +3.8/10.0
- Schools +3.0/10.0
- Rent growth +2.9/5.0
- Condition / age +2.5/5.0
- Appreciation +0.0/10.0
$255,000
🖨 Deal sheet (PDF) 📄 Offer letter ✓ Due diligence
Listing remarks
This 4-bedroom, 2 full bath colonial-style home offers a practical and adaptable floor plan with two bedrooms on the main level and two upstairs. The main-level full bath is handicapped accessible, supporting true one-level living if needed, while the second-floor bath features a classic footed tub. The living room includes built-ins for added storage and function. Upstairs, a versatile extra room provides options for a potential fifth bedroom, secondary kitchen area, or flex space. This home is conveniently located just a stone's throw away from City Park and with easy access to major highways, offering both neighborhood convenience and commuter accessibility. Don't miss out on this opport
Key facts
- 3,484 sq ft lot
- Built 1900
- Listed 30 days
Property features AI
Exterior
- Utilities: Public water connected; Public sewer connected; Oil tank located in basement
- Home design: Single-family home; Frame construction; Yellow exterior siding
- Construction: Asphalt shingle roof; Vinyl siding; Concrete foundation
- Exterior features: Sidewalk; Porch; Outdoor lighting; Dry, level, cleared lot
Interior
- Kitchen: Gas range; Refrigerator
- Bedrooms: 4 bedrooms (total)
- Bathrooms: 2 full bathrooms
- Heating & cooling: Hot air heating; Oil-fired heat; Programmable thermostat; 40-gallon hot water tank (oil)
- Interior features: Cable available; Thermostat(s); Accessible bath and ramps
- Laundry & utility: Washer
Neighborhood map
What this means for you Summary
Snapshot
- This is a 4-bed/2.0-bath single-family listed at $255k.
Deal economics
- At list price, monthly cash flow is $29 ($348/yr) — positive.
- The deal already cash-flows at list — no discount required.
- To meet the 1% rule (rent ≥ 1% of price), the offer needs to be $225k (11.8% below list).
- Recommended offer: $225k (11.8% below list) — sets the bar for 1% rule.
- Cap rate 6.4% vs local median 4.0% in Meriden — top-decile yield for the area; either an underpriced asset or a hidden risk that comps aren't pricing in. Stress-test before assuming the spread holds.
Location & tenants
- Location reads 85/100 on livability (#4 in CT, #505 nationally) — a professional / high-income tenant draw. Strengths: amenities A+, housing A+, health & safety A+.
- Meriden School District (suburban): math 27% / reading 41% proficiency, ranked #116 of 153 in CT (top 76%) — families likely to look elsewhere, expect single-tenant / working-renter base with shorter leases; 61% free/reduced lunch — lower-income household profile, screen leases tightly.
- Zoned schools: Nathan Hale School (math 31% / reading 44%, grade F, #317 of 553 statewide, top 57%, 523 students, 74% FRL); Washington Middle School (math 31% / reading 42%, grade F, #118 of 175 statewide, top 68%, 622 students, 81% FRL); Francis T. Maloney High School (math 20% / reading 45%, grade F, #125 of 194 statewide, top 66%, 1,264 students, 71% FRL).
- Market conditions: Rents rising (+1.6%/yr); 102 active listings in the ZIP; 18 comparable units currently listed for rent nearby; rentals lingering (median 46d on market — plan ~5-8 weeks vacancy on turnover, expect pricing pressure); 56% of comp listings sitting > 30 days — soft ceiling on asking rent; 1,059 units permitted in South Central Connecticut Planning Region in 2024 (779 in 5+ unit buildings).
- This rent runs 38% of the median local income ($71k/yr) — at the standard rent-burdened threshold; future hikes will face affordability resistance.
Forward outlook
- Local home prices are declining (-3.0%/yr); year-one equity from $2k of loan paydown is wiped out by about $8k of value loss. Plan a longer hold.
Negotiation context
- It's been on market 30 days — a 2% lower offer ($251k) is reasonable based on typical stale-listing flexibility.
- 2 sale attempts since 20y ago with the ask held roughly flat each time — persistent listings suggest the price (not the market) is what's stuck; bring a comps-based counter.
Risks & watch-outs
- Watch-outs: built in 1900 — expect roof / HVAC / electrical / plumbing capex.
- Climate carrying-cost: major wind risk, 27% chance of damaging wind over 30y; extreme-heat days projected 7→17/yr by 2055 (HVAC capex compounding) — expect insurance premiums to compound above CPI over the hold.
Questions for the listing agent
- Built in 1900 — when were the roof, HVAC, electrical panel, plumbing, and water heater last replaced?
- Is there a deadline driving the sale (1031 exchange, divorce, estate, relocation)? That informs how much negotiation room exists.
- The area grade is low — what's the realistic commute time and amenity access for the typical tenant pool here? Any planned neighborhood developments (good or bad) we should know about?
- What's the average days-on-market for RENTAL listings here right now (not sales)? A rising rental-DOM trend means longer vacancies and softer asking-rent achievability than the comps imply.
- What's the recent tenant-quality profile in this submarket — average credit score on applications, eviction rate, late-payment / NSF rate, and stable-employment percentage? A property-management company in the area should have these aggregated.
- How much new for-sale + rental construction is in the pipeline within 1–3 miles? Heavy new supply typically softens prices + rents 12–24 months out; constrained supply supports both.
Investment metrics
- 1% rule
- 0.88% ✗
- Cap rate
- 6.43%
- Cash-on-cash
- 0.49%
- DSCR
- 1.02
- GRM
- 9.4
CMA / ARV
- ARV (on-the-fly)
- $284,080
- Comps found
- 10
Show comp detail 10 sales within ~0.75 mi
| Address | Dist | Beds/Ba | Sqft | Sold | Price | $/sf | Match |
|---|---|---|---|---|---|---|---|
| 149 Woodland St | 0.60mi | 4/1.0 | 1,286 (-4%) | 4mo | $303,000 | $236 | 58 |
| 10 Howe St | 0.31mi | 4/1.5 | 1,234 (-8%) | 17mo | $259,000 | $210 | 56 |
| 24 Hobart St | 0.65mi | 3/1.5 (-1) | 1,360 (+2%) | 6mo | $275,000 | $202 | 55 |
| 34 Hobart St | 0.63mi | 3/1.0 (-1) | 1,329 (-1%) | 10mo | $289,000 | $217 | 52 |
| 19 Blackstone St | 0.74mi | 3/1.5 (-1) | 1,400 (+4%) | 6mo | $333,000 | $238 | 46 |
| 38 Locust St | 0.54mi | 3/2.0 (-1) | 1,502 (+12%) | 8mo | $319,000 | $212 | 42 |
| 175 Gracey Ave | 0.58mi | 3/1.0 (-1) | 1,417 (+6%) | 19mo | $320,000 | $226 | 39 |
| 81 Wall St | 0.68mi | 3/1.0 (-1) | 1,194 (-11%) | 3mo | $225,200 | $189 | 38 |
| 129 Atkins St | 0.67mi | 3/1.0 (-1) | 1,210 (-10%) | 15mo | $250,000 | $207 | 31 |
| 154 N Pearl St | 0.73mi | 3/1.5 (-1) | 1,512 (+13%) | 10mo | $320,000 | $212 | 29 |
Match score weights: distance 35% · size 25% · config 20% · recency 20%. Top-matched comps best support the ARV.
Projected returns pro-forma
-3.0% appreciation · 1.65% rent growth · sell at horizon
- IRR
- -17.0%
- Equity multiple
- 0.41×
- Total profit
- $-42,464
- Equity at exit
- $38,021
- IRR
- -11.6%
- Equity multiple
- 0.35×
- Total profit
- $-46,537
- Equity at exit
- $22,048
Cash invested: $71,400 (down + closing). Projections, not guarantees.
Landlord ↔ Tenant lean methodology
- Overall (STATE)
- 27 Tenant-Leaning
- State Connecticut
- 27 Tenant-Leaning · D+7
- County
- — inherits STATE
- City
- — inherits STATE
ZIP-level market 06450
- Rents YoY
- 1.6%
- Active inventory
- 102
- Price-to-rent
- 9.4×
Monthly cashflow live
- Estimated rent
- $2,249 high interval (Pro) →
- Mortgage (P&I)
- −$1,337
- Tax from tax record
- −$304 /mo · $3,651/yr
- Insurance
- −$106
- HOA
- −$0
- Vacancy / Maint / Mgmt
- −$472
- Net cashflow
- $29
Break-even live
Sensitivity live
| Price | -10% $173 | -5% $101 | +0% $29 | +5% $-43 | +10% $-115 |
|---|---|---|---|---|---|
| Rent | -10% $-149 | -5% $-60 | +0% $29 | +5% $118 | +10% $207 |
| Rate | -1.0pp $157 | -0.5pp $94 | base $29 | +0.5pp $-37 | +1.0pp $-104 |
UW: 25.0% down · 7.5% · 30yr · 1.5% tax · 5.0% vac · 8.0% maint · 8.0% mgmt
Financing live
Cash to close
- Down payment
- $63,750
- Closing costs
- $7,650
- Reserves months
- —
- Total cash needed
- —
Loan-product check · same deal, 3 products live
Conventional
25% down · 7.5% · 30yr
- Down + closing
- —
- Monthly P&I
- —
- Monthly cashflow
- —
- DSCR
- —
- Eligible?
- —
Personal DTI + credit; lowest rate.
DSCR
20% down · 8.5% · 30yr
- Down + closing
- —
- Monthly P&I
- —
- Monthly cashflow
- —
- DSCR
- —
- Eligible?
- —
No personal income docs; deal must DSCR.
Hard money
10% down · 12.0% · 12mo
- Down + closing
- —
- Monthly P&I
- —
- Monthly cashflow
- —
- DSCR
- —
- Eligible?
- —
Short-term bridge; refi at stabilization.
Rent comps 18 comps
| Address | Beds | Baths | Sqft | Rent | $/sqft | DOM | Units | Dist |
|---|---|---|---|---|---|---|---|---|
| 96 Franklin St Unit 2nd Floor Meriden, CT | 3.0 | 1.0 | 900 | $1,800 | $2.00 | 45d | 1 | 0.02mi |
| 17 Sherman Ave Unit 3rd Meriden, CT | 3.0 | 1.0 | 1088 | $2,300 | $2.11 | 45d | 1 | 0.14mi |
| 75 Wilcox Ave Meriden, CT | 4.0 | 1.0 | 1763 | $2,350 | $1.33 | 45d | 1 | 0.24mi |
| 120 Wilcox Ave Unit 2 Meriden, CT | 3.0 | 1.0 | 1250 | $2,000 | $1.60 | 13d | 1 | 0.29mi |
| 51 Park St Meriden, CT | 1.0–3.0 | 1.0–1.5 | 800 | $2,260 | $2.83 | 4d | 6 | 0.35mi |
| 19 Cambridge St Unit 2 Meriden, CT | 3.0 | 1.0 | 1100 | $2,100 | $1.91 | 45d | 1 | 0.43mi |
| 1068 Broad St Unit 1 Meriden, CT | 3.0 | 1.0 | 1200 | $2,000 | $1.67 | 45d | 1 | 0.47mi |
| 300 Britannia St Meriden, CT | 1.0–4.0 | 1.0–2.0 | 980 | $2,725 | $2.78 | 4d | 8 | 0.50mi |
| 19 Hobart St #1 Meriden, CT | 3.0 | 2.0 | 1105 | $2,200 | $1.99 | 45d | 1 | 0.68mi |
| 49 Springdale Ave Meriden, CT | 4.0 | 1.0 | 1000 | $2,200 | $2.20 | 45d | 1 | 0.77mi |
| 1 Barristers Ct Unit 2nd Flr Meriden, CT | 3.0 | 1.0 | 1512 | $2,200 | $1.46 | 25d | 1 | 0.78mi |
| 39 N Spring St Unit 2 Meriden, CT | 3.0 | 1.0 | 1650 | $2,400 | $1.45 | 45d | 1 | 0.83mi |
| 25 Amity St Meriden, CT | 3.0 | 1.5 | 1776 | $2,500 | $1.41 | 25d | 1 | 0.92mi |
| 88 Olive St Meriden, CT | 3.0 | 1.0 | 1100 | $1,600 | $1.45 | 45d | 1 | 1.00mi |
| 200 Sams Rd Meriden, CT | 2.0–3.0 | 1.5–2.5 | 855 | $2,700 | $3.16 | 3d | 4 | 1.07mi |
| 11 Nutmeg Dr Meriden, CT | 2.0–3.0 | 1.5–2.5 | 1600 | $2,600 | $1.62 | 3d | 4 | 1.26mi |
| 19 Goff St Meriden, CT | 3.0 | 1.5 | 900 | $1,700 | $1.89 | 45d | 1 | 1.41mi |
| 31 Winthrop St Meriden, CT | 4.0 | 2.0 | 1550 | $2,400 | $1.55 | 5d | 1 | 1.45mi |
Listing history 18 events
-
2026-06-22days on market $255,000 Active 30 DOM
-
2026-06-18days on market $255,000 Active 27 DOM
-
2026-06-17days on market $255,000 Active 26 DOM
-
2026-06-16days on market $255,000 Active 25 DOM
-
2026-06-15days on market $255,000 Active 24 DOM
-
2026-06-14days on market $255,000 Active 22 DOM
-
2026-06-10days on market $255,000 Active 19 DOM
-
2026-06-09days on market $255,000 Active 18 DOM
-
2026-06-08days on market $255,000 Active 17 DOM
-
2026-06-07days on market $255,000 Active 16 DOM
-
2026-06-05days on market $255,000 Active 13 DOM
-
2026-06-03days on market $255,000 Active 12 DOM
-
2026-06-03days on market $255,000 Active 11 DOM
-
2026-06-01days on market $255,000 Active 10 DOM
-
2026-05-31days on market $255,000 Active 9 DOM
-
2026-05-18historical $255,000
-
2007-07-06historical
-
2006-07-06$147,900
ⓘ Source: listings_history table (triggers on properties + properties_extension) + one-shot
backfill from property_details.listing_events for pre-trigger history.
Tax reassessment forecast CT · Partial reset (capped growth)
- Current annual tax
- $3,651 · $304/mo
- Projected year-2 tax
- $4,554 · $380/mo
- Expected delta
- +$903/yr (+$75/mo · 24.7%)
ⓘ Screening estimate from a state-policy table — verify with the county assessor before closing.
Climate risk First Street
- Flood 3/10 Moderate FEMA zone X (unshaded) · 10% chance over 30 yrs
- Wildfire 1/10 Low
- Heat 6/10 Major 7 d/yr ≥98°F today · 17 d/yr by 30 yrs out
- Wind 6/10 Major 27% chance of damaging wind over 30 yrs
- Air quality 4/10 Moderate 3 unhealthy d/yr today · 5 by 30 yrs out
Nearby sold comps map
Loading sold comps map…
Walkable amenities ~0.75 mi
Loading nearby amenities…
Taxation est. · year 1
- Rental income
- $26,988
- − Mortgage interest
- −$14,284
- − Property taxes
- −$3,651
- − Insurance
- −$1,275
- − Repairs & maintenance
- −$2,159
- − Management
- −$2,159
- − Depreciation
- −$7,418
- Taxable loss
- −$3,958
- Est. tax savings @ 24.0%
- +$950
- After-tax cash flow
- $1,298/yr
For passive investors: Depreciation is non-cash, so a rental often shows a tax loss while cash-flowing — sheltering income. Rental losses are passive: they offset passive income freely, and up to $25,000/yr can offset ordinary (W-2) income if you actively participate and your MAGI is under $100k (phasing out to $0 by $150k); unused losses carry forward. On sale, claimed depreciation is recaptured at up to 25%, and gains may owe capital-gains tax (a 1031 exchange can defer both). Figures are a year-1 estimate at your 24.0% rate — not tax advice; consult a CPA.
Schools (NCES district)
- District
- Meriden School District
- NCES district ID
- 0902400
- Math proficiency
- 27% ▼ -8.00%
- Reading proficiency
- 41% ▼ -6.00%
- Median HH income
- $53,883
- Composite
- 29.84/100
- National rank
- #6413
- State rank
- #116 of 153 in CT
Livability — Meriden
- Score
- 85/100
- State rank
- #4
- US rank
- #505
Category grades
Schools grade is shown separately in the Schools card above.
Census & demographics
- Census place
- Meriden, CT
- County
- New Haven County · 688,236 people
- City population
- 60,545
- Metro
- New Haven-Milford, CT
- Population (ZIP)
- 35,694
- Household income
- $71,250
- Rent vs Own
- Severe rent burden
- 1516.0
Population outlook (South Central Connecticut County) Hauer SSP2
- By 2040
- 608,362
Race, ethnicity, and origin ACS 2023
- Neighborhood character
- Diverse neighborhood (Simpson 0.60)
- Race & ethnicity
- White 51% Hispanic / Latino 36% Two or more races 16% Black 7% Asian 3%
- Hispanic origin (detail)
- Mexican 6% Puerto Rican 23% Dominican 3%
- Common ancestry
- Romanian 8% Lithuanian 4% Scotch-Irish 2%
- Foreign-born
- 10% · Canada, China, South Korea
- Languages at home
- 70% English-only · Spanish 25% Russian/Polish/Slavic 1% Other Indo-European 1%
Political lean MEDSL · South Central Connecticut
- 2024 margin
- Strong D (+20.1) · D 59.0% · R 38.9% · Other 2.1%
- All cycles
- 2024: D+20.1
Not yet ingested
- Civics
- —
Market trends
- HPI YoY
- ▼ -154.37%
- Current HPI
- 263.7288
- Rent YoY
- ▲ 1.65%
- Metro
- New Haven-Milford, CT
- State GDP YoY
- ▲ 1.06%
- F500 in state
- 38
Industry mix (Fortune 500 HQ in CT)
| Industry | F500 HQs | Revenue |
|---|---|---|
| Industrial Machinery | 4 | $38B |
|
||
| Insurance | 3 | $71B |
|
||
| Financial Services | 2 | $25B |
|
||
| Transportation / Logistics | 2 | $18B |
|
||
| Healthcare | 1 | $247B |
|
||
| Telecommunications | 1 | $55B |
|
||
Price history
+72.4% since first listed4 events — show timeline
- 2026-05-23 Listed $255,000 Smart MLS
- 2026-05-18 Coming Soon $255,000 Smart MLS
- 2007-07-06 Listing Removed — Smart MLS
- 2006-07-06 Listed $147,900 Smart MLS
Property tax history
-0.7%/yrLatest (2023): $3,651 · +6.0% YoY. Source: county tax records.
Cash-flow waterfall
monthlySold comps — $/sqft
last 12 mo · ≤1 miLoading sold comps…