None · Plantation, FL
Flood risk 1/10 · Minimal
- FEMA flood zone
- X (shaded)
- Chance of flooding over 30 yrs
- 0.0%
- Est. flood insurance / yr
- $507 – $1,088
Fire risk 1/10 · Minimal
- Est. fire insurance / yr
- $947 – $1,759
Heat risk 9/10 · Severe
- Hot days now (above 105°F)
- 6 days/yr
- Hot days in 30 yrs
- 21 days/yr
Wind risk 10/10 · Severe
- Chance of severe wind over 30 yrs
- 99.0%
Air-quality risk 2/10 · Minimal
- Unhealthy air days now
- 2 days/yr
- Unhealthy air days in 30 yrs
- 2 days/yr
Risk factors via First Street. Map © Google.
Why this score? — see what drove the C- grade
The composite is a weighted blend of 9 inputs, each scored 0–100. Each bar is that input's sub-score; the figure is the points it added to the 100-point composite (weight × sub-score).
- ARV discount +15.0/15.0
- Cash flow +14.5/30.0
- DSCR +4.4/10.0
- Schools +4.1/10.0
- Livability +4.1/5.0
- 1% rule +4.0/10.0
- Rent growth +3.2/5.0
- Condition / age +2.2/5.0
- Appreciation +0.0/10.0
$488,000
🖨 Deal sheet (PDF) 📄 Offer letter ✓ Due diligence
Listing remarks
Short sale approved. House needs works BACK ON THE MARKET. The previous deal fell through. There is a Florida Green second lien FOR $80,000 that covered impact windows and doors on the property that needs to be paid in full by the buyer.
Key facts
- 0.29 acre lot
- 2 garage spots
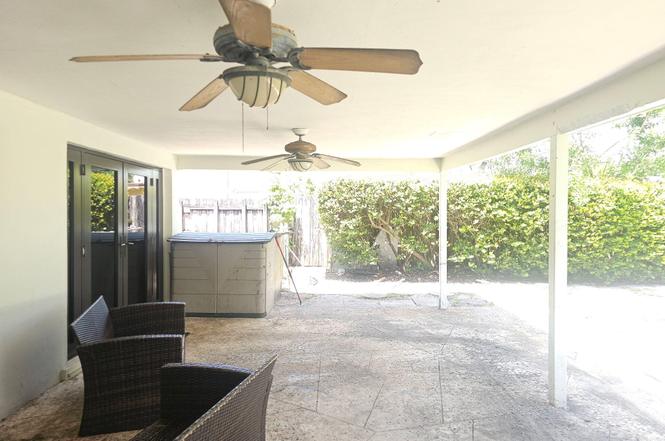
- Pool
Property features AI
Exterior
- Parking: 2-car garage; Covered parking for 2 vehicles; Circular driveway; Garage door opener
- Utilities: Public water; Public sewer
- Home design: Single-family residence; One story; First-floor entry; Resale property
- Construction: CBS construction; Spanish tile roof; Built on one level
- Exterior features: Private in-ground pool; South-facing
Interior
- Kitchen: Dishwasher
- Bedrooms: One main-level bedroom
- Flooring: Ceramic tile
- Bathrooms: Two full bathrooms (one on the main level)
- Heating & cooling: Central heating; Central air conditioning
- Interior features: Dishwasher; Ceramic tile flooring
Neighborhood map
What this means for you Summary
Snapshot
- This is a 4-bed/2.0-bath single-family listed at $488k. Condition is rated fair.
Deal economics
- At list price, monthly cash flow is $105 ($1k/yr) — positive.
- The deal already cash-flows at list — no discount required.
- To meet the 1% rule (rent ≥ 1% of price), the offer needs to be $440k (9.8% below list).
- Recommended offer: $440k (9.8% below list) — sets the bar for 1% rule.
- Cap rate 6.6% vs local median 3.4% in Plantation — top-decile yield for the area; either an underpriced asset or a hidden risk that comps aren't pricing in. Stress-test before assuming the spread holds.
Location & tenants
- Location reads 82/100 on livability (#70 in FL, #1,174 nationally) — a professional / high-income tenant draw. Strengths: commute A+, housing A+, health & safety A+; Watch: amenities C-, cost of living D-.
- Broward (suburban): math 42% / reading 53% proficiency, ranked #46 of 73 in FL (top 63%) — families likely to look elsewhere, expect single-tenant / working-renter base with shorter leases.
- Zoned schools: Nova Blanche Forman Elementary (math 35% / reading 55%, grade D-, #1,271 of 2,144 statewide, top 60%, 769 students, 72% FRL); Nova Middle School (math 44% / reading 53%, grade C-, #274 of 571 statewide, top 50%, 1,284 students, 68% FRL); Nova High School (math 22% / reading 56%, grade F, #312 of 667 statewide, top 48%, 2,227 students, 59% FRL) — zoned schools average 66% FRL vs 51% district-wide (15 pts higher); higher-poverty schools than district average — tighter screening recommended.
- Market conditions: Rents rising (+2.8%/yr); 217 active listings in the ZIP; 38 comparable units currently listed for rent nearby; rentals at typical pace (median 24d on market — plan ~3-4 weeks tenant-placement turnaround); solid renter incomes; 2,111 units permitted in Broward County in 2024 (1,265 in 5+ unit buildings).
- At $4,402/mo this rent would consume 56% of the median local household income ($94k/yr) (locally 953% of renters already pay >50% of income on rent) — very limited rent-growth headroom before tenants either downsize or default.
Forward outlook
- Local home prices are declining (-3.0%/yr); year-one equity from $3k of loan paydown is wiped out by about $15k of value loss. Plan a longer hold.
- Broward County population projected at +34% by 2050 — long-run rental-demand tailwind backs the buy-and-hold thesis.
Negotiation context
- It's been on market 48 days — a 3% lower offer ($473k) is reasonable based on typical stale-listing flexibility.
- 2 sale attempts with the ask held roughly flat each time — persistent listings suggest the price (not the market) is what's stuck; bring a comps-based counter.
Risks & watch-outs
- Climate carrying-cost: severe wind risk, 99% chance of damaging wind over 30y; extreme-heat days projected 6→21/yr by 2055 (HVAC capex compounding) — expect insurance premiums to compound above CPI over the hold.
Questions for the listing agent
- It's been on market 48 days. Have you received any prior offers? Is the seller open to a 10% concession, seller financing, or rate buy-down credit?
- Have any recent inspections been done? Can we get a copy of the seller's disclosures and any deferred-maintenance estimates?
- Built in 1966 — when were the roof, HVAC, electrical panel, plumbing, and water heater last replaced?
- Is there a deadline driving the sale (1031 exchange, divorce, estate, relocation)? That informs how much negotiation room exists.
- Schools are B-rated — typically a magnet for longer-tenancy family renters. What's the average tenant stay here, and is there a school-zone premium baked into asking?
- What's the average days-on-market for RENTAL listings here right now (not sales)? A rising rental-DOM trend means longer vacancies and softer asking-rent achievability than the comps imply.
- What's the recent tenant-quality profile in this submarket — average credit score on applications, eviction rate, late-payment / NSF rate, and stable-employment percentage? A property-management company in the area should have these aggregated.
- How much new for-sale + rental construction is in the pipeline within 1–3 miles? Heavy new supply typically softens prices + rents 12–24 months out; constrained supply supports both.
Investment metrics
- 1% rule
- 0.90% ✗
- Cap rate
- 6.55%
- Cash-on-cash
- 0.93%
- DSCR
- 1.04
- GRM
- 9.2
CMA / ARV
- ARV (on-the-fly)
- $718,616
- Comps found
- 5
Show comp detail 5 sales within ~0.75 mi
| Address | Dist | Beds/Ba | Sqft | Sold | Price | $/sf | Match |
|---|---|---|---|---|---|---|---|
| 5540 SW 3rd St | 0.38mi | 3/2.5 (-1) | 2,150 (+3%) | 2mo | $740,000 | $344 | 69 |
| 6020 Almond Ter | 0.58mi | 3/2.5 (-1) | 2,122 (+2%) | 2mo | $860,000 | $405 | 61 |
| 342 NW 47th Ave | 0.64mi | 4/2.0 | 1,984 (-5%) | 7mo | $395,000 | $199 | 56 |
| 5640 SW 3rd St | 0.42mi | 3/3.0 (-1) | 2,000 (-4%) | 14mo | $620,000 | $310 | 52 |
| 5510 SW 6th St | 0.65mi | 3/2.0 (-1) | 1,813 (-13%) | 12mo | $645,000 | $356 | 33 |
Match score weights: distance 35% · size 25% · config 20% · recency 20%. Top-matched comps best support the ARV.
Projected returns pro-forma
-3.0% appreciation · 2.8% rent growth · sell at horizon
- IRR
- -15.0%
- Equity multiple
- 0.46×
- Total profit
- $-73,179
- Equity at exit
- $72,762
- IRR
- -6.7%
- Equity multiple
- 0.57×
- Total profit
- $-58,419
- Equity at exit
- $42,193
Cash invested: $136,640 (down + closing). Projections, not guarantees.
Landlord ↔ Tenant lean methodology
- Overall (STATE)
- 87 Strongly Landlord-Friendly
- State Florida
- 87 Strongly Landlord-Friendly · R+3
- County
- — inherits STATE
- City
- — inherits STATE
ZIP-level market 33317
- Rents YoY
- 2.8%
- Active inventory
- 217
- Price-to-rent
- 9.2×
Monthly cashflow live
- Estimated rent
- $4,402 high interval (Pro) →
- Mortgage (P&I)
- −$2,559
- Tax est. 1.5%
- −$610 /mo · $7,320/yr
- Insurance
- −$203
- HOA
- −$0
- Vacancy / Maint / Mgmt
- −$925
- Net cashflow
- $105
Break-even live
Sensitivity live
| Price | -10% $443 | -5% $274 | +0% $105 | +5% $-63 | +10% $-232 |
|---|---|---|---|---|---|
| Rent | -10% $-242 | -5% $-68 | +0% $105 | +5% $279 | +10% $453 |
| Rate | -1.0pp $351 | -0.5pp $230 | base $105 | +0.5pp $-21 | +1.0pp $-150 |
UW: 25.0% down · 7.5% · 30yr · 1.5% tax · 5.0% vac · 8.0% maint · 8.0% mgmt
Financing live
Cash to close
- Down payment
- $122,000
- Closing costs
- $14,640
- Reserves months
- —
- Total cash needed
- —
Loan-product check · same deal, 3 products live
Conventional
25% down · 7.5% · 30yr
- Down + closing
- —
- Monthly P&I
- —
- Monthly cashflow
- —
- DSCR
- —
- Eligible?
- —
Personal DTI + credit; lowest rate.
DSCR
20% down · 8.5% · 30yr
- Down + closing
- —
- Monthly P&I
- —
- Monthly cashflow
- —
- DSCR
- —
- Eligible?
- —
No personal income docs; deal must DSCR.
Hard money
10% down · 12.0% · 12mo
- Down + closing
- —
- Monthly P&I
- —
- Monthly cashflow
- —
- DSCR
- —
- Eligible?
- —
Short-term bridge; refi at stabilization.
Rent comps 38 comps
| Address | Beds | Baths | Sqft | Rent | $/sqft | DOM | Units | Dist |
|---|---|---|---|---|---|---|---|---|
| 217 E Acre Dr Plantation, FL | 3.0 | 2.0 | 1726 | $4,500 | $2.61 | 5d | 1 | 0.17mi |
| 217 E Acre Dr Plantation, FL | 3.0 | 2.0 | 1726 | $4,500 | $2.61 | 26d | 1 | 0.17mi |
| 101 SW 58th Ave Unit 101 Plantation, FL | 5.0 | 4.0 | 2631 | $5,499 | $2.09 | 17d | 1 | 0.37mi |
| 101 SW 58th Ave Unit 101 Plantation, FL | 5.0 | 4.0 | 2631 | $4,999 | $1.90 | 9d | 1 | 0.37mi |
| 410 SW 55th Ave Plantation, FL | 3.0 | 2.0 | 1856 | $5,500 | $2.96 | 24d | 1 | 0.48mi |
| 510 E Acre Dr Plantation, FL | 3.0 | 2.0 | 1450 | $4,600 | $3.17 | 15d | 1 | 0.49mi |
| 510 E Acre Dr Plantation, FL | 3.0 | 2.0 | 1450 | $3,950 | $2.72 | 12d | 1 | 0.49mi |
| 192 SW 62nd Ter Plantation, FL | 3.0 | 2.0 | 2252 | $4,350 | $1.93 | 26d | 1 | 0.69mi |
| 192 SW 62nd Ter Plantation, FL | 3.0 | 2.0 | 2252 | $4,200 | $1.87 | 6d | 1 | 0.69mi |
| 5680 SW 7th St Plantation, FL | 3.0 | 3.0 | 2372 | $5,900 | $2.49 | 18d | 1 | 0.78mi |
| 545 NW 46th Ave Plantation, FL | 3.0 | 2.0 | 1442 | $4,000 | $2.77 | 26d | 1 | 0.80mi |
| 491 NW 45th Ter Plantation, FL | 5.0 | 2.0 | 2103 | $4,000 | $1.90 | 9d | 1 | 0.82mi |
| 401 SW 63rd Ter Plantation, FL | 4.0 | 2.0 | 1787 | $5,000 | $2.80 | 26d | 1 | 0.85mi |
| 920 SW 50th Ave Plantation, FL | 4.0 | 3.0 | 1625 | $7,200 | $4.43 | 26d | 1 | 0.97mi |
| 920 SW 50th Ave Plantation, FL | 4.0 | 3.0 | 1625 | $7,200 | $4.43 | 5d | 1 | 0.97mi |
| 913 SW 49th Ave Plantation, FL | 3.0 | 2.0 | 1761 | $4,000 | $2.27 | 26d | 1 | 0.99mi |
| 913 SW 49th Ave Plantation, FL | 3.0 | 2.0 | 1761 | $4,000 | $2.27 | 9d | 1 | 0.99mi |
| 913 NW 45th Ter Unit 913 Plantation, FL | 3.0 | 2.5 | 1616 | $3,525 | $2.18 | 26d | 1 | 1.08mi |
| 6101 SW 9th St Plantation, FL | 4.0 | 2.0 | 2206 | $5,400 | $2.45 | 18d | 1 | 1.11mi |
| 1101 NW 55th Ave Lauderhill, FL | 4.0 | 2.0 | 2443 | $2,800 | $1.15 | 21d | 1 | 1.11mi |
| 4330 SW 7th St Plantation, FL | 3.0 | 2.0 | 2148 | $5,000 | $2.33 | 26d | 1 | 1.12mi |
| 4384 NW 9th St Unit 4384 Plantation, FL | 3.0 | 2.5 | 1616 | $3,550 | $2.20 | 26d | 1 | 1.14mi |
| 4393 NW 9th St Unit 4393 Plantation, FL | 3.0 | 2.5 | 1616 | $3,500 | $2.17 | 26d | 1 | 1.15mi |
| 681 NW 42nd Ave Plantation, FL | 3.0 | 2.5 | 1558 | $2,950 | $1.89 | 26d | 1 | 1.21mi |
| 5821 SW 13th St Plantation, FL | 3.0 | 2.0 | 1916 | $5,500 | $2.87 | 26d | 1 | 1.22mi |
| 677 NW 42nd Ave #677 Plantation, FL | 3.0 | 2.5 | 1672 | $2,400 | $1.44 | 9d | 1 | 1.24mi |
| 677 NW 42nd Ave #677 Plantation, FL | 3.0 | 2.5 | 1672 | $2,500 | $1.50 | 26d | 1 | 1.24mi |
| 5804 NW 14th St Sunrise, FL | 3.0 | 2.0 | 1682 | $3,450 | $2.05 | 26d | 1 | 1.35mi |
| 6220 SW 14th St Plantation, FL | 4.0 | 2.5 | 2409 | $8,000 | $3.32 | 4d | 1 | 1.38mi |
| 1321 NW 50th Ave Lauderhill, FL | 3.0 | 2.0 | 2030 | $2,700 | $1.33 | 7d | 1 | 1.41mi |
| 3811 NW 6th Pl Lauderhill, FL | 3.0 | 2.0 | 1528 | $3,900 | $2.55 | 7d | 1 | 1.42mi |
| 7000 Plantation Rd Plantation, FL | 4.0 | 2.5 | 1996 | $4,500 | $2.25 | 26d | 1 | 1.45mi |
| 1130 NW 43rd Ter Lauderhill, FL | 5.0 | 2.0 | 1580 | $4,695 | $2.97 | 9d | 1 | 1.45mi |
| 5941 NW 14th Ct Sunrise, FL | 3.0 | 2.0 | 2617 | $3,500 | $1.34 | 6d | 1 | 1.46mi |
| 5941 NW 14th Ct Unit 1 Sunrise, FL | 3.0 | 2.0 | 2617 | $3,500 | $1.34 | 12d | 1 | 1.46mi |
| 600 NW 38th Ave Lauderhill, FL | 4.0 | 2.0 | 1428 | $2,700 | $1.89 | 26d | 1 | 1.47mi |
| 410 Pennsylvania Ave Fort Lauderdale, FL | 3.0 | 2.0 | 1928 | $3,600 | $1.87 | 26d | 1 | 1.47mi |
| 1110 SW 42nd Ave Plantation, FL | 3.0 | 2.0 | 1650 | $3,200 | $1.94 | 26d | 1 | 1.47mi |
Listing history 3 events
-
2026-04-08status Active
-
2025-11-03historical
-
2025-09-09$488,000
ⓘ Source: listings_history table (triggers on properties + properties_extension) + one-shot
backfill from property_details.listing_events for pre-trigger history.
Climate risk First Street
- Flood 1/10 Low FEMA zone X (shaded) · 0% chance over 30 yrs
- Wildfire 1/10 Low
- Heat 9/10 Extreme 6 d/yr ≥105°F today · 21 d/yr by 30 yrs out
- Wind 10/10 Extreme 99% chance of damaging wind over 30 yrs
- Air quality 2/10 Low 2 unhealthy d/yr today · 2 by 30 yrs out
Nearby sold comps map
Loading sold comps map…
Walkable amenities ~0.75 mi
Loading nearby amenities…
Taxation est. · year 1
- Rental income
- $52,829
- − Mortgage interest
- −$27,336
- − Property taxes
- −$7,320
- − Insurance
- −$2,440
- − Repairs & maintenance
- −$4,226
- − Management
- −$4,226
- − Depreciation
- −$14,196
- Taxable loss
- −$6,916
- Est. tax savings @ 24.0%
- +$1,660
- After-tax cash flow
- $2,925/yr
For passive investors: Depreciation is non-cash, so a rental often shows a tax loss while cash-flowing — sheltering income. Rental losses are passive: they offset passive income freely, and up to $25,000/yr can offset ordinary (W-2) income if you actively participate and your MAGI is under $100k (phasing out to $0 by $150k); unused losses carry forward. On sale, claimed depreciation is recaptured at up to 25%, and gains may owe capital-gains tax (a 1031 exchange can defer both). Figures are a year-1 estimate at your 24.0% rate — not tax advice; consult a CPA.
Condition & rehab AI · 11 photos
The home requires moderate repairs and maintenance, including painting, landscaping, and window updates, to improve its condition and value.
Repairs flagged
- Major Exterior walls — Weathered and discolored, likely requiring repainting.
- Major Interior walls — Paint appears faded and needs touch-ups.
- Major Landscaping — Overgrown and needs pruning and refreshing.
- Major Windows — Could be updated for energy efficiency and appearance.
- Major Flooring — Worn and could benefit from cleaning and possibly replacement.
Value-add opportunities
- Both Painting and refreshing the exterior and interior — Enhances curb appeal and interior aesthetics.
- Both Landscaping and curb appeal improvements — Improves the home's overall appearance and value.
- Both Window replacement or energy-efficient windows — Enhances energy efficiency and curb appeal.
- Both Flooring replacement or cleaning — Improves the home's interior and rental value.
- Both Structural inspection — Ensures the home's structural integrity and peace of mind for potential buyers or renters.
Renovation cost estimate screening
| Repair item | Severity | Est. cost |
|---|---|---|
| Exterior walls · Weathered and discolored, likely requiring repainting. | Major | $15,000–50,000 |
| Interior walls · Paint appears faded and needs touch-ups. | Major | $15,000–50,000 |
| Landscaping · Overgrown and needs pruning and refreshing. | Major | $15,000–50,000 |
| Windows · Could be updated for energy efficiency and appearance. | Major | $15,000–50,000 |
| Flooring · Worn and could benefit from cleaning and possibly replacement. | Major | $15,000–50,000 |
| Total estimated repair cost · 5 items | $75,000–250,000 |
Value-add ROI direction
- Both Painting and refreshing the exterior and interior — Enhances curb appeal and interior aesthetics. ↑
- Both Landscaping and curb appeal improvements — Improves the home's overall appearance and value. ↑
- Both Window replacement or energy-efficient windows — Enhances energy efficiency and curb appeal. ↑
- Both Flooring replacement or cleaning — Improves the home's interior and rental value. ↑
- Both Structural inspection — Ensures the home's structural integrity and peace of mind for potential buyers or renters. ↑
ⓘ Cost ranges are severity-bucket heuristics (US national rule-of-thumb). Get contractor quotes + a written scope before underwriting a rehab budget.
Schools (NCES district)
- District
- Broward
- NCES district ID
- 1200180
- Math proficiency
- 42% ▼ -18.00%
- Reading proficiency
- 53% ▼ -5.00%
- Median HH income
- $52,139
- Composite
- 40.88/100
- National rank
- #3621
- State rank
- #46 of 73 in FL
Livability — Plantation
- Score
- 82/100
- State rank
- #70
- US rank
- #1174
Category grades
Schools grade is shown separately in the Schools card above.
Census & demographics
- Census place
- Plantation, FL
- County
- Broward County · 1,963,430 people
- City population
- 111,690
- Metro
- Miami-Fort Lauderdale-Pompano Beach, FL
- Population (ZIP)
- 37,950
- Household income
- $93,603
- Rent vs Own
- Severe rent burden
- 953.0
Population outlook (Broward County) Hauer SSP2
- Today (2025)
- 2,207,033 people
- By 2030
- 2,360,704 · +7.0%
- By 2040
- 2,661,208 · +20.6%
- By 2050
- 2,946,698 · +33.5%
- By 2075
- 3,602,273 · +63.2%
- By 2100
- 3,970,984 · +79.9%
Race, ethnicity, and origin ACS 2023
- Neighborhood character
- Highly diverse neighborhood (Simpson 0.71)
- Race & ethnicity
- Hispanic / Latino 37% White 32% Black 23% Two or more races 22% Asian 4%
- Hispanic origin (detail)
- Mexican 3% Puerto Rican 7% Cuban 7% Dominican 2%
- Common ancestry
- Hispanic 7% Romanian 2% Italian 1%
- Foreign-born
- 33% · Canada, Jamaica, South Korea
- Languages at home
- 58% English-only · Spanish 30% French/Haitian/Cajun 7% Other Indo-European 2%
Political lean MEDSL · Broward
- 2024 margin
- D (+17.0) · D 58.0% · R 41.0%
- 2008→2024 swing
- -17.8pp toward R · 2008: 34.7pp · 2024: 17.0pp
- All cycles
- 2024: D+17.0 2020: D+29.8 2016: D+35.0 2012: D+34.9 2008: D+34.7
Not yet ingested
- Civics
- —
Market trends
- HPI YoY
- ▼ -269.35%
- Current HPI
- 432.04
- Rent YoY
- ▲ 2.80%
- Metro
- Miami-Fort Lauderdale-Pompano Beach, FL
- State GDP YoY
- ▲ 3.28%
- F500 in state
- 36
Industry mix (Fortune 500 HQ in FL)
| Industry | F500 HQs | Revenue |
|---|---|---|
| Industrial Technology | 2 | $29B |
|
||
| Insurance | 2 | $17B |
|
||
| Retail | 1 | $60B |
|
||
| Technology Distribution | 1 | $58B |
|
||
| Homebuilding | 1 | $35B |
|
||
| Technology Manufacturing | 1 | $35B |
|
||
Price history
3 events — show timeline
- 2026-04-08 Relisted — Beaches MLS
- 2025-11-03 Listing Removed — Beaches MLS
- 2025-09-09 Listed $488,000 Beaches MLS
Cash-flow waterfall
monthlySold comps — $/sqft
last 12 mo · ≤1 miLoading sold comps…