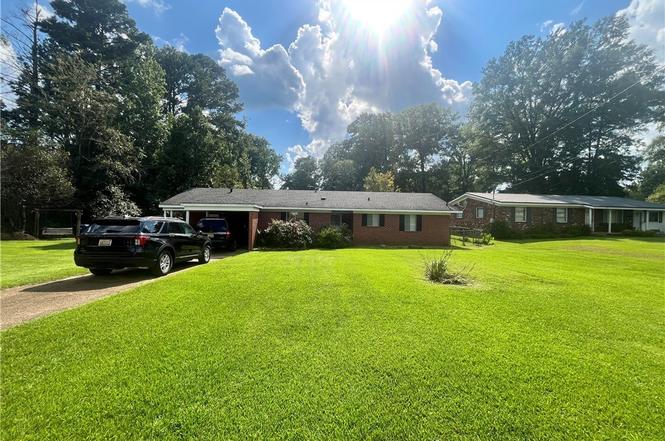
505 Patton St · York, AL
Flood risk 1/10 · Minimal
- FEMA flood zone
- X (unshaded)
- Chance of flooding over 30 yrs
- 0.0%
- Est. flood insurance / yr
- $507 – $1,088
Fire risk 4/10 · Minor
- Est. fire insurance / yr
- $916 – $1,700
Heat risk 7/10 · Major
- Hot days now (above 109°F)
- 7 days/yr
- Hot days in 30 yrs
- 21 days/yr
Wind risk 8/10 · Major
- Chance of severe wind over 30 yrs
- 80.0%
Air-quality risk 1/10 · Minimal
- Unhealthy air days now
- 0 days/yr
- Unhealthy air days in 30 yrs
- 0 days/yr
Risk factors via First Street. Map © Google.
Why this score? — see what drove the B+ grade
The composite is a weighted blend of 9 inputs, each scored 0–100. Each bar is that input's sub-score; the figure is the points it added to the 100-point composite (weight × sub-score).
- Cash flow +30.0/30.0
- ARV discount +13.7/15.0
- 1% rule +10.0/10.0
- DSCR +10.0/10.0
- Appreciation +3.1/10.0
- Livability +2.8/5.0
- Rent growth +2.5/5.0
- Condition / age +2.5/5.0
- Schools +0.7/10.0
$69,000
🖨 Deal sheet 📄 Offer letter ✓ Due diligence
Listing remarks
Move In Ready! WOW- Only $69K for a 4 bedroom, 2.5 bath brick home in Sumter County! This charming one-level house offers incredible value & space both inside & out. Situated on a large, level lot with a fully fenced backyard- ready for pets & outdoor fun. Includes a spacious outdoor shop with power for hobbies, storage & entertaining. Inside, you'll find a generous living room, separate dining area, & cozy country style kitchen with plenty of southern charm. Master suite features ample closet space & walk-in tiled shower. Convenient laundry room & half bath are located just off the main living area. This beauty is waiting for you! Roof 2017. Gas h
Key facts
- Ample closet space
- Generous living room
- Separate dining area
Tags
Neighborhood map
What this means for you Summary
Snapshot
- This is a 4-bed/2.5-bath single-family listed at $69k.
Deal economics
- At list price, monthly cash flow is $449 ($5k/yr) — positive.
- The deal already cash-flows at list — no discount required.
- Meets the 1% rule at list price ($1k rent vs $69k).
- Recommended offer: $61k (12.0% below list) — sets the bar for market timing.
Location & tenants
- Location reads 55/100 on livability (#429 in AL) — a working-class tenant base; expect higher turnover. Strengths: crime A+, cost of living A+; Watch: schools F, amenities F, commute F.
- Sumter County (rural): math 2% / reading 18% proficiency, ranked #124 of 129 in AL (top 96%) — low school quality limits family demand, transient renter base, plan for 1-2y turnover; 93% free/reduced lunch — lower-income household profile, screen leases tightly.
- Market conditions: 10 active listings in the ZIP; 4 units permitted in Sumter County in 2024 (0 in 5+ unit buildings).
Forward outlook
- Local home prices are declining (-3.0%/yr); year-one equity from $477 of loan paydown is wiped out by about $2k of value loss. Plan a longer hold.
- Sumter County population projected at -11% by 2050 — secular population decline; favor cash flow + early exit over multi-decade hold.
- At projected returns (-3.0% appreciation + 3.0% rent growth), your $19k cash investment doubles in ~5 years — after that, you're playing with house money.
Negotiation context
- It's been on market 198 days — a 12% lower offer ($61k) is reasonable based on typical stale-listing flexibility.
- 5 sale attempts; this cycle's ask has dropped $50k (42%) from the opening price — seller is motivated, your offer sets the floor, not the list.
Risks & watch-outs
- Climate carrying-cost: severe wind risk, 80% chance of damaging wind over 30y; extreme-heat days projected 7→21/yr by 2055 (HVAC capex compounding) — expect insurance premiums to compound above CPI over the hold.
Questions for the listing agent
- It's been on market 198 days. Have you received any prior offers? Is the seller open to a 12% concession, seller financing, or rate buy-down credit?
- Built in 1964 — when were the roof, HVAC, electrical panel, plumbing, and water heater last replaced?
- Why hasn't it sold? Are there any deal-killer items the seller is aware of (foundation, flood, title, zoning, code violations)?
- Is there a deadline driving the sale (1031 exchange, divorce, estate, relocation)? That informs how much negotiation room exists.
- Schools are F-rated, which usually means shorter tenancies and higher turnover. Who's the typical renter profile here, and what's been the actual vacancy rate?
- What's the average days-on-market for RENTAL listings here right now (not sales)? A rising rental-DOM trend means longer vacancies and softer asking-rent achievability than the comps imply.
- What's the recent tenant-quality profile in this submarket — average credit score on applications, eviction rate, late-payment / NSF rate, and stable-employment percentage? A property-management company in the area should have these aggregated.
- How much new for-sale + rental construction is in the pipeline within 1–3 miles? Heavy new supply typically softens prices + rents 12–24 months out; constrained supply supports both.
Investment metrics
- 1% rule
- 1.70% ✓
- Cap rate
- 14.10%
- Cash-on-cash
- 27.90%
- DSCR
- 2.24
- GRM
- 4.9
CMA / ARV
- ARV (on-the-fly)
- $80,109
- Comps found
- 4
Show comp detail 4 sales within ~0.75 mi
| Address | Dist | Beds/Ba | Sqft | Sold | Price | $/sf | Match |
|---|---|---|---|---|---|---|---|
| 1015 4th Ave | 0.13mi | 3/2.0 (-1) | 2,049 (+10%) | 10mo | $13,000 | $6 | 62 |
| 440 Rumley Rd | 0.17mi | 3/2.0 (-1) | 1,952 (+5%) | 18mo | $83,750 | $43 | 62 |
| 422 N Broad St | 0.42mi | 3/2.0 (-1) | 1,825 (-2%) | 10mo | $35,000 | $19 | 62 |
| 602 Oswalt Ave | 0.33mi | 3/2.0 (-1) | 1,935 (+4%) | 14mo | $129,900 | $67 | 59 |
Match score weights: distance 35% · size 25% · config 20% · recency 20%. Top-matched comps best support the ARV.
Projected returns pro-forma
-3.0% appreciation · 3.0% rent growth · sell at horizon
- IRR
- 22.0%
- Equity multiple
- 1.90×
- Total profit
- $17,442
- Equity at exit
- $10,288
- IRR
- 30.1%
- Equity multiple
- 3.70×
- Total profit
- $52,094
- Equity at exit
- $5,966
Cash invested: $19,320 (down + closing). Projections, not guarantees.
Landlord ↔ Tenant lean methodology
- Overall (STATE)
- 90 Strongly Landlord-Friendly
- State Alabama
- 90 Strongly Landlord-Friendly · R+15
- County
- — inherits STATE
- City
- — inherits STATE
ZIP-level market 36925
- Home prices YoY
- -5.2%
- Active inventory
- 10
- Price-to-rent
- 4.9×
Monthly cashflow live
- Estimated rent
- $1,172 medium interval (Pro) →
- Mortgage (P&I)
- −$362
- Tax est. 1.5%
- −$86 /mo · $1,035/yr
- Insurance
- −$29
- HOA
- −$0
- Vacancy / Maint / Mgmt
- −$246
- Net cashflow
- $449
Break-even live
UW: 25.0% down · 7.5% · 30yr · 1.5% tax · 5.0% vac · 8.0% maint · 8.0% mgmt
Financing live
Cash to close
- Down payment
- $17,250
- Closing costs
- $2,070
- Reserves months
- —
- Total cash needed
- —
Loan-product check · same deal, 3 products live
Conventional
25% down · 7.5% · 30yr
- Down + closing
- —
- Monthly P&I
- —
- Monthly cashflow
- —
- DSCR
- —
- Eligible?
- —
Personal DTI + credit; lowest rate.
DSCR
20% down · 8.5% · 30yr
- Down + closing
- —
- Monthly P&I
- —
- Monthly cashflow
- —
- DSCR
- —
- Eligible?
- —
No personal income docs; deal must DSCR.
Hard money
10% down · 12.0% · 12mo
- Down + closing
- —
- Monthly P&I
- —
- Monthly cashflow
- —
- DSCR
- —
- Eligible?
- —
Short-term bridge; refi at stabilization.
Listing history 13 events
-
2026-04-06status Pending
-
2026-02-20status Active
-
2026-02-12status Pending
-
2026-01-07status Active
-
2025-12-19status Pending
-
2025-11-18price $69,000
-
2025-10-12price $85,000
-
2025-09-16status Active
-
2025-09-16price $99,000
-
2025-09-03status Pending
-
2025-08-31status Active
-
2025-08-20status Pending
-
2025-08-01$119,000 Active
ⓘ Source: listings_history table (triggers on properties + properties_extension) + one-shot
backfill from property_details.listing_events for pre-trigger history.
Climate risk First Street
- Flood 1/10 Low FEMA zone X (unshaded) · 0% chance over 30 yrs
- Wildfire 4/10 Moderate
- Heat 7/10 Severe 7 d/yr ≥109°F today · 21 d/yr by 30 yrs out
- Wind 8/10 Severe 80% chance of damaging wind over 30 yrs
- Air quality 1/10 Low 0 unhealthy d/yr today · 0 by 30 yrs out
Nearby sold comps map
Loading sold comps map…
Walkable amenities ~0.75 mi
Loading nearby amenities…
Taxation est. · year 1
- Rental income
- $14,065
- − Mortgage interest
- −$3,865
- − Property taxes
- −$1,035
- − Insurance
- −$345
- − Repairs & maintenance
- −$1,125
- − Management
- −$1,125
- − Depreciation
- −$2,007
- Taxable income
- $4,563
- Est. tax owed @ 24.0%
- −$1,095
- After-tax cash flow
- $4,295/yr
For passive investors: Depreciation is non-cash, so a rental often shows a tax loss while cash-flowing — sheltering income. Rental losses are passive: they offset passive income freely, and up to $25,000/yr can offset ordinary (W-2) income if you actively participate and your MAGI is under $100k (phasing out to $0 by $150k); unused losses carry forward. On sale, claimed depreciation is recaptured at up to 25%, and gains may owe capital-gains tax (a 1031 exchange can defer both). Figures are a year-1 estimate at your 24.0% rate — not tax advice; consult a CPA.
Schools (NCES district)
- District
- Sumter County
- NCES district ID
- 0103090
- Math proficiency
- 2% ▼ -19.00%
- Reading proficiency
- 18% ▼ -3.00%
- Median HH income
- $22,830
- Composite
- 6.96/100
- National rank
- #9972
- State rank
- #124 of 129 in AL
Livability — York
- Score
- 55/100
- State rank
- #429
- US rank
- #23192
Category grades
Schools grade is shown separately in the Schools card above.
Census & demographics
- Census place
- York, AL
- Population (ZIP)
- 3,322
Population outlook (Sumter County) Hauer SSP2
- Today (2025)
- 12,289 people
- By 2030
- 11,899 · -3.2%
- By 2040
- 11,250 · -8.5%
- By 2050
- 10,972 · -10.7%
- By 2075
- 12,179 · -0.9%
- By 2100
- 13,454 · +9.5%
Race, ethnicity, and origin ACS 2023
- Neighborhood character
- Predominantly Black (86%)
- Race & ethnicity
- Black 86% White 12% Two or more races 2%
- Common ancestry
- British 1% Italian 1%
- Foreign-born
- 1% · Canada
- Languages at home
- 99% English-only · Chinese 1%
Political lean MEDSL · Sumter
- 2024 margin
- Solid D (+41.2) · D 70.3% · R 29.1%
- 2008→2024 swing
- -9.1pp toward R · 2008: 50.3pp · 2024: 41.2pp
- All cycles
- 2024: D+41.2 2020: D+48.5 2016: D+49.4 2012: D+54.6 2008: D+50.3
Not yet ingested
- Civics
- —
Market trends
- HPI YoY
- ▼ -3.72%
- Current HPI
- 67.5075
- Rent YoY
- —
- Metro
- —
- State GDP YoY
- ▲ 2.94%
- F500 in state
- 4
Industry mix (Fortune 500 HQ in AL)
| Industry | F500 HQs | Revenue |
|---|---|---|
| Financial Services | 1 | $8B |
|
||
| Healthcare | 1 | $5B |
|
||
Price history
-42.0% since first listed13 events — show timeline
- 2026-04-06 Pending — WAMLS
- 2026-02-20 Relisted — WAMLS
- 2026-02-12 Pending — WAMLS
- 2026-01-07 Relisted — WAMLS
- 2025-12-19 Pending — WAMLS
- 2025-11-18 Price Changed $69,000 WAMLS
- 2025-10-12 Price Changed $85,000 WAMLS
- 2025-09-16 Relisted — WAMLS
- 2025-09-16 Price Changed $99,000 WAMLS
- 2025-09-03 Pending — WAMLS
- 2025-08-31 Relisted — WAMLS
- 2025-08-20 Pending — WAMLS
- 2025-08-01 Listed $119,000 WAMLS
Cash-flow waterfall
monthlySold comps — $/sqft
last 12 mo · ≤1 miLoading sold comps…